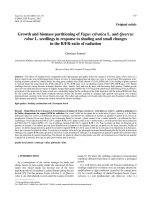
CLIMATE CHANGE IN VIET NAM: Observed and Future Projection Viet Nam Institute of Meteorology, Hydrology and Climate change
Bạn đang xem bản rút gọn của tài liệu. Xem và tải ngay bản đầy đủ của tài liệu tại đây (2.83 MB, 28 trang )
CLIMATE CHANGE IN VIET NAM:
Observed and Future Projection
Viet Nam Institute of Meteorology, Hydrology and Climate change
FOUNDATION
2014
Viet Nam Institute of
Meteorology, Hydrology
and Climate Change
(IMHEN)
2003
Viet Nam Institute of
Meteorology, Hydrology
and Environment (IMHEN)
Ministry of Natural
Resources and
Environment (MONRE)
Institute of Meteorology
and Hydrology (IMH)
Vietnam
Hydrometeorological
Service of Viet Nam (HMS)
1977
Total: 257
Prof., Assoc. Prof.: 8 PhD: 26
MSc.: 44 BSc., Engineers: 150
MAJOR ACTIVITIES AND ACHIEVEMENTS
1
Meteorology, Climatology and Agro-Meteorology
2
Hydrology, Water Resources, Marine Hydrology
3
Environment
4
Climate Change
What has Changed?
How will it change?
What has changed?
Change in temperature (°C)
In the period of 19582014, temperatures
show increasing
trends in most
observed stations
The annual average
temperatures
increased by about
0.62°C for the whole
country
Change of annual average temperature
(oC) in 1985-2014
Change in temperature (°C)
Annual and Inter-Annual anomalies of
temperature (oC) for the whole country
In average for the whole country, temperatures increased by
0.62oC in the period 1958-2014. In particular, it increased
0.42oC in period 1985-2014
Change in rainfall (%)
Total Rainfall
Decrease in the North (5,8 12,5%); Increase in the South
(6,9 - 19,8%);
Increase most in South
Central and decrease most in
Northern Delta.
Change of annual total precipitation (%)
in 1958-2014
Climate extreme
No. of
hot days
No. of
cold nights
• No. of hot days increased (34 days/decade),
• No. of cold nights decreased (11 night/decade).
Climate extreme
RX1day:
(mm/50 năm)
RX5day:
(mm/50 năm)
• Regional differences are obvious in rainfall changes, but highly
increase in the South Central, Central Highlands, and Off-seaon
rainfall and extreme rainfall occures more frequently
Climate extreme
According to the data from 1959-2015, the change in the number of
tropical depressions and typhoons in East Sea, influencing and making
landfall to Viet Nam was slight. However, the inter-annual variation of
number of tropical depressions and typhoons was substantial, sometimes
up to 18÷19 storms (in 1964, 1989, 1995 and 2013), sometimes 4÷6
storms (1963, 1969, 1976, 2014, 2015)
Climate extreme
number of typhoons with maximum wind
speed exceeding 12 category in Beafort
scale in Viet Nam East Sea (1990-2015)
No. of strong and very strong typhoon increase
Typhoon season tend to last longer and typhoon
tracks had a southward trend
Sea level rise
Mean sea level rise
rate in
Vietnam
coastal is 3.1mm yr-1
between during 1986
and 2014
Mean sea level rise
rate at island increase
more than near shore.
How will it Change?
Method for Climate Change Projection
GHG Concentration Scenarios
RCP
RCP8.5
RCP6.0
RCP4.5
RCP2.6
Temperature
Radiativ increase in SRES
e forcing 2100 (oC) equival
in 2100 compared to
ent
1986-2005
8.5
4.9
A1F1
W/m2
6.0
3.0
B2
W/m2
4.5
2.4
B1
W/m2
2.6
1.5
None
W/m2
Dynamic Downscaling Method: 5 high-resolution regional climate model
(AGCM/MRI, PRECIS, CCAM, RegCM, and clWRF), cooperation between
IMHEN and CSIRO-Australia, BCCR-Norway, MetOffice-UK, MRIJapan,UNDP.
Projection – Temperature
At the end of 21st century
North VN
1,9÷2,4oC
South VN
1,7÷1,9oC
RCP4.5
North VN
3,3ữ4,0oC
South VN
3,0ữ3,5oC
Reference
period
(1986-2005)
RCP8.5
ã RCP4.5: surface temperatures would
increase by 1.9ữ2.4oC in the North
and 1.7ữ1.9oC in the South.
3/2/2018
ã RCP8.5: temperature would increase
by 3.3ữ4.0oC in the North and
16
3.0÷3.5oC in the South
Projection – Rainfall
Reference
period
(1986-2005)
At the end of 21st century
5 – 15%
(Maybe
even
>20%)
RCP4.5
>20%
RCP8.5
Dry
season
•
•
3/2/2018
RCP4.5: annual rainfall would generally
increase in a range of 5÷15%.
RCP8.5: the greatest increase would
increase by over 20% in most of the North,
Central Coast, a part of the South and
17
Central Highlands.
Change in number of typhoon
RCP8.5
No.of
typhoon
Month
Based on the PRECIS model, the projected number of tropical depressions and
typhoons in the East Sea will decrease at the beginning of the typhoon seasons
(June - Agust) for both scenarios, RCP4.5 and RCP8.5. Thus, the tropical
depressions and typhoons will likely occur at the end of the typhoon season
which is a period of typhoon activity occuring mainly in the South
Change in number of strong typhoon
RCP8.5
No.of
typhoon
Max. wind speed
the number of weak and moderate typhoon will likely
decrease, while the number of strong typhoons will likely
increase when compared with the baseline period.
Projection – Other Extremes
• Summer moon start earlier and last
latter.
• Rainfall in monsoon increase.
• No. of cold day decreases.
• It is very likely that heat waves will
occur with higher frequency and
duration, especially in North Central,
South Central, and South.
Change in no. of hot days
(day/year)
by end of century, RCP4.5
Projection - Sea Level Rise
Khu vực I
Khu vực II
Khu vực III
II
I
Hịn
Dấu
QĐ. Hồng
Sa
Đèo
Ngan
III
g
Đèo
Hải
Vân
Khu vực IV
IV
Mũi
Đại
VLãnh
VII
Mũi
Cà
Mau
VI
Khu vực V
Mũi
Kê Gà
QĐ. Trường
Sa
Khu vực VII
Khu vực VI
By 2100:
RCP4.5 Scenarios: Sea level rise highest in
Hoàng Sa island: 58cm (36÷80cm), Trường
Sa: 57cm (33÷83cm); Cà Mau-Kiên Giang
55cm (33÷78cm); Móng Cái-Hịn Dáu and
Hịn Dáu-Đèo Ngang 53cm (32÷75cm).
RCP8.5 Scenarios: Sea level rise highest in
Hồng Sa island: 78cm (52÷107cm),
Trường Sa: 77cm (50÷107cm); Cà MauKiên Giang: 75cm (52÷106cm); Móng CáiHịn Dáu, and Hịn Dáu-Đèo Ngang: 72cm
(49÷101cm).
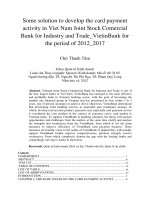
Projection - Inundation Risk
If sea level rise 100cm
QĐ Hoàng
Sa
(Việt Nam)
QĐ Trường
Sa
(Việt Nam)
• 16.0% Red River Delta, 1.5%
coastal province in the Central
(Thanh Hóa - Bình Thuận),
17.8% Hồ Chí Minh City, 38.9%
Mekong Delta are at inundation
risk.
• Large area of Vân Đồn, Cơn Đảo
and Phú Quốc islands have high
inundation risk.
• Inundation risk of Trường Sa
island is low compared to Hoàng
Sa island, especially for island in
the Lưỡi Liềm group and Tri
Tôn island.
Inundation Risk due to Sea Level Rise – Red River
Delta and Quảng Ninh
If sea level
rise 100cm,
4.79%
Quảng Ninh
province and
16.8% Red
River Delta
are inundated.
(Thái Bình:
50.9%, Nam
Định: 58.0%
are at highest
risk).
Inundation Risk due to Sea Level Rise – Hồ Chí Minh City
If sea level rise
100cm, 17.84%
Hồ Chí Minh city
is inundated (Bình
Thạnh district:
80.78%, Bình
Chánh district:
36.43%).
Inundation Risk due to Sea Level Rise – Mekong Delta
If sea level
rise 100cm,
38.9%
Mekong Delta
is inundated
(Hậu Giang
province:
80.62%, Kiên
Giang
province:
76.86%, Cà
Mau province:
57.69%).