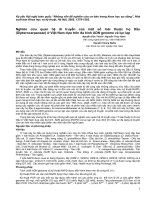
Nghiên cứu nâng cao tính chất của một số vật liệu polyme bằng khoáng talc biến tính hữu cơ TT TIENG ANH
Bạn đang xem bản rút gọn của tài liệu. Xem và tải ngay bản đầy đủ của tài liệu tại đây (1.95 MB, 26 trang )
MINISTRY OF EDUCATION
AND TRAINING
VIETNAM ACADEMY
OF SCIENCE AND TECHNOLOGY
GRADUATE UNIVERSITY OF SCIENCE AND TECHNOLOGY
-----------------------------
NGUYEN VAN THUY
STUDY ON IMPROVING THE PROPERTIES OF
SOME POLYME MATERIALS BY ORGANICALLY MODIFIED TALC
SUMMARY OF MATERIALS SCIENCE DOCTORAL THESIS
HANOI – 2021
The thesis was completed at: Graduate University of Science and Technology,
Vietnam Academy of Science and Technology.
Supervisor:
Assoc. Prof. Dr. Ngo Ke The
Reviewer 1:
Reviewer 2:
Reviewer 3:
The thesis will be defended in front of the doctoral thesis grading committee meeting at
the Graduate University of Science and Technology, Vietnam Academy of Science and
Technology. At …….hour, date…….month……..year 2021
The thesis can be found at:
- Library of Graduate University of Science and Technology
- Vietnam National Library
0
PREFACE
Talc (Mg3Si4O10(OH)2) is a mineral belonging to the group of silicate minerals. With
its crystal structure, specific physical and chemical properties, talc mineral has been widely
applied in many industries such as: ceramics, glass, plastics, rubber, paints and coating
materials; paper, agriculture, food industry, and cosmetics.
Talc is a mineral having a wide application in industries mainly due to its unique
surface chemistry and its lamellar crystals structure with high aspect ratio. Talc interacts
quite well with many matrix polymers [1-4].
To improve the interaction between fillers and the polymer matrix, many authors [57] have modified surface of the fillers by silane coupling agents before being put into a
polymer matrix.
Vietnam is a country present on the world map of talc minerals but has not yet
exploited and effectively used this special mineral. Stemming from the importance of talc
minerals as well as the specificity of their ability to interact with substrates, including
polymeric matrix, we proposed the doctoral thesis: “Study on improving the properties of
some polymeric materials by organically modified talc”
The aim of the thesis is:
Study on surface modification of talc by silane agents to increase the interaction with
rubber and epoxy resin materials.
Study on using talc to enhance the properties of polymeric materials, typically natural
rubber (NR) and NBR/PVC rubber blends; increase the protection and fire resistance of
coatings based on epoxy resin.
The main research topics of the thesis include:
Investigation of talc and study of surface modification of talc
Research on reinforcement ability of talc mineral for rubber
Study on the effect of talc on the protective ability of coatings
CHAPTER 1. OVERVIEW
1. 1. Talc and basic characteristics
The chemical formulation of talc is Mg3Si4O10(OH)2 [8,9], and it has a sandwich type of
crystal structure. Talc consists of a layer or sheet of brucite Mg(OH)2 sandwiched between two
sheets of silica SiO2 [10].
Figure 1.1. Crystal structure of talc [10]
Hình 1.2. Talc under the microscope [12]
1
1.1.1. Physicochemical properties of mineral talc
Talc exhibits stability toward heat up to temperatures as high as 16500F (9000C). It
has low thermal conductivity and high resistance to thermal shock. Pure talc is thermally
stable up to 9300C, and loses its crystalline bound water (4,8%) between 9300C and 9700C,
leaving an enstatite (anhydrous magnesium silicate) and cristobalite residue. Enstatite is
significantly harder than talc with a Mohs hardness of 5-6 [28]. Most commercial talc
products have thermal loss below 9300C on account of presence of carbonates, which lose
carbon dioxide at 6000C, and chlorite, which loses water at 8000C. Talc’s melting point is at
15000C. When heated, talc has a strong thermal effect starting from 9000C, normally 9201060°C if heated in air. At this temperature talc is chemically dehydrated to form
magnesium metasilicate [29,30]:
3 MgO.4SiO2.H2O
3 MgSiO3 + SiO2 + H2O
(talc)
Then SiO2 is separated in the amorphous state. At 11000C it partially converts to
cristobalite with volume expansion. Cristobalite has a low density and it compensates for
the shrinkage of talc heating. Therefore, the volume of talc when calcined is very stable.
Thanks to its volumetric stability and softness, it allows us to create talc ore into pellets,
which can be used as bricks for furnaces and gas fuel combustion chambers.
1.1.2. Origin of mineral talc
1.1.3. Chemical composition and composition of talc
1.1.4. Classify
Plate talc: This type of talc has a clear, very smooth, sheet-like structure, often
containing >90% of the mineral talc (which may be natural or may be processed). This type
of talc can be used in cosmetics, pharmaceuticals, and reinforcement.
Steatite talc: is a type of talc with high purity, dense, very fine grain (may be due to
grinding). This type of talc has high insulating properties and is used in the manufacture of
insulating porcelain. This is the purest commercial talc.
Soapstone: Less pure talc than steatite talc, which can be carved, sawn, drilled or
processed. Due to its chemical stability, high heat resistance and consistency, this form of
talc can be used to make products such as sinks and stoves.
Talc tremolite: the kind of fine-grained talc but very hard, usually containing <50%
mineral talc, but the properties are determined by the hard tremolite and the fine, plate-like
serpentine.
1.2. Silane Coupling Agents
Silane coupling agents are silicon based chemicals that contain two types of
reactivity inorganic and organic in the same molecule. A typical general structure is
(RO)3SiCH2CH2CH2-X
Where RO is a hydrolyzable group, such as methoxy, ethoxy, or acetoxy, and X is an
2
organofunctional group, such as amino, methacryloxy, epoxy, etc [46,47].
1.2.1. Surface modification of mineral powders by silanes
Reaction of these silanes involves four
steps:
1. Initially, hydrolysis of the three labie
groups occurs
2. Condensation to oligomes follows
3. The oligomers then hydrogen bond
with OH groups of the substrate
4. Finally during drying or curing, a
covalent linkage is formed with
concomitant loss of water.
Figure 1.6. Hydrolytic Deposition of Silane
1.2.2. Surface modification of talc by silane
The procedure of talc modification is an important variable. Other with a number of
different fillers such as silicon oxide, talc shows a slight alkaline character in water and
modification of the suface should be conducted in the presence of acidic agents, to improve
condensation degree. When coupling agents are used chemical bonds can be created at the
surface of fillers between hydroxyl or silanol groups and alcoxyl groups of the couling
agents.
Figure 1.12. Mechanism of protonation of the silane molecule
Figure 1.13. Mechanism of surface silanization of talc in the presence of an acid agent
1.3. Applications of talc in industries
1.3.1. Talc in cosmetics and pharmaceuticals
1.3.2. Talc in the paper industry, agriculture and food
3
1.3.3. Talc in rubber
Talcs reduce the viscosity of rubber compounds, thereby facilitating the processing of
moulded parts. They also improve extrudate qualities, increasing production rates and
enhancing UV radiation resistance of exterior parts. In gaskets, they provide good
compression resistance. In cables, talcs function as insulators [16].
1.3.4. Talc in plastic
1.3.5. Talc in paints and flame retardant coating materials
1.3.5.1. Talc in paints
The lamellar form of talc makes the paint easier to apply and improves resistance to
cracking and sagging of the paint film. They also increase the glossiness and corrosion
resistance of primers, and talc is used to improve corrosion resistance and film adhesion
[16].
1.3.5.2. Talc in intumescent coating materials
Talc is used as a filler in intumescent coatings as it has a higher melting point around
1300°C which can withstand higher temperatures. Talc is also a layer silicate filler which
can form a protective layer to protect the underlying substrate. Talc were used in this study
phyllosilicate. The reason for choosing talc as a filler in intumescent is their relevance in
flame retadancy that results from their ability to significantly improve the thermal stability
and self extinguishing characteristic of the polymer matrix when they are incorporated [88].
The platy structure of talc which would most easily assist in the formation of a barrier layer
and their high aspect ratio and high intumescent capacity allows efficient intercalation of the
polymer [88].
1.4. Talc and research applications in Vietnam
The search for mineral talc in Vietnam has only been started since the 90s of the 20th
century in many parts of the country. Only 16 deposits and spots, discovered talc ores are
concentrated mainly in the Northwest region, with reserves of about 7 million tons [96,97].
The Ministry of Industry and Trade has conducted zoning planning for exploration,
exploitation, processing and use of industrial minerals group talc until 2015, with a vision to
2025 [98]. According to this plan, talc reserves and resources located in Thanh Son district,
Phu Tho province are 2,714,555 tons, accounting for over 96% of total talc reserves and
resources in the country. Initial research results show that talc deposits in Thanh Son Phu
Tho area have relatively high talc content, ranging from 24.39 to 27.83% MgO, with
samples up to 30.86%.
CHAPTER 2. EXPERIMENTAL
2.1. Materials
2.1.1. Talc and surface modification
2.1.2. Rubber and rubber additives
4
2.1.3. Epoxy resin and additives
2.2. Methods
2.2.1. Surface modification of talc
2.2.2. Preparation of NR samples
2.2.3. Preparation of NBR/PVC Blend samples (P70K)
2.2.4. Preparation of paints containing talc
2.2.5. Preparation of intumescent coating
2.3. Characterization Methods
2.3.1. Investigation of physical and mechanical properties of materials
2.3.1.1. Method for determination of tensile strength
2.3.1.2. Method for determining elongation at break
2.3.1.3. Method for determining residual elongation
2.3.1.4. Method for determining the hardness of rubber materials
2.3.1.5. Method for determination of abrasion resistance
2.3.1.6. Method for determination of impact resistance of coating
2.3.1.7. Method for determination of hardness of coating
2.3.1.8. Method for determination of bend of coating
2.3.1.9. Method for determination of pull-off strength of coatings using portable
adhesion testers
2.3.2. Investigation of the structure of materials
2.3.2.1. Thermal analysis method to determine the structural composition of materials
2.3.2.2. Infrared spectroscopic method to determine the structure of materials
2.3.2.3. SEM method to determine the morphological structure of the materials
2.3.3. Investigation of fire resistance of materials
2.3.3.1. Investigation of intumescent coating by calcination method
2.3.3.2. Investigation of fire resistance according to UL 94
2.3.3.3. Investigation of fire resistance according to LOI
2.3.4. Other methods
2.3.4.1. Determination of oil absorption of talc
2.3.4.2.Determination of curing process of epoxy film by FT-IR method
2.3.4.3. Electrochemical impedance method to evaluate the protection properties of coating
CHAPTER 3. RESULTS AND DISCUSSION
3.1. Investigation of talc and study on surface modification of talc
3.1.1. Investigation of the structure and thermal stability of the mineral talc
3.1.1.1. Investigation of talc particle structure
5
The mineral talc has a crystalline structure and flakey like morphology. In this shape,
their inclusion as reinforcement for polymeric materials significantly reduces the product's
shrinkage. Materials reinforced with talc will limit blistering. Paints reinforced with talc
provide better corrosion protection.
Figure 3.1. SEM-Image of talc
After the separation process, the mineral talc is ground by a porcelain mill with a
ball:sample ratio of 10:1. This grinding process will bring the entire talc powder sample
down to the right size, free of coarse particles. The average size achieved was 6.56 μm with
Q90 = 15,875 μm.
Carrying out grinding and flotation, we obtained samples of minerals talc A, B and C
with different grain sizes. The sample mineral talc A has an average size of 4.9661 µm and
a dominant size at 4.7890 µm. The sample mineral talc B has an average size of 6.4740 µm
and a dominant size at 5.4826 µm. The sample mineral talc C has an average size of
17.4378 µm and a dominant size at 18.5767 µm.
Samples of talc A, talc B, and talc C are used to study and increase the abrasion
resistance of talc for rubber P70K.
3.1.1.2. Investigation of thermal stability and oil absorption of mineral talc
Talc is stable and does not decompose at temperatures below 8000C. Talc can be used
as filler for polymeric materials working at high temperatures, especially for heat-resistant
paints. Up to about 11000C talc is almost completely decomposed and above this
temperature range only occur phase transitions and reactions between solid phases.
Table 3.1. Oil absorption of some samples
material
Oil
STT Samples absorption
(ml/100g)
1
Talc
55
2
Sericite
51
3
Fly ash
24
Figure 3.7. DTA-TG curves of talc sample
Phu Tho
Talc is a mineral hydrophobic and more organic-loving. However, to increase the ability to
6
interact with organic matrix phases, talc still needs to be surface modified.
3.1.2. Study on surface modification of talc by silane
3.1.2.1. Effect of silane concentration by surface modification of talc
a) FT-IR spectra of talc modified with silane
Figure 3.8 shows FT-IR spectrum of γ-metacryloxypropyltrimetoxysilane. The peak
absorption at 2947 cm-1 and 2842 cm-1 characterize the valence vibrations of the bond C-H.
The sharp and strong absorption peak at 1719 cm-1 is typical for the valence oscillations of
the group C=O. The valence vibration of the vinyl group C=C has an absorption peak at
1637 cm-1
Figure 3.8. FT-IR spectrum of γFigure 3.9. FT-IR spectrum of the pristine
metacryloxypropyltrimetoxysilane
talc
Figure 3.9 shows the FT-IR spectrum of the pristine talc. The peak absorption at
3676,84 cm-1 characterizes the valence vibration bond of the group OH non-hydrogenated.
This hydroxyl group is present in the crystals of the mineral talc. The bond Si-O-Si has
characteristic valence oscillations in the region 1010 cm-1.
Infrared spectra of modified samples talc in
solutions containing 1%, 2%, 4% and 6% silane
show peaks characteristic for molecule silane at
2933 cm-1 and 1717 cm-1.
Figure 3.11. FT-IR spectrum of talc modified with 2% γ- MPTMS
b) Effect of silane concentration on thermal stability of talc
The mineral talc is quite resistant to heat. The change in mass takes place only from
about 800°C. Below this temperature there is almost no change in mass. For samples of talc
modified by silane, with low decomposition temperature, we only investigated talc surface
modified to 400°C, heating rate as low as 5°C/min.
Table 3.2: Silane content on surface mineral talc
Concentration of silane (%)
1
2
4
6
Decline Volume (%)
0,432 1,132 2,261 2,501
7
When increasing the content of silane in the solution modification in the
concentration range from 1-4%, the content of silane present on the surface of mineral talc
increased quite sharply. However, when increasing the concentration of silane to 6%, the
content of silane on the surface of talc did not increase much. This result is also consistent
with FT-IR spectra shown above. With a concentration of 2% talc surface modified silane
solution, it is consistent with the content of silane present on the mineral surface of 1.132%.
c) Effect of silane concentration on oil absorption of talc
Figure 3.18 shows the oil absorption graph of the original talc and the talc surface
modified by silane γ-MPTMS with the content of 0%, 1%, 2%, 4% and 6%.
There was a significant difference in oil absorption between the talc modified and
unmodified with silane. Surface-modified talc have better oil absorption capacity than
unmodified (an increase of about 16%). This indicates that the interaction of surfacemodified talc with organic substances has been significantly improved.
Figure 3.18. Oil absorption of samples talc
3.1.2.2. Effect of reaction temperature on surface modification
a) FT-IR Spectra of talc modified with silane at different reaction temperature
Figure 3.19. FT-IR spectra of modified talc Hình 3.20. FT-IR spectra of modified talc at
at reaction temperature of 30°C
reaction temperature of 40°C
Compared with the infrared spectrum of surface modified talc in silane solution at
30°C, it can be seen that, with the reaction temperature being increased to 40°C, the
intensity of spectral lines is specific to the molecule silane increased slightly at the spectral
lines 2936 cm-1 and 1719 cm-1 (see Figure 3.20), which shows that temperature also has an
influence on the surface modification reaction of talc.
b) Effect of reaction temperature on thermal stability of talc
It can be seen that when increasing the reaction temperature from 30°C to 40°C, there
is a slight increase in the weight of silane on the surface of talc minerals (1,132% to
8
1,162%). However, when increasing the reaction temperature to 60°C, the content of silane
decreased significantly to 0,901 %. If the reaction temperature continues to increase to
90°C, the volume of silane present on the surface of talc is only 0,332%. These results are
completely consistent with the FT-IR spectral results we have shown above.
Table 3.3: Silane content on the surface of modified talc at different temperatures
Modification solution temperature (°C)
30
40
60
90
Content of silane (%)
1,132 1,162 0,901 0,332
c) Effect of reaction temperature on oil absorption of talc
The results of measuring the oil absorption of talc minerals showed that the surface
modified talc had higher oil absorption than the unmodified talc. The surface modified talc
at the reaction temperature of 40°C had the highest oil absorption with 66 ml/100g (an
increase of 20% compared to the unmodified sample).
Figure 3.27. Oil absorption of modified talc
at different temperatures
This indicates that the talc surface modified at 40°C gives the best phase interaction
with organic substrates. Talc surface modified at 30°C and 60°C had different silane content
on the surface but had the same oil absorption. The sample of talc modified at 90°C had the
lowest silane content, so it had the lowest oil absorption, however, it was still higher than
the undenatured sample. This shows that with a low content of silane on the surface, the
surface properties or phase interaction with the substrate has also been improved.
3.1.2.3. Effect of reaction time on surface modification
Study on the effect of talc silanification reaction time was carried out at the
concentration of γ-metacryloxypropyltrimetoxysilane 2% and the temperature of 400C.
a) FT-IR Spectra of modified talc at different reaction time
With a reaction time of 1 hour (see figure 3.29), on the infrared spectrum of the talc
modified, a typical peak for silane molecule appeared in the region of 2900 cm-1. However,
the intensity of this characteristic peak is very small, so it is necessary to further increase the
reaction time for the silane molecules to form stable hydrogen bonds in solution.
There was a significant increase in the intensity of the silane-specific peaks when the
reaction time was increased to 2 hours (see figure 3.30). Continue to increase the reaction
time to 4 hours (see figure 3.31). There is an increase in the intensity of the silane-specific
peaks at 2936 cm-1 and 1719 cm-1. However, this increase in intensity is less than in the case
9
of increasing the reaction time from 1 hour to 2 hours.
Figure 3.29. FT-IR spectra of surface
Figure 3.30. FT-IR spectra of surface
modified talc for 1 hour
modified talc for 2 hours
When increasing the reaction time to about 2-4 hours, the process of forming
hydrogen bonds in the solution was almost stable when the intensity of the peaks specific to
the silane molecule increased significantly.
b) Effect of reaction time on thermal stability of modified talcs
Table 3.4: Silane content on surface modified talc at different time
Reaction time (hours)
0,5
1
2
4
8
Silane content (%)
0,126 0,296 0,902 1,162 1,262
The reaction time is about 4 hours for the silane content on the surface of the talc to
be almost saturated with the content of 1,162% because when the reaction time is increased
quite a lot to 8 hours, the content of silane adsorbed on the talc surface is only slightly
increased to 1.262%. This indicates that the appropriate silanification reaction time for talc
surface is 4 hours with the silane content on the surface reaching 1,162%.
c) Effect of talc reaction time on oil absorption of modified talcs
It can be seen that with
increasing reaction time, the content
of silane on the surface of talc
increases, thus the oil absorption
increases. However, this increase only
corresponds to a low reaction time,
with a higher reaction time, when the
silane content increased sharply but
the oil absorption increased only
slightly and reached the highest value
Figure 3.38. Oil absorption of surface modified talc of 66 ml/ 100g at 4h reaction time.
with different time
3.1.2.4. Effect of the reaction medium on the surface modification of talc
According to some studies have shown that silane hydrolyzed in the environment
most pH 4-5 [106]. At this pH range, the possibility of condensation of silane molecules
after hydrolysis also the smallest.
a) FT-IR Spectra of modified talcs at different reation medium
10
Figure 3.39. FT-IR spectra of modified talc
Figure 3.40. FT-IR spectra of modified talc
in solution adjusted pH
in solution unadjusted pH
It is clear that here, the intensity of spectral lines characteristic for silane molecules at
2939 cm-1 and 1724 cm-1 has a decrease compared with the case of surface-modified talc in
silane solution adjusted pH.
b) Effect of reaction medium by thermal analysis method
The mass loss of the talc surface-modified the non-pH adjusted medium was less
than in the case of the pH-adjusted surfactant solution. This is completely consistent with
the results of infrared spectroscopy as investigated. With talc surface modified in a solution
containing 2% γ-MPTMS adjusted to pH, the content of silane on the surface reached
1,162% while talc surface modified in the solution was not adjusted pH has a silane content
on the surface of 0.902%. The efficiency of the surface modification reaction is greater than
that of the surface modification process in the solution unadjusted pH.
c) Effect of reaction medium on oil absorption of modified talc
It can be seen here that the oil
absorption is only different between the
surface-modified
and
non-surfacemodified samples. There was not much
difference between samples with and
without pH adjustment. This also
reflects the thermal analysis values
determined above. The talc all had a
certain amount of silane on the surface.
The presence of silane on the surface of
talc significantly changed their surface
properties.
Figure 3.43. Oil absorption of talc unmodified
and pH-adjusted
3.1.2.5. Effect of polymerization on the durability of silane coating
a) Study on the effect of polymerization by spectroscopic method
There is no significant change in the intensity of the spectral lines specific to the
silane molecule on the infrared spectra of the eluted surface modified talc sample after
polymerization. However, with the talc surface modified being eluted before
polymerization, the presence of silane molecules is almost absent on the infrared spectrum..
11
Figure 3.44. FT-IR spectra of talc surface
Figure 3.46. FT-IR spectra of talc surface
modified eluted after polymerization
modified eluted before polymerization
b- Study on the effect of polymerization by thermal analysis method
With the talc eluted after polymerization, the residual silane content on the talc
surface was 0,705% compared with 1,132% silane content without elution. Meanwhile, if
the talc is eluted before polymerization, the remaining silane content on the surface of talc
is only 0,204%.
3.1.2.6. Effect of different silane types to the surface modification of talc
a) Surface modification of talc by different silane agents
Figure 3.49. FT-IR spectra of talc surface
modified with γ-APTMS
Figure 3.51. FT-IR spectra of talc surface
modified with γ-MPTMS
On the infrared spectrum of the talc modified by γ-APTMS, we see that there is an
absorption peak of 3418,43 cm-1 that is typical for the valence fluctuations of the N-H bond.
Peak of valence vibrations of C-H saturated bonds in the regions of 2934.25 cm-1 and 2860
cm-1 in the silane molecule.
FT-IR spectra of talc surface modified by γ-Metacryloxypropyltrimethoxysilane (γMPTMS). The absorption peak in the region 2900 cm-1 is typical for a saturated C-H bond.
The absorption waveband has a sharp peak at 1720 cm-1 which is typical for the valence
vibration of the C=O bond in the silane molecule. In addition, we also see the weak
absorption peak at about 1650 cm-1, which is typical for the valence vibration of the C=C
bond.
12
FT-IR spectrum of talc surface
modification by vinyl silane has the peaks
characteristic of the C-H bond approximately
unsaturated at 3040 cm-1. The valence
oscillation of the C=C bond at 1627 cm-1.
Figure 3.52. FT-IR spectra of surface
modified talc with VTMS
b) Oil absorption of surface modified talcs
In there:
1- Talc
2-Surface modified talc with
aminosilane
3-Surface modified talc with
methacryl silane
4- Surface modified talc with vinyl
silane
Figure 3.53. Oil absorption of surface modified talcs
by different silanes
We found that there was an increase in oil absorption of the surface-modified talcs
compared to the original sample. Surface-modified talc with aminosilane also had a
significantly higher oil absorption than talc.
3.2. Study on reinforcement ability of talc for rubber
3.2.1. Study on reinforcement ability of talc for natural rubber
3.2.1.1. Effect of talc unmodified on the mechanical properties of natural rubber
Table 3.6: Effect of talc unmodified on the pmechanical properties of NR
Talc content Tensile strength Elongation
Samples
(phr)
(MPa)
at break (%)
T0
0
16
700
T10
10
17
669
T20
20
21
650
T30
30
22
615
T50
50
20
560
Talc can be used as a filler to increase the tensile strength of natural rubber. When
the talc content was 30 phr, the sample had a maximum tensile strength (22 MPa), an
increase of nearly 40% compared to the original rubber sample. At that time, the elongation
13
at break decreased but still had a relatively high value (615%). On that basis, we selected 30
phr talc for further investigation
3.2.1.2. Effect of surface modification of talc on mechanical properties of NR
We have studied talc surface modification by 3 different silane compounds. These
silane compounds all have different chemical or physical interactions with the natural
rubber base. In this section, we study the effects of surface-modifying compounds on the
properties of materials in order to determine suitable denaturing compounds for NR.
Table 3.7: Effect of surface modified talc on the mechanical properties of NR
Samples
Talc content
Tensile strength
Elongation at
(phr)
(MPa)
break (%)
T0
0
16
700
T30
30
22
699
T2A30
30
23
661
T2Mc30
30
21
558
T2S30
30
21
688
In which: T0: The NR sample does not contain fillers; T3: The NR sample contains
30 phr of the talc; T2A30: NR sample containing 30 phr talc modified with aminosilane;
T2Mc30: NR sample containing 30 phr talc modified with mecaptosilan; T2S30: The NR
sample contains 30 phr talc modified with Si69.
Surface-modified talc have the effect of increasing the tensile strength for NR, in
which talc modified by aminosilane reinforced material has the greatest tensile strength,
reaching the value 23 MPa.
3.2.3. Effect of content of talc modified with aminosilan on the properties of NR
Table 3.8: Properties of NR containing talc modified with aminosilane
Content of
Tensile
Elongation at Residual
Hardness
Samples
talc T2A
strength
break (%)
elongation
(ShoreA)
(phr)
(MPa)
(%)
0
16
700
T0
8
55
10
20
626
T2A10
13
60
20
22
578
T2A20
20
62
30
23
561
T2A30
24
65
50
22
443
T2A50
28
68
When increasing the talc content in the range of 0-30 phr, the tensile strength of the
material increases and reaches its highest value at 23 MPa. As the talc content continued to
increase to 50 phr, the tensile strength of the material began to decline. Here, it can be seen
that, with the content of 30 phr talc surface modified by aminosilane, it has created the most
uniformity in structure as well as the more stable association between the molecular chains
of NR.
14
3.2.2. Study on the ability to increase the abrasion resistance of talc for rubber blend P70K
3.2.2.1. Study on the effect of carbon black content on the properties of rubber blend P70K\
Table 3.9: Properties of P70K rubber material containing carbon black content
Carbon black
content (phr)
Samples
CB20
CB35
CB50
CB65
CB80
20
35
50
65
80
Tensile
strength
(MPa)
23,197
24,972
25
20,985
19,495
abrasion
resistance
(cm3/1,61km)
0,089
0.069
0,061
0,157
----
Elongation at
break (%)
Hardness
(Shore A)
572,76
515,043
438,499
318,683
221,708
73
79
85
92
94
Carbon black has the effect of increasing the mechanical strength of the P70K
material. However, the optimal content of carbon black is 50 phr, at this content the tensile
strength reaches the maximum value of 25 MPa. At 50 phr, the material sample gives the
best tensile strength. When increasing the carbon black content from 20 phr to 50 phr, the
abrasiveness of materials gradually decreased, the two samples CB35 and CB50 had the
lowest abrasion.
3.2.2.1. Effect of talc on the properties of rubber blend P70K
Table 3.10: Influence of talc on the tensile strength of materials
Samples
Carbon black
content (phr)
Talc content
(phr)
Tensile strength
(MPa)
Elongation at
break (%)
CB50
CB50.1B
CB50.3B
CB50.5B
CB50.10B
CB50.15B
50
49
47
45
40
35
0
1
3
5
10
15
25
23,54
23,81
25,16
22,03
21,53
363
402,53
430,42
432,08
457,69
477,86
When replacing the 1, 3, 5, 10 and 15 phr carbon black by talc B surface modification
by aminosilan, tensile strength of the samples have dropped more than CB50 but then
maximum in sample CB505B, when continue to replace carbon black with talc, the tensile
strength of the sample decreases.
3.2.2.3. Effect of talc particle size on the properties of rubber P70K
Rubber sample does not contain talc (CB50) abrasive at a very low value. Only
sample CB50.5A (abrasion 0.041cm3/1.61km) which is a rubber sample containing talc
with average size of smallest particles has lower abrasion than sample CB50 (abrasive filler
0.061cm3 /1.61km).
15
Table 3.11: Effect of talc particle size on material properties
Samples
CB50.5T
CB50.5B
CB50.5C
CB50.5A
Medium
size talc
(µm)
6,4740
6,4740
17,4378
4,9961
Talc
content
(phr)
5
5
5
5
Tensile
strength
(MPa)
23,5
25,16
21,12
25,2
Elongation
abrasion
at break
resistance
(%)
(cm3/1,61km)
436,62
-432,08
0,09
420,07
0,105
388,9
0,041
Hardness
(ShoreA)
-86
86
86
3.3. Study on the effect of talc on the protective ability of the coating
3.3.1. Study on the effect of talc on the protective ability of epoxy coating
3.3.2.1. Determination of content ratio curing agent/epoxy by FT-IR
Here, it is found that, Samples M-I and M-II have not fully cured epoxy resin, the
conversion is only 77 and 86% respectively. Samples M-III, M-IV and M-V had 100%
epoxy group conversion. From the sample M-III, the epoxy curing reaction has occurred
completely. The curing agent ratio is 20/100 compared to the epoxy content of the M-III
sample selected to fabricate the coating sample in the subsequent research contents of the
thesis.
Table 3.12: Composition of epoxy coating film samples
Content (g)
Composition
M-0
M-I
M-II
M-III
M-IV
M-V
Epoxy YD-011X75
100
100
100
100
100
100
KINGMIDE 315-L
0
10
15
20
25
30
Table 3.13: Conversion of epoxy group of epoxy coating film samples
Samples
M-I
M-II
M-III
M-IV
M-V
Content
hardener (g)/100g epoxy
10
15
20
25
30
Conversion (%)
77
86
100
100
100
3.3.1.2. Study the influence of surface modification
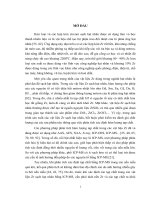
a) Investigation by electrochemical method
To investigate the effect of surface modification agent on the electrochemical
properties of epoxy coating film, the study used 2 types of talc modified by -APTMS and
-MPTMS combined with talc unmodified. -APTMS and -MPTMS are two typical silane
coupling agents with reasonable price and high enough oil permeability. Epoxy coating
films are designated as epoxy-T2A, epoxy-T2Mt and epoxy-talc, consisting of talc surface
16
modified by -APTMS and -MPTMS and unmodified, respectively, with the same content
30%.
10
11
10
10
10
2
9
10
8
10
7
10
6
10
5
Epoxy-T2A
epoxy 2A
epoxy 2MT
Epoxy-T2Mt
epoxy talc
Epoxy-talc
Rf (Ω.cm )
0
10
20
30
40
Time immersion in 3% NaCl solution (days)
Figure 3.68. Film resistance of epoxy coated films with talc modified and unmodified
immersed in 3% NaCl solution
b) Investigation by IR
Table 3.14: Conversion of epoxy group of coatings different talc
Samples
Conversion, %
Epoxy-talc
0
Epoxy-T2A
4.8
Epoxy-T2Mt
2.1
The results showed that talc had no effect on epoxy curing reaction. Talc surface
modified with silane compounds has an effect on epoxy curing. In which aminosilane has
reduced the epoxy group content to 4,8%. It can be confirmed that the amine groups of the
silane on the talc surface reacted with the epoxy group. Metacryl silane on talc surface has
reduced epoxy content but not much.
3.3.1.3. Study on the influence of talc content on coating properties
a) Study on the effect of talc on the electrochemical properties of epoxy coatings
Table 3.15: Talc content in coating samples
Samples
% Talc
M0
0
M1
10
M2
20
M3
30
17
To study and fabricate coating films containing talc, we fabricated 4 samples
containing different concentrations of talc T2A talc. White sample is denoted M0, samples
containing 10, 20, and 30% talc T2A are denoted by M1, M2, M3 respectively.
Virtual part (Ω.cm2)
We see that after 1 hour of immersion in 3% NaCl solution, the total impedance
spectrum of samples M0, M1 and M3 is characterized by 2 arcs while the total impedance
spectrum of sample M2 has only 1 arc. The first arc at high frequency characterizes the
properties of the coating film, the second arc at low frequency is specific for the corrosion
processes on the steel surface. This shows that, with sample M2, the electrolyte has not
penetrated to the metal surface, while with the remaining 3 samples, the electrolyte has
penetrated through the coating film to the metal surface.
Real part (Ω.cm2)
Virtual part (Ω.cm2)
Figure 3.72. Total Impedance spectrum of coatings after 1 hour immersion in 3%
NaCl solution
Real part (Ω.cm2)
Figure 3.73. Total impedance spectrum of the coating film after 2 days of immersion
in 3% NaCl solution
18
Virtual part (Ω.cm2)
Real part (Ω.cm2)
Figure 3.74. Total impedance spectrum of the coating film after 7 days of immersion
in 3% NaCl solution
When the immersion time in 3% NaCl solution increased to 2 days, the total
impedance values of the samples decreased. The impedance value of sample M2 is higher
than the other 3 samples.
After 7 days of immersion in 3% NaCl solution, the total impedance spectra of the
samples M0, M1 and M3 are the same and have 2 arcs. The impedance spectrum of sample
M2 still has only 1 arc at high frequencies. Thus, sample M2 has higher shielding and
protection ability than other samples.
b) Study on the effect of talc on the mechanical properties of epoxy coatings
Table 3.16: Mechanical properties of epoxy coating film
Samples
M0
M1
M2
M3
impact
Bend of
Hardness of
Adhesion resistance coating
coating
(N/mm2)
(kg.cm)
(mm)
2,6
200
1
0,26
2,7
200
1
0,27
3,0
>200
1
0,29
3,2
190
1
0,32
The mechanical properties of the coating film are shown in Table 3.16. The results
showed that the adhesion and hardness of epoxy coatings increased as the talc content
increased. Thus, the presence of modified talc has the effect of increasing the adhesion of
epoxy coating film. The increase in adhesion can be explained by the action of silane
binding agent in modified talc. The bend of coating remained unchanged as the talc content
increased. Meanwhile, the impact resistance of coating reached the highest value at the talc
content of 20%.
3.3.2. Study on the effect of talc in intumescent coating
3.3.2.1. Effect of talc content on coating expansion
19
After heating at 800oC, the samples all expanded. Sample D1 forms a porous, fragile
coal layer. The coal layer formed of sample D2, D3, D4, D5, D4-T2A is porous, hard and
retains its shape. The TQ sample, after heating at 800°C, was crumbly. The results show
that the intumescent coating of the thesis has good s expansion and heat resistance; In the
presence of talc, the ability to expand to create a layer of coal is significantly improved in
terms of porosity, hardness and expansion.
Figure 3.79. The degree of expansion of samples with varying talc content
3.3.2.2. The influence of talc on the morphological structure of the expanded coal layer
Figure 3.80. SEM image of sample D1
Figure 3.81. SEM image of sample D4
Figure 3.82. SEM image of sample D4-T2A
Observation of the morphological structure of the coal layer after calcination shows
that, the coating does not contain mineral fillers almost without the appearance of pores of
the closed porous structure, while the coating samples contain talc has a porous structure
with a lot of holes formed (Figures 3.80 and 3.81).
20
3.3.2.3. Thermal properties of intumescent coating using talc
The thermal decomposition of APP, PER and MEL raw materials used in this study
is shown in Figure 3.59. The results show that APP starts to decompose above 250°C,
releasing NH3 and H2O. PER begins to melt and decompose in the temperature range of 170
– 320°C. Since the decomposition temperatures of APP and PER are in the same
temperature range, they can react with each other to form a char. MEL starts to decompose
at 250°C releasing NH3 gas, so the carbon layer formed by APP and PER can be blown to
create an expanded coal layer.
Figure 3.85. Thermal analysis diagram of APP, PER, MEL
Talc has a residual mass after heating at 1000°C that is over 95%. This shows that
talc has a very high melting point, in addition, the use of talc as a filler also helps the
coating to have good oxidation resistance and enhances the flame retardant ability of the
coating.
Figures 3.60, 3.61 and 3.62 show the thermal analysis diagrams for the coatings
studied in this thesis. The TG diagram of the samples D1, D4 and D4-T2A, has the strongest
decomposition temperature in the range of 328°C-340°C by the decomposition and
formation of the intumescent coating of the flame retardant components APP, PER and
MEL. The effect of this process is endothermic.
Figure 3.86. Thermal analysis diagram TGA
sample D1
Figure 3.87. Thermal analysis diagram TGA
sample D4
Figure 3.88. Thermal analysis diagram TGA
sample D4-T2A
21
Table 3.18: Comparison of the strongest decomposition temperature
And residual mass % of samples D1, D4 and D4-T2A after heating to 850oC
strongest decomposition
Samples
Residual mass (%)
temperature (oC )
D1
328,6
30,67
D4
337,1
44,31
D4-T2A
339,3
44,5
The strongest decomposition temperature of the sample with D4 containing 15% talc
was much higher than that of the sample D1 without talc, which proves that talc has the
effect of increasing the thermal stability of the intumescent coating.
The strongest decomposition temperature of the sample D4-T2A using surface
modified talc was higher than that of the sample containing unmodified talc D4,
demonstrating the efficiency as well as the influence of the surface modification process on
the ability to thermal stability of the material.
3.3.2.4. Study of fire resistance according to UL 94 standard:
Table 3.19: Results of measuring fire resistance according to UL 94 standard of 5 samples
D1, D2, D3, D4 and D5
Burning time
Fire speed
Samples
Phenomena
Results
(s)
(mm/min)
Burns to the clamp, no drops
D1
250s
18
Pass
come down
Burns to the clamp, no drops
D2
330s
13,6
Pass
come down
Burns to the clamp, no drops
D3
330s
13,6
Pass
come down
120s (burning time
Self-extinguishing before the
after removing the
D4
2,5 cm line is 0,5 cm. No drops
Pass
igniter
to
fell.
extinguish)
186s (burning time
Self-extinguishing after the 2,5
after removing the
D5
cm line is 0,5 cm. No drops
Pass
igniter
to
fell.
extinguish)
From Table 3.15, we see that 5 samples D1, D2, D3, D4 and D5 all achieve fire
resistance according to UL 94 standard at HB level. In which, samples D4 and D5 are
capable of self-extinguishing, sample D4 self-extinguishing before the 2,5cm line is 0,5cm.
Sample D5 self-extinguishes after the 2,5cm line is 0,5cm. Samples D1, D2, and D3 burned
to the clamp, then the burning rate was still many times lower than the standard burning rate
(6mm/min), the burning rate decreased as the talc content increased. It proves that, when
22
increasing the talc content, the fire resistance of the intumescent coating increases, and is
best achieved with sample D4.
Table 3.20: Result of measuring the fire resistance according to UL 94 standard of samples
t1
t1+t2
Drops
Burn to
N.o Samples
Classify
(s)
(s)
falling the clamp
1 D4
14,3 145,3
No
Yes
HB
2 D4 - T2A
9,4
15,1
No
No
V-0
UL 94 material test results show that coating D4-T2A contain surface-modified talc
has significantly improved flammability compared to coating contain surface unmodified
talc.
- Investigation of fire retardant by LOI . method
Table 3.21: Result of measuring fire resistance according to LOI
N.o
Samples
LOI( %)
Classify
1 D4
28,1
Self-extinguishing fire
2 D4 - T2A
28,9
Self-extinguishing fire
CONCLUSION
From the research results drawn the following conclusions:
1. Talc has a lamellar structure, high aspect ratio, and does not decompose at temperatures
below 8000C. Talc can be used as fillers for polymeric materials working at high
temperatures, especially for heat-resistant paints. Modification of the talc surface by γMPTMS showed that the optimal reaction conditions occurred in a 2% solution of γMPTMS/water ethanol adjusted to pH=5, at 40°C, for a time of 4 hours. Polymerization
was carried out by drying at 60°C for 8 h. The content of γ-MPTMS adsorbed on the talc
surface reached a value of 1.132 %
2. Unmodified talc can also be used as a filler for NR, significantly increasing mechanical
properties, especially tensile strength. Optimal talc content as a filler for NR is 30%.
However, the surface modified talc mineral with aminosilane has the effect of promoting
the vulcanization process, making the vulcanization process more thoroughy, and
increasing the tensile strength of the NR material. When replacing 5 phr of carbon black
with 5 phr of talc, the rubber blend P70K sample had the highest tensile strength (25,2
MPa), the lowest abrasion (0,041 cm3/1,61 km), the material was suitable for making
bearings for motor shafts.
3. The 20% talc content gives the epoxy coating the highest corrosion protection. The
presence of talc did not affect the curing of the epoxy film. Surface-modified talc with γAPTMS reacts with epoxy, increasing the properties of the coating, especially the ability
to protect through the film resistance value. Talc has the effect of increasing the adhesion
of the epoxy film, with little effect on the impact strength of the coating film. Talc have
the ability to increase the swelling of the intumescent coating and the stability of the
charred layer. The carbonized layer also has better heat resistance and insulation.
23