Introduction to spectroscopy cengage learning
Bạn đang xem bản rút gọn của tài liệu. Xem và tải ngay bản đầy đủ của tài liệu tại đây (28.4 MB, 786 trang )
F I F T H
E D I T I O N
INTRODUCTION
TO SPECTROSCOPY
Donald L. Pavia
Gary M. Lampman
George S. Kriz
James R. Vyvyan
Department of Chemistry
Western Washington University
Bellingham, Washington
Australia • Brazil • Mexico • Singapore • United Kingdom • United States
Copyright 2013 Cengage Learning. All Rights Reserved. May not be copied, scanned, or duplicated, in whole or in part.
Copyright 2013 Cengage Learning. All Rights Reserved. May not be copied, scanned, or duplicated, in whole or in part.
TO ALL OF OUR “O-SPEC” STUDENTS
Copyright 2013 Cengage Learning. All Rights Reserved. May not be copied, scanned, or duplicated, in whole or in part.
This is an electronic version of the print textbook. Due to electronic rights restrictions, some third party content may be suppressed. Editorial
review has deemed that any suppressed content does not materially affect the overall learning experience. The publisher reserves the right to
remove content from this title at any time if subsequent rights restrictions require it. For valuable information on pricing, previous
editions, changes to current editions, and alternate formats, please visit www.cengage.com/highered to search by
ISBN#, author, title, or keyword for materials in your areas of interest.
Copyright 2013 Cengage Learning. All Rights Reserved. May not be copied, scanned, or duplicated, in whole or in part.
Introduction to Spectroscopy,
Fifth Edition
Donald L. Pavia, Gary M. Lampman,
George S. Kriz, and James R. Vyvyan
Product Director: Mary Finch
Product Manager: Maureen Rosener
Content Developer: Alyssa White
Content Coordinator: Karolina Kiwak
Product Development Manager:
Rebecca Berardy-Schwartz
Media Developer: Lisa Weber
Marketing Director: Jason Sakos
Marketing Development Manager:
Julie Shuster
Content Project Manager: Teresa L. Trego
© 2015, 2009 Cengage Learning
WCN: 02-200-203
ALL RIGHTS RESERVED. No part of this work covered by the copyright
herein may be reproduced, transmitted, stored, or used in any form or
by any means graphic, electronic, or mechanical, including but not
limited to photocopying, recording, scanning, digitizing, taping, Web
distribution, information networks, or information storage and retrieval
systems, except as permitted under Section 107 or 108 of the 1976
United States Copyright Act, without the prior written permission of
the publisher.
For product information and technology assistance, contact us at
Cengage Learning Customer & Sales Support, 1-800-354-9706
For permission to use material from this text or product,
submit all requests online at www.cengage.com/permissions
Further permissions questions can be e-mailed to
Art Director: Maria Epes
Manufacturing Planner: Judy Inouye
Library of Congress Control Number: 2013950396
Rights Acquisitions Specialist:
Thomas McDonough
ISBN-13: 978-1-285-46012-3
Production Service: MPS Limited
ISBN-10: 1-285-46012-X
Photo Researcher: PreMedia Global
Text Researcher: PreMedia Global
Copy Editor: MPS Limited
Illustrator: MPS Limited
Cengage Learning
200 First Stamford Place, 4th Floor
Stamford, CT 06902
USA
Cover Designer: Bartay Studio
Cover Image: Expansion of the C-4 methine
proton of ethyl 2-methyl-4-pentenoate
acquired at 500 MHz. Data acquired and
processed by James Vyvyan.
Cengage Learning is a leading provider of customized learning solutions
with office locations around the globe, including Singapore, the United
Kingdom, Australia, Mexico, Brazil, and Japan. Locate your local office at
www.cengage.com/global.
Compositor: MPS Limited
Cengage Learning products are represented in Canada by Nelson
Education, Ltd.
To learn more about Cengage Learning Solutions, visit
www.cengage.com.
Purchase any of our products at your local college store or at our
preferred online store www.cengagebrain.com.
Printed in the United States of America
1 2 3 4 5 6 7 17 16 15 14 13
Copyright 2013 Cengage Learning. All Rights Reserved. May not be copied, scanned, or duplicated, in whole or in part.
PREFACE
T
his is the fifth edition of a textbook in spectroscopy intended for students of organic chemistry. Our textbook can serve as a supplement for the typical organic chemistry lecture textbook or as a stand-alone textbook for an advanced undergraduate or first-year graduate
course in spectroscopic methods. This book is also a useful tool for students engaged in research.
Our aim is not only to teach students to interpret spectra, but also to present basic theoretical
concepts. As with the previous editions, we have tried to focus on the important aspects of each
spectroscopic technique without dwelling excessively on theory or complex mathematical analyses.
This book is a continuing evolution of materials that we use in our own courses, both as a supplement to our organic chemistry lecture course series and also as the principal textbook in our upper division and graduate courses in spectroscopic methods and advanced NMR techniques. Explanations and
examples that we have found to be effective in our courses have been incorporated into this edition.
NEW TO THIS EDITION
This fifth edition of Introduction to Spectroscopy contains some important changes. The material on
mass spectrometry has been moved closer to the front of the text and divided into two more easily
digested chapters. Material on some newer sampling and ionization methods is included, as are
additional methods of structural analysis using fragmentation patterns. All of the chapters dealing
with nuclear magnetic resonance have been gathered together into sequential chapters. Expanded
discussions of diastereotopic systems and heteronuclear coupling are included, as is a revised discussion of solvent effects in NMR.
Additional practice problems have been added to each of the chapters. We have included some
additional solved problems, too, so that students can better develop strategies and skills for solving
spectroscopy problems. The problems that are marked with an asterisk (*) have solutions included
in the Answers to Selected Problems following Chapter 11.
We wish to alert persons who adopt this book that answers to all of the problems are available
online from the publisher. Authorization to gain access to the website may be obtained through the
local Cengage textbook representative.
v
Copyright 2013 Cengage Learning. All Rights Reserved. May not be copied, scanned, or duplicated, in whole or in part.
vi
Preface
ADVICE FOR STUDENTS
Success in working out the solutions to spectroscopy problems comes more easily and is more enjoyable by following some simple suggestions:
1. Carefully study the solved examples that may be found at the end of each chapter. Do not
attempt to work on additional problems until you are comfortable with the approach that is
being demonstrated with the solved examples.
2. There is great value to be gained in working collaboratively to solve spectroscopy problems.
Try standing around a blackboard to exchange ideas. You will find it to be fun, and you will
learn more!
3. Don’t be afraid to struggle. It is too easy to look up the answer to a difficult problem, and
you won’t learn much. You need to train your brain to think like a scientist, and there is no
substitute for hard work.
4. Work problems concurrently as you study each chapter. That will solidify the concepts in
your mind.
Although this book concentrates on organic chemistry examples, be aware that the study of spectroscopy crosses over into many areas, including biochemistry, inorganic chemistry, physical
chemistry, materials chemistry, and analytical chemistry. Spectroscopy is an indispensible tool to
support all forms of laboratory research.
ACKNOWLEDGMENTS
The authors are very grateful to Mr. Charles Wandler, without whose expert help this project could
not have been accomplished. We also acknowledge numerous contributions made by our students,
who use the textbook and who provide us careful and thoughtful feedback.
Finally, once again we must thank our wives, Neva-Jean Pavia, Marian Lampman, and Cathy
Vyvyan, for their support and patience. They endure a great deal in order to support us as we write,
and they deserve to be part of the celebration when the textbook is completed! We honor the
memory of Carolyn Kriz; we miss her and the love and encouragement that she provided.
Donald L. Pavia
Gary M. Lampman
George S. Kriz
James R. Vyvyan
Copyright 2013 Cengage Learning. All Rights Reserved. May not be copied, scanned, or duplicated, in whole or in part.
Preface
vii
INTRO TO SPECTROSCOPY FIFTH EDITION SUMMARY OF CHANGES
The order of the chapters was rearranged to better reflect the requests and practices of our users.
Mass Spectroscopy was moved to an earlier position, causing the renumbering.
Fourth edition chapter
number/title
Fifth edition chapter
number/title
Notes
1
Molecular Formulas and
What Can Be Learned from
Them
1
Molecular Formulas
and What Can Be
Learned from Them
Section 1.6, A Quick Look Ahead to Simple Uses of
Mass Spectra, was deleted.
(Mass Spectra were moved earlier into Chapters 3
and 4.)
A new Section 1.6 is now titled: “The Nitrogen
Rule.” References were revised/updated.
2
Infrared Spectroscopy
2
Infrared Spectroscopy
Section 2.6, the solid samples subsection was
updated to include ATR techniques.
Several figures were revised/updated.
Section 2.21, Alkyl and Aryl Halides, was revised.
Section 2.23, How to Solve Infrared Spectral
Problems, is a new section. The sections that
followed were renumbered.
Problems were revised. References were revised/
updated.
3
Nuclear Magnetic
Resonance Spectroscopy
Part One: Basic Concepts.
5
New Section 5.20
Nuclear Magnetic Res- References were revised/updated. New online
onance Spectroscopy
resources were referenced and/or updated.
Part One: Basic
Concepts.
4
Nuclear Magnetic
Resonance Spectroscopy
Part Two: Carbon-13 etc.
6
Nuclear Magnetic Resonance Spectroscopy
Part Two: Carbon-13
etc.
Section 6.4 introduces a new decoupling notation.
New Section 6.12.
Sections following 6.12 are renumbered.
Several new problems were added. Some spectra
replaced/improved.
References were revised/updated. New online
resources referenced and/or updated.
5
Nuclear Magnetic
Resonance Spectroscopy
Part Three: Spin-Spin Coupling
7
Nuclear Magnetic Resonance Spectroscopy
Part Three: Spin-Spin
Coupling
New discussion of splitting in diastereotopic
systems.
New discussion of heteronuclear splitting between
1
H–19F and S–31P
Addition of solved example problems.
New and revised end-of-chapter problems using coupling constant information and chemical shift calculations.
References were revised/updated.
6
Nuclear Magnetic
Resonance Spectroscopy
Part Four: Other Topics in
One-Dimensional NMR
8
Nuclear Magnetic Resonance Spectroscopy
Part Four: Other Topics
in One-Dimensional
NMR
New discussion and examples of solvent effects.
Addition of solved example problems.
New and revised end-of-chapter problems.
References were revised/updated.
(Continued )
Copyright 2013 Cengage Learning. All Rights Reserved. May not be copied, scanned, or duplicated, in whole or in part.
viii
Preface
Fourth edition chapter
number/title
Fifth edition chapter
number/title
Notes
7
Ultraviolet Spectroscopy
10
Ultraviolet Spectroscopy
Few changes.
8
Mass Spectrometry
(first half)
Chapter was split.
3
Mass Spectrometry
Part One: Basic Theory,
Instrumentation, and
Sampling Techniques
To highlight the continued development and
importance of mass spectrometry (MS) methods,
we have moved this material to the early part of the
text and split it into two chapters, one on theory
and instrumentation (Chapter 3) and the other on
detailed structural analysis using characteristic
fragmentation patterns of common functional
groups (Chapter 4).
Expanded and refined discussion of sampling and
ionization methods, including atmospheric
pressure chemical ionization techniques.
Examples of applications for different MS
techniques and instrumentation, including pros and
cons of different methods.
8
Mass Spectrometry
(second half)
4
Mass Spectrometry
Part Two: Fragmentation
and Structural Analysis
Refined discussion of fragmentations in EI-MS for
common functional groups.
New examples of use of MS in structure
determination.
Additional solved example problems.
New and revised end-of-chapter problems.
9
11
Several new problems were introduced.
Combined Structure
Problems
Combined Structure Prob- Two-dimensional spectra were replaced with new,
lems
improved ones.
References were revised/updated. Online resources
were updated.
10
Nuclear Magnetic
Resonance Spectroscopy
Part Five: Advanced NMR
Techniques.
9
Nuclear Magnetic Resonance Spectroscopy Part
Five: Advanced NMR
Techniques
Sections 9.4 and 9.7 were extensively revised.
Appendices
Appendices
Old Appendix 11 was removed.
Many of the two-dimensional spectra were
replaced with new, improved ones.
Values in some of the tables were updated or
revised.
Copyright 2013 Cengage Learning. All Rights Reserved. May not be copied, scanned, or duplicated, in whole or in part.
CONTENTS
CHAPTER 1
MOLECULAR FORMULAS AND WHAT CAN BE LEARNED
FROM THEM
1
1.1
1.2
1.3
1.4
1.5
1.6
Elemental Analysis and Calculations
1
Determination of Molecular Mass
5
Molecular Formulas
5
Index of Hydrogen Deficiency
6
The Rule of Thirteen
9
The Nitrogen Rule
12
Problems
12
References
13
CHAPTER
2
INFRARED SPECTROSCOPY
2.1
2.2
2.3
2.4
2.5
2.6
2.7
2.8
2.9
14
The Infrared Absorption Process
15
Uses of the Infrared Spectrum
16
The Modes of Stretching and Bending
17
Bond Properties and Absorption Trends
19
The Infrared Spectrometer
22
A. Dispersive Infrared Spectrometers
22
B. Fourier Transform Spectrometers
24
Preparation of Samples for Infrared Spectroscopy
25
What to Look for When Examining Infrared Spectra
26
Correlation Charts and Tables
28
How to Approach the Analysis of a Spectrum (Or What You Can Tell at a Glance)
30
ix
Copyright 2013 Cengage Learning. All Rights Reserved. May not be copied, scanned, or duplicated, in whole or in part.
x
Contents
2.10
2.11
2.12
2.13
2.14
2.15
2.16
2.17
2.18
2.19
2.20
2.21
2.22
2.23
Hydrocarbons: Alkanes, Alkenes, and Alkynes
31
A. Alkanes
31
B. Alkenes
33
C. Alkynes
35
Aromatic Rings
43
Alcohols and Phenols
47
Ethers
50
Carbonyl Compounds
52
A. Factors That Influence the CJO Stretching Vibration
B. Aldehydes
56
C. Ketones
58
D. Carboxylic Acids
62
E. Esters
64
F . Amides
70
G. Acid Chlorides
72
H. Anhydrides
73
Amines
74
Nitriles, Isocyanates, Isothiocyanates, and Imines
77
Nitro Compounds
79
Carboxylate Salts, Amine Salts, and Amino Acids
80
Sulfur Compounds
81
Phosphorus Compounds
84
Alkyl and Aryl Halides
84
The Background Spectrum
86
How to Solve Infrared Spectral Problems
87
Problems
92
References
106
54
CHAPTER 3
MASS SPECTROMETRY
PART ONE: BASIC THEORY, INSTRUMENTATION, AND
SAMPLING TECHNIQUES
107
3.1
3.2
3.3
The Mass Spectrometer: Overview
107
Sample Introduction
108
Ionization Methods
109
A. Electron Ionization (EI)
109
B. Chemical Ionization (CI)
110
C. Desorption Ionization Techniques (SIMS, FAB, and MALDI)
D. Electrospray Ionization (ESI)
117
115
Copyright 2013 Cengage Learning. All Rights Reserved. May not be copied, scanned, or duplicated, in whole or in part.
Contents
3.4
3.5
3.6
3.7
Mass Analysis
119
A. The Magnetic Sector Mass Analyzer
119
B. Double-Focusing Mass Analyzers
120
C. Quadrupole Mass Analyzers
120
D. Time-of-Flight Mass Analyzers
124
Detection and Quantitation: The Mass Spectrum
Determination of Molecular Weight
129
Determination of Molecular Formulas
131
A. Precise Mass Determination
131
B. Isotope Ratio Data
132
Problems
137
References
137
125
CHAPTER 4
MASS SPECTROMETRY
PART TWO: FRAGMENTATION AND STRUCTURAL ANALYSIS
4.1
4.2
4.3
4.4
4.5
4.6
4.7
139
The Initial Ionization Event
139
Fundamental Fragmentation Processes
140
A. Stevenson’s Rule
141
B. Radical-Site Initiated Cleavage: α-Cleavage
141
C. Charge-Site Initiated Cleavage: Inductive Cleavage
141
D. Two-Bond Cleavage
142
E. Retro Diels-Alder Cleavage
143
F. McLafferty Rearrangements
143
G. Other Cleavage Types
144
Fragmentation Patterns of Hydrocarbons
144
A. Alkanes
144
B. Cycloalkanes
147
C. Alkenes
148
D. Alkynes
150
E. Aromatic Hydrocarbons
151
Fragmentation Patterns of Alcohols, Phenols, and Thiols
156
Fragmentation Patterns of Ethers and Sulfides
163
Fragmentation Patterns of Carbonyl-Containing Compounds
166
A. Aldehydes
166
B. Ketones
169
C. Esters
172
D. Carboxylic Acids
175
Fragmentation Patterns of Amines
178
Copyright 2013 Cengage Learning. All Rights Reserved. May not be copied, scanned, or duplicated, in whole or in part.
xi
xii
Contents
4.8
4.9
4.10
4.11
4.12
Fragmentation Patterns of Other Nitrogen Compounds
182
Fragmentation Patterns of Alkyl Chlorides and Alkyl Bromides
184
Computerized Matching of Spectra with Spectral Libraries
189
Strategic Approach to Analyzing Mass Spectra and Solving Problems
191
How to Solve Mass Spectral Problems
192
References
214
CHAPTER 5
NUCLEAR MAGNETIC RESONANCE SPECTROSCOPY
PART ONE: BASIC CONCEPTS
5.1
5.2
5.3
5.4
5.5
5.6
5.7
5.8
5.9
5.10
5.11
5.12
5.13
5.14
5.15
5.16
5.17
5.18
5.19
215
Nuclear Spin States
215
Nuclear Magnetic Moments
216
Absorption of Energy
217
The Mechanism of Absorption (Resonance)
219
Population Densities of Nuclear Spin States
221
The Chemical Shift and Shielding
222
The Nuclear Magnetic Resonance Spectrometer
224
A. The Continuous-Wave (CW) Instrument
224
B. The Pulsed Fourier Transform (FT) Instrument
226
Chemical Equivalence—A Brief Overview
230
Integrals and Integration
231
Chemical Environment and Chemical Shift
233
Local Diamagnetic Shielding
234
A. Electronegativity Effects
234
B. Hybridization Effects
236
C. Acidic and Exchangeable Protons; Hydrogen Bonding
Magnetic Anisotropy
238
Spin–Spin Splitting (n +1) Rule
241
The Origin of Spin–Spin Splitting
244
The Ethyl Group (CH3CH2–)
246
237
Pascal’s Triangle
247
The Coupling Constant
248
A Comparison of NMR Spectra at Low- and High-Field Strengths
251
1
252
Survey of Typical H NMR Absorptions by Type of Compound
A. Alkanes
252
B. Alkenes
254
C. Aromatic Compounds
255
D. Alkynes
256
E. Alkyl Halides
258
F . Alcohols
259
Copyright 2013 Cengage Learning. All Rights Reserved. May not be copied, scanned, or duplicated, in whole or in part.
Contents
5.20
G. Ethers
261
H. Amines
262
I. Nitriles
263
J. Aldehydes
264
K. Ketones
265
L. Esters
267
M. Carboxylic Acids
268
N. Amides
269
O. Nitroalkanes
270
How to Solve NMR Spectra Problems
Problems
276
References
288
271
CHAPTER 6
NUCLEAR MAGNETIC RESONANCE SPECTROSCOPY
PART TWO: CARBON-13 SPECTRA, INCLUDING HETERONUCLEAR COUPLING
WITH OTHER NUCLEI
290
6.1
6.2
6.3
6.4
6.5
6.6
6.7
6.8
6.9
6.10
6.11
6.12
6.13
6.14
6.15
6.16
6.17
The Carbon-13 Nucleus
290
Carbon-13 Chemical Shifts
291
A. Correlation Charts
291
B. Calculation of 13C Chemical Shifts
293
13
Proton-Coupled C Spectra—Spin–Spin Splitting of Carbon-13 Signals
294
13
Proton-Decoupled C Spectra
296
Nuclear Overhauser Enhancement (NOE)
297
Cross-Polarization: Origin of the Nuclear Overhauser Effect
299
13
Problems with Integration in C Spectra
302
Molecular Relaxation Processes
303
Off-Resonance Decoupling
305
A Quick Dip into DEPT
305
Some Sample Spectra—Equivalent Carbons
308
Non-Equivalent Carbon Atoms
310
Compounds with Aromatic Rings
311
Carbon-13 NMR Solvents—Heteronuclear Coupling of Carbon to Deuterium
313
Heteronuclear Coupling of Carbon-13 to Fluorine-19
316
Heteronuclear Coupling of Carbon-13 to Phosphorus-31
318
Carbon and Proton NMR: How to Solve a Structure Problem
319
Problems
323
References
347
Copyright 2013 Cengage Learning. All Rights Reserved. May not be copied, scanned, or duplicated, in whole or in part.
xiii
xiv
Contents
CHAPTER 7
NUCLEAR MAGNETIC RESONANCE SPECTROSCOPY
PART THREE: SPIN–SPIN COUPLING
7.1
7.2
7.3
7.4
7.5
7.6
7.7
7.8
7.9
7.10
7.11
7.12
349
Coupling Constants: Symbols
349
Coupling Constants: The Mechanism of Coupling
350
A. One-Bond Couplings (1J)
351
B. Two-Bond Couplings (2J)
352
3
C. Three-Bond Couplings ( J)
355
4 n
D. Long-Range Couplings ( J– J)
360
Magnetic Equivalence
363
Spectra of Diastereotopic Systems
368
A. Diastereotopic Hydrogens: Ethyl 3-Hydroxybutanoate
368
B. Diastereotopic Hydrogens: The Diels-Alder Adduct of
Anthracene-9-methanol and N-Methylmaleimide
372
C. Diastereotopic Hydrogens: 4-Methyl-2-pentanol
374
D. Diastereotopic Methyl Groups: 4-Methyl-2-pentanol
376
Nonequivalence within a Group—The Use of Tree Diagrams
when the n + 1 Rule Fails
377
Measuring Coupling Constants from First-Order Spectra
380
A. Simple Multiplets—One Value of J (One Coupling)
380
B. Is the n + 1 Rule Ever Really Obeyed?
382
C. More Complex Multiplets—More Than One Value of J
384
Second-Order Spectra—Strong Coupling
388
A. First-Order and Second-Order Spectra
388
B. Spin System Notation
389
C. The A2, AB, and AX Spin Systems
390
D. The AB2 . . . AX2 and A2B2 . . . A2X2 Spin Systems
390
E. Simulation of Spectra
392
F. The Absence of Second-Order Effects at Higher Field
392
G. Deceptively Simple Spectra
393
Alkenes
397
Measuring Coupling Constants—Analysis of an Allylic System
401
Aromatic Compounds—Substituted Benzene Rings
405
A. Monosubstituted Rings
405
B. para-Disubstituted Rings
408
C. Other Substitution
410
Coupling in Heteroaromatic Systems
414
1
19
31
Heteronuclear Coupling of H to F and P
416
1
19
A. H to F Couplings
416
B. 1H to 31P Couplings
418
Copyright 2013 Cengage Learning. All Rights Reserved. May not be copied, scanned, or duplicated, in whole or in part.
Contents
7.13
How to Solve Problems Involving Coupling Constant Analysis
Problems
424
References
455
420
CHAPTER 8
NUCLEAR MAGNETIC RESONANCE SPECTROSCOPY
PART FOUR: OTHER TOPICS IN ONE-DIMENSIONAL NMR
8.1
8.2
8.3
8.4
8.5
8.6
8.7
8.8
8.9
8.10
8.11
8.12
457
Protons on Oxygen: Alcohols
457
Exchange in Water and D2O
460
A. Acid/Water and Alcohol/Water Mixtures
460
B. Deuterium Exchange
461
C. Peak Broadening Due to Exchange
463
Other Types of Exchange: Tautomerism
464
Protons on Nitrogen: Amines
466
Protons on Nitrogen: Quadrupole Broadening and Decoupling
470
Amides
471
Solvent Effects
475
Chemical Shift Reagents
479
Chiral Resolving Agents
481
Determining Absolute and Relative Configuration via NMR
484
A. Determining Absolute Configuration
484
B. Determining Relative Configuration
486
Nuclear Overhauser Effect Difference Spectra
487
How to Solve Problems Involving Advanced 1-D Methods
489
Problems
490
References
509
CHAPTER 9
NUCLEAR MAGNETIC RESONANCE SPECTROSCOPY
PART FIVE: ADVANCED NMR TECHNIQUES
9.1
9.2
9.3
9.4
9.5
511
Pulse Sequences
511
Pulse Widths, Spins, and Magnetization Vectors
513
Pulsed Field Gradients
517
The DEPT Experiment: Number of Protons Attached to 13C Atoms
Determining the Number of Attached Hydrogens
522
A. Methine Carbons (CH)
522
B. Methylene Carbons (CH2)
523
C. Methyl Carbons (CH3)
525
D. Quaternary Carbons (C)
525
E. The Final Result
526
519
Copyright 2013 Cengage Learning. All Rights Reserved. May not be copied, scanned, or duplicated, in whole or in part.
xv
xvi
Contents
9.6
9.7
9.8
9.9
9.10
9.11
9.12
Introduction to Two-Dimensional Spectroscopic Methods
526
The COSY Technique: 1H-1H Correlations
526
A. An Overview of the COSY Experiment
527
B. How to Read COSY Spectra
528
1
13
The HETCOR Technique: H- C Correlations
534
A. An Overview of the HETCOR Experiment
535
B. How to Read HETCOR Spectra
535
Inverse Detection Methods
539
The NOESY Experiment
539
Magnetic Resonance Imaging
541
Solving a Structural Problem Using Combined 1-D and 2-D Techniques
A. Index of Hydrogen Deficiency and Infrared Spectrum
543
B. Carbon-13 NMR Spectrum
543
C. DEPT Spectrum
544
D. Proton NMR Spectrum
545
E. COSY NMR Spectrum
547
F. HETCOR (HSQC) NMR Spectrum
548
Problems
549
References
576
542
CHAPTER 10
ULTRAVIOLET SPECTROSCOPY
10.1
10.2
10.3
10.4
10.5
10.6
10.7
10.8
10.9
10.10
10.11
10.12
10.13
10.14
577
The Nature of Electronic Excitations
577
The Origin of UV Band Structure
579
Principles of Absorption Spectroscopy
579
Instrumentation
580
Presentation of Spectra
581
Solvents
582
What Is a Chromophore?
583
The Effect of Conjugation
586
The Effect of Conjugation on Alkenes
587
The Woodward–Fieser Rules for Dienes
590
Carbonyl Compounds; Enones
593
Woodward’s Rules for Enones
596
␣, -Unsaturated Aldehydes, Acids, and Esters
598
Aromatic Compounds
598
A. Substituents with Unshared Electrons
600
602
B. Substituents Capable of -Conjugation
C. Electron-Releasing and Electron-Withdrawing Effects
602
D. Disubstituted Benzene Derivatives
602
E. Polynuclear Aromatic Hydrocarbons and Heterocyclic Compounds
605
Copyright 2013 Cengage Learning. All Rights Reserved. May not be copied, scanned, or duplicated, in whole or in part.
Contents
10.15 Model Compound Studies
607
10.16 Visible Spectra: Color in Compounds
608
10.17 What to Look for in an Ultraviolet Spectrum: A Practical Guide
Problems
611
References
613
609
CHAPTER 11
COMBINED STRUCTURE PROBLEMS
Example 1
616
Example 2
618
Example 3
620
Example 4
623
Problems
624
Sources of Additional Problems
689
ANSWERS TO SELECTED PROBLEMS
APPENDICES
Appendix 1
Appendix 2
Appendix 3
Appendix 4
Appendix 5
Appendix 6
Appendix 7
Appendix 8
Appendix 9
Appendix 10
Appendix 11
Appendix 12
Appendix 13
INDEX
614
ANS-1
A-1
Infrared Absorption Frequencies of Functional Groups
A-1
1
Approximate H Chemical Shift Ranges (ppm) for Selected
Types of Protons
A-8
1
Some Representative H Chemical Shift Values for Various
Types of Protons
A-9
1
H Chemical Shifts of Selected Heterocyclic and Polycyclic
Aromatic Compounds
A-12
Typical Proton Coupling Constants
A-13
1
Calculation of Proton ( H) Chemical Shifts
A-18
13
Approximate C Chemical-Shift Values (ppm) for Selected
Types of Carbon
A-22
Calculation of 13C Chemical Shifts
A-23
13
C Coupling Constants to Proton, Deuterium,
Fluorine, and Phosphorus
A-33
1
13
H and C Chemical Shifts for Common NMR Solvents
A-36
Common Fragment Ions under Mass 105
A-37
A Handy-Dandy Guide to Mass Spectral Fragmentation Patterns
Index of Spectra
A-43
A-40
I-1
Copyright 2013 Cengage Learning. All Rights Reserved. May not be copied, scanned, or duplicated, in whole or in part.
xvii
Copyright 2013 Cengage Learning. All Rights Reserved. May not be copied, scanned, or duplicated, in whole or in part.
C H A P T E R
1
MOLECULAR FORMULAS AND WHAT
CAN BE LEARNED FROM THEM
B
efore attempting to deduce the structure of an unknown organic compound from an examination of its spectra, we can simplify the problem somewhat by examining the molecular
formula of the substance. The purpose of this chapter is to describe how the molecular
formula of a compound is determined and how structural information may be obtained from that
formula. The chapter reviews both the modern and classical quantitative methods of determining
the molecular formula. While use of the mass spectrometer (Chapter 3) can supplant many of
these quantitative analytical methods, they are still in use. Many journals still require that a satisfactory quantitative elemental analysis (Section 1.1) be obtained prior to the publication of
research results.
1.1 ELEMENTAL ANALYSIS AND CALCULATIONS
The classical procedure for determining the molecular formula of a substance involves three steps:
1. A qualitative elemental analysis to find out what types of atoms are present: C, H, N, O,
S, Cl, and so on.
2. A quantitative elemental analysis (or microanalysis) to find out the relative numbers (percentages) of each distinct type of atom in the molecule.
3. A molecular mass (or molecular weight) determination.
The first two steps establish an empirical formula for the compound. When the results of the third
procedure are known, a molecular formula is found.
Virtually all organic compounds contain carbon and hydrogen. In most cases, it is not necessary to determine whether these elements are present in a sample: their presence is assumed.
However, if it should be necessary to demonstrate that either carbon or hydrogen is present in a
compound, that substance may be burned in the presence of excess oxygen. If the combustion
produces carbon dioxide, carbon must be present; if combustion produces water, hydrogen atoms
must be present. Today, the carbon dioxide and water can be detected by gas chromatographic
methods. Sulfur atoms are converted to sulfur dioxide; nitrogen atoms are often chemically reduced to nitrogen gas following their combustion to nitrogen oxides. Oxygen can be detected by
the ignition of the compound in an atmosphere of hydrogen gas; the product is water. Currently,
all such analyses are performed by gas chromatography, a method that can also determine the relative amounts of each of these gases. If the amount of the original sample is known, it can be
entered, and the computer can calculate the percentage composition of the sample.
Unless you work in a large company or in one of the larger universities, it is quite rare to find a
research laboratory in which elemental analyses are performed on site. It requires too much time to
set up the apparatus and keep it operating within the limits of suitable accuracy and precision.
Usually, samples are sent to a commercial microanalytical laboratory that is prepared to do this
work routinely and to vouch for the accuracy of the results.
1
Copyright 2013 Cengage Learning. All Rights Reserved. May not be copied, scanned, or duplicated, in whole or in part.
2
Molecular Formulas and What Can Be Learned from Them
Before the advent of modern instrumentation, the combustion of the precisely weighed sample was
carried out in a cylindrical glass tube, contained within a furnace. A stream of oxygen was passed
through the heated tube on its way to two other sequential, unheated tubes that contained chemical
substances that would absorb first water (MgClO4) and then carbon dioxide (NaOH/silica). These
preweighed absorption tubes were detachable and were removed and reweighed to determine the
amounts of water and carbon dioxide formed. The percentages of carbon and hydrogen in the original sample were calculated by simple stoichiometry. Table 1.1 shows a sample calculation.
Notice in this calculation that the amount of oxygen was determined by difference, a common
practice. In a sample containing only C, H, and O, one needs to determine the percentages of only C
and H; oxygen is assumed to be the unaccounted-for portion. You may also apply this practice in situations involving elements other than oxygen; if all but one of the elements is determined, the last
one can be determined by difference. Today, most calculations are carried out automatically by the
computerized instrumentation. Nevertheless, it is often useful for a chemist to understand the fundamental principles of the calculations.
Table 1.2 shows how to determine the empirical formula of a compound from the percentage
compositions determined in an analysis. Remember that the empirical formula expresses the simplest
whole-number ratios of the elements and may need to be multiplied by an integer to obtain the true
molecular formula. To determine the value of the multiplier, a molecular mass is required.
Determination of the molecular mass is discussed in the next section.
For a totally unknown compound (unknown chemical source or history) you will have to use this
type of calculation to obtain the suspected empirical formula. However, if you have prepared the
compound from a known precursor by a well-known reaction, you will have an idea of the structure
of the compound. In this case, you will have calculated the expected percentage composition of your
TA B L E 1 . 1
CALCULATION OF PERCENTAGE COMPOSITION
FROM COMBUSTION DATA
CxHyOz 1 excess O2 –S
9.83 mg
x CO2 1 y/2 H2O
23.26 mg
9.52 mg
23.26 mg CO2
5 0.5285 mmoles CO2
millimoles CO2 5 }}
44.01 mg/mmole
mmoles CO2 5 mmoles C in original sample
(0.5285 mmoles C)(12.01 mg/mmole C) 5 6.35 mg C in original sample
9.52 mg H2O
5 0.528 mmoles H2O
millimoles H2O 5 }}
18.02 mg/mmole
(0.528 mmoles H2O) a
2 mmoles H
b 5 1.056 mmoles H in original sample
1 mmole H2O
(1.056 mmoles H)(1.008 mg/mmole H) 5 1.06 mg H in original sample
6.35 mg C
% C 5 }} 3 100 5 64.6%
9.83 mg sample
1.06 mg H
% H 5 }} 3 100 5 10.8%
9.83 mg sample
% O 5 100 2 (64.6 1 10.8) 5 24.6%
Copyright 2013 Cengage Learning. All Rights Reserved. May not be copied, scanned, or duplicated, in whole or in part.
1.1 Elemental Analysis and Calculations
3
TA B L E 1 . 2
CALCULATION OF EMPIRICAL FORMULA
Using a 100-g sample:
64.6% of C 5 64.6 g
10.8% of H 5 10.8 g
24.6% of O 5
24.6 g
100.0 g
64.6 g
moles C 5 }} 5 5.38 moles C
12.01 g/mole
10.8 g
moles H 5 }} 5 10.7 moles H
1.008 g/mole
24.6 g
moles O 5 }} 5 1.54 moles O
16.0 g/mole
giving the result
C5.38H10.7O1.54
Converting to the simplest ratio:
C5.38
H10.7
O1.54
5 C3.49H6.95O1.00
1.54
1.54
1.54
which approximates
C3.50H7.00O1.00
or
C7H14O2
sample in advance (from its postulated structure) and will use the analysis to verify your hypothesis.
When you perform these calculations, be sure to use the full molecular weights as given in the periodic chart and do not round off until you have completed the calculation. The final result should be
good to two decimal places: four significant figures if the percentage is between 10 and 100; three
figures if it is between 0 and 10. If the analytical results do not agree with the calculation, the sample may be impure, or you may have to calculate a new empirical formula to discover the identity of
the unexpected structure. To be accepted for publication, most journals require the percentages
found to be less than 0.4% off from the calculated value. Most microanalytical laboratories can easily obtain accuracy well below this limit provided the sample is pure.
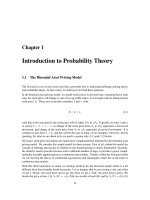
In Figure 1.1, a typical situation for the use of an analysis in research is shown. Professor Amyl
Carbon, or one of his students, prepared a compound believed to be the epoxynitrile with the structure shown at the bottom of the first form. A sample of this liquid compound (25 mL) was placed in
a small vial correctly labeled with the name of the submitter and an identifying code (usually one
that corresponds to an entry in the research notebook). Only a small amount of the sample is required, usually a few milligrams of a solid or a few microliters of a liquid. A Request for Analysis
form must be filled out and submitted along with the sample. The sample form on the left side of
the figure shows the type of information that must be submitted. In this case, the professor calculated the expected results for C, H, and N and the expected formula and molecular weight. Note that
the compound also contains oxygen, but that there was no request for an oxygen analysis. Two
other samples were also submitted at the same time. After a short time, typically within a week, the
Copyright 2013 Cengage Learning. All Rights Reserved. May not be copied, scanned, or duplicated, in whole or in part.
4
Molecular Formulas and What Can Be Learned from Them
l
a
c
i
t
y
l
a
Microanny, Inc.
Compa
REQUEST FOR ANALYSIS FORM
Date: October 30, 2006
Report To: Professor Amyl Carbon
Department of Chemistry
Western Washington University
Bellingham, WA 98225
Sample No: PAC599A P.O. No : PO 2349
Report By: AirMail Phone
(circle one)
Elements to Analyze: C, H, N
Other Elements Present : O
X Single Analysis
Duplicate Analysis
Duplicate only if results are not in range
M.P.
B.P. 69 ˚C @ 2.3 mmHg
Sensitive to :
Weigh under N? Y N
Dry the Sample? Y N Details:
Hygroscopic
Volatile
Explosive
November 25, 2006
Professor Amyl Carbon
Department of Chemistry
Western Washington University
Bellingham, WA
RESULTS OF ANALYSIS
Sample ID
Carbon (%)
Hydrogen (%) Nitrogen (%)
PAC599A
67.39
9.22
11.25
PAC589B
64.98
9.86
8.03
PAC603
73.77
8.20
Dr. B. Grant Poohbah,
Ph.D.
Director of Analytical Services
Microanalytical Company, Inc
PAC603
PAC589B
PAC599A
THEORY OR RANGE
L
Amount Provided
%C 67.17
Stucture: O
%H 8.86
CN
%N 11.19
%O
Comments: C7H11NO
%Other
Mol. Wt. 125.17
ical
t
y
l
a
n
a
Micro ny, Inc.
Compa
F I G U R E 1 . 1 Sample microanalysis forms. Shown on the left is a typical submission form that is sent
with the samples. (The three shown here in labeled vials were all sent at the same time.) Each sample needs
its own form. In the background on the right is the formal letter that reported the results. Were the results
obtained for sample PAC599A satisfactory?
results were reported to Professor Carbon as an email (see the request on the form). At a later date,
a formal letter (shown in the background on the right-hand side) is sent to verify and authenticate
the results. Compare the values in the report to those calculated by Professor Carbon. Are they
within the accepted range? If not, the analysis will have to be repeated with a freshly purified sample, or a new possible structure will have to be considered.
Keep in mind that in an actual laboratory situation, when you are trying to determine the molecular formula of a totally new or previously unknown compound, you will have to allow for some
variance in the quantitative elemental analysis. Other data can help you in this situation since infrared (Chapter Two) and nuclear magnetic resonance (NMR) (Chapters Five to Nine) data will also
suggest a possible structure or at least some of its prominent features. Many times, these other data
will be less sensitive to small amounts of impurities than the microanalysis.
Copyright 2013 Cengage Learning. All Rights Reserved. May not be copied, scanned, or duplicated, in whole or in part.
1.3 Molecular Formulas
5
1.2 DETERMINATION OF MOLECULAR MASS
The next step in determining the molecular formula of a substance is to determine the weight of
one mole of that substance. This may be accomplished in a variety of ways. Without knowledge
of the molecular mass of the unknown, there is no way of determining whether the empirical
formula, which is determined directly from elemental analysis, is the true formula of the substance or whether the empirical formula must be multiplied by some integral factor to obtain the
molecular formula. In the example cited in Section 1.1, without knowledge of the molecular
mass of the unknown, it is impossible to tell whether the molecular formula is C7H14O2 or
C14H28O4.
In a modern laboratory, the molecular mass is determined using mass spectrometry. The details of
this method and the means of determining molecular mass can be found in Chapter 3, Section 3.6.
This section reviews some classical methods of obtaining the same information.
An old method that is used occasionally is the vapor density method. In this method, a known
volume of gas is weighed at a known temperature. After converting the volume of the gas to standard
temperature and pressure, we can determine what fraction of a mole that volume represents. From
that fraction, we can easily calculate the molecular mass of the substance.
Another method of determining the molecular mass of a substance is to measure the freezing-point
depression of a solvent that is brought about when a known quantity of test substance is added. This
is known as a cryoscopic method. Another method, which is used occasionally, is vapor pressure
osmometry, in which the molecular weight of a substance is determined through an examination of
the change in vapor pressure of a solvent when a test substance is dissolved in it.
If the unknown substance is a carboxylic acid, it may be titrated with a standardized solution
of sodium hydroxide. By use of this procedure, a neutralization equivalent can be determined.
The neutralization equivalent is identical to the equivalent weight of the acid. If the acid has only
one carboxyl group, the neutralization equivalent and the molecular mass are identical. If the acid
has more than one carboxyl group, the neutralization equivalent is equal to the molecular mass
of the acid divided by the number of carboxyl groups. Many phenols, especially those substituted
by electron-withdrawing groups, are sufficiently acidic to be titrated by this same method, as are
sulfonic acids.
1.3 MOLECULAR FORMULAS
Once the molecular mass and the empirical formula are known, we may proceed directly to the
molecular formula. Often, the empirical formula weight and the molecular mass are the same. In
such cases, the empirical formula is also the molecular formula. However, in many cases, the empirical formula weight is less than the molecular mass, and it is necessary to determine how many
times the empirical formula weight can be divided into the molecular mass. The factor determined
in this manner is the one by which the empirical formula must be multiplied to obtain the molecular
formula.
Ethane provides a simple example. After quantitative element analysis, the empirical formula
for ethane is found to be CH3. A molecular mass of 30 is determined. The empirical formula weight
of ethane, 15, is half of the molecular mass, 30. Therefore, the molecular formula of ethane must be
2(CH3) or C2H6.
For the sample unknown introduced earlier in this chapter, the empirical formula was found to be
C7H14O2. The formula weight is 130. If we assume that the molecular mass of this substance was
determined to be 130, we may conclude that the empirical formula and the molecular formula are
identical, and that the molecular formula must be C7H14O2.
Copyright 2013 Cengage Learning. All Rights Reserved. May not be copied, scanned, or duplicated, in whole or in part.
![[CEH V3] Introduction to Ethical Hacking](https://media.store123doc.com/images/document/13/ly/ap/medium_3ABUW8WdDH.jpg)