Giáo trình Essentials of business staticstics communicating with number 2nd jaggia
Bạn đang xem bản rút gọn của tài liệu. Xem và tải ngay bản đầy đủ của tài liệu tại đây (46.89 MB, 593 trang )
www.ebookslides.com
www.ebookslides.com
Essentials of
Business Statistics
www.ebookslides.com
The McGraw-Hill Education Series in Operations and Decision Sciences
Supply Chain Management
Business Research Methods
Benton
Purchasing and Supply Chain
Management
Third Edition
Cooper and Schindler
Business Research Methods
Thirteenth Edition
Swink, Melnyk, Hartley, and Cooper
Managing Operations across the
Supply Chain
Fourth Edition
Business Forecasting
Business Math
Bowersox, Closs, Cooper, and Bowersox
Supply Chain Logistics Management
Fifth Edition
Burt, Petcavage, and Pinkerton
Supply Management
Eighth Edition
Johnson
Purchasing and Supply Management
Sixteenth Edition
Simchi-Levi, Kaminsky, and
Simchi-Levi
Designing and Managing the
Supply Chain:
Concepts, Strategies, Case Studies
Third Edition
Stock and Manrodt
Fundamentals of Supply Chain
Management
Keating, Wilson, and John Galt
Solutions, Inc.
Business Forecasting
Seventh Edition
Linear Statistics and Regression
Kutner, Nachtsheim, and Neter
Applied Linear Regression Models
Fourth Edition
Business Systems Dynamics
Sterman
Business Dynamics: Systems Thinking
and Modeling for a Complex World
Operations Management
Cachon and Terwiesch
Operations Management
Second Edition
Brown and Hyer
Managing Projects: A Team-Based
Approach
Cachon and Terwiesch
Matching Supply with Demand:
An Introduction to Operations
Management
Fourth Edition
Larson and Gray
Project Management:
The Managerial Process
Seventh Edition
Jacobs and Chase
Operations and Supply Chain
Management: The Core
Fifth Edition
Service Operations Management
Jacobs and Chase
Operations and Supply Chain
Management
Fifteenth Edition
Project Management
Bordoloi, Fitzsimmons, and Fitzsimmons
Service Management: Operations,
Strategy, Information Technology
Ninth Edition
Management Science
Hillier and Hillier
Introduction to Management Science:
A Modeling and Case Studies
Approach with Spreadsheets
Sixth Edition
Schroeder and Goldstein
Operations Management in the
Supply Chain: Decisions and Cases
Seventh Edition
Stevenson
Operations Management
Thirteenth Edition
Slater and Wittry
Practical Business Math Procedures
Thirteenth Edition
Slater and Wittry
Math for Business and Finance:
An Algebraic Approach
Second Edition
Business Statistics
Bowerman, O’Connell, and Murphree
Business Statistics in Practice
Ninth Edition
Doane and Seward
Applied Statistics in Business and
Economics
Sixth Edition
Doane and Seward
Essential Statistics in Business and Economics
Third Edition
Jaggia and Kelly
Business Statistics: Communicating
with Numbers
Third Edition
Jaggia and Kelly
Essentials of Business Statistics:
Communicating with Numbers
Second Edition
Lind, Marchal, and Wathen
Basic Statistics for Business and
Economics
Ninth Edition
Lind, Marchal, and Wathen
Statistical Techniques in Business
and Economics
Seventeenth Edition
McGuckian
Connect Master: Business Statistics
www.ebookslides.com
2e
Essentials of
Business Statistics
Communicating with Numbers
SANJIV JAGGIA
ALISON KELLY
California Polytechnic
State University
Suffolk University
www.ebookslides.com
ESSENTIALS OF BUSINESS STATISTICS: COMMUNICATING WITH NUMBERS, SECOND EDITION
Published by McGraw-Hill Education, 2 Penn Plaza, New York, NY 10121. Copyright © 2020 by McGraw-Hill
Education. All rights reserved. Printed in the United States of America. Previous editions © 2014. No part of this
publication may be reproduced or distributed in any form or by any means, or stored in a database or retrieval
system, without the prior written consent of McGraw-Hill Education, including, but not limited to, in any network
or other electronic storage or transmission, or broadcast for distance learning.
Some ancillaries, including electronic and print components, may not be available to customers outside the
United States.
This book is printed on acid-free paper.
1 2 3 4 5 6 7 8 9 LWI 21 20 19
ISBN 978-1-260-23951-5
MHID 1-260-23951-9
Portfolio Manager: Noelle Bathurst
Product Developers: Ryan McAndrews
Marketing Manager: Harper Christopher
Content Project Managers: Pat Frederickson and Jamie Koch
Buyer: Laura Fuller
Design: Egzon Shaqiri
Content Licensing Specialist: Ann Marie Jannette
Cover Design: Beth Blech
Compositor: SPi Global
All credits appearing on page or at the end of the book are considered to be an extension of the copyright page.
Library of Congress Cataloging-in-Publication Data
Names: Jaggia, Sanjiv, 1960- author. | Hawke, Alison Kelly, author.
Title: Essentials of business statistics : communicating with numbers/Sanjiv Jaggia,
California Polytechnic State University, Alison Kelly, Suffolk University.
Description: Second Edition. | Dubuque : McGraw-Hill Education, [2018] |
Revised edition of the authors’ Essentials of business statistics, c2014.
Identifiers: LCCN 2018023099 | ISBN 9781260239515 (alk. paper)
Subjects: LCSH: Commercial statistics.
Classification: LCC HF1017 .J343 2018 | DDC 519.5-dc23
LC record available at />
The Internet addresses listed in the text were accurate at the time of publication. The inclusion of a website
does not indicate an endorsement by the authors or McGraw-Hill Education, and McGraw-Hill Education
does not guarantee the accuracy of the information presented at these sites.
mheducation.com/highered
www.ebookslides.com
Dedicated to Chandrika, Minori,
John, Megan, and Matthew
v
www.ebookslides.com
A B O U T T H E AU T H O R S
Sanjiv Jaggia
Sanjiv Jaggia is the associate dean of graduate programs
and a professor of economics and finance at California
Polytechnic State University in San Luis Obispo, California.
After earning a Ph.D. from Indiana University, Bloomington,
in 1990, Dr. Jaggia spent 17 years at Suffolk University,
Boston. In 2003, he became a Chartered Financial
Analyst (CFA®). Dr. Jaggia’s research interests include
empirical finance, statistics, and econometrics. He has
published extensively in research journals, including the
Courtesy of Sanjiv Jaggia
Journal of Empirical Finance, Review of Economics and
Statistics, Journal of Business and Economic Statistics, Journal of Applied Econometrics, and Journal of Econometrics. Dr. Jaggia’s ability to communicate in the classroom
has been acknowledged by several teaching awards. In 2007, he traded one coast for
the other and now lives in San Luis Obispo, California, with his wife and daughter. In his
spare time, he enjoys cooking, hiking, and listening to a wide range of music.
Alison Kelly
Courtesy of Alison Kelly
Alison Kelly is a professor of economics at Suffolk
University in Boston, Massachusetts. She received her
B.A. degree from the College of the Holy Cross in
Worcester, Massachusetts; her M.A. degree from the
University of Southern California in Los Angeles; and her
Ph.D. from Boston College in Chestnut Hill, Massachusetts.
Dr. Kelly has published in journals such as the American
Journal of Agricultural Economics, Journal of Macroeconomics, Review of Income and Wealth, Applied
Financial Economics, and Contemporary Economic
Policy. She is a Chartered Financial Analyst (CFA®) and teaches review courses in quantitative methods to candidates preparing to take the CFA exam. Dr. Kelly has also
served as a consultant for a number of companies; her most recent work focused on
how large financial institutions satisfy requirements mandated by the Dodd-Frank Act.
She resides in Hamilton, Massachusetts, with her husband, daughter, and son.
vi
www.ebookslides.com
A Unique Emphasis on
Communicating with Numbers
Makes Business Statistics Relevant
to Students
We wrote Essentials of Business Statistics: Communicating with Numbers because we
saw a need for a contemporary, core statistics text that sparked student interest and
bridged the gap between how statistics is taught and how practitioners think about and
apply statistical methods. Throughout the text, the emphasis is on communicating with
numbers rather than on number crunching. In every chapter, students are exposed to
statistical information conveyed in written form. By incorporating the perspective of
practitioners, it has been our goal to make the subject matter more relevant and the presentation of material more straightforward for students. Although the text is applicationoriented and practical, it is also mathematically sound and uses notation that is generally
accepted for the topic being covered.
From our years of experience in the classroom, we have found that an effective way
to make statistics interesting is to use timely applications. For these reasons, examples
in Essentials of Business Statistics come from all walks of life, including business, economics, sports, health, housing, the environment, polling, and psychology. By carefully
matching examples with statistical methods, students learn to appreciate the relevance of
statistics in our world today, and perhaps, end up learning statistics without realizing they
are doing so.
This is probably the best book I have seen in terms of explaining concepts.
Brad McDonald, Northern Illinois University
The book is well written, more readable and interesting than most
stats texts, and effective in explaining concepts. The examples and
cases are particularly good and effective teaching tools.
Andrew Koch, James Madison University
Clarity and brevity are the most important things I look for—this text
has both in abundance.
Michael Gordinier, Washington University, St. Louis
WALKTHROUGH E S S E N T I A L S O F B usiness S tatistics vii
www.ebookslides.com
Continuing Key Features
The second edition of Essentials of Business Statistics reinforces and expands six core
features that were well-received in the first edition.
Integrated Introductory Cases. Each chapter begins with an interesting and relevant
introductory case. The case is threaded throughout the chapter, and once the relevant statistical tools have been covered, a synopsis—a short summary of findings—is provided.
The introductory case often serves as the basis of several examples in other chapters.
Writing with Statistics. Interpreting results and conveying information effectively is
critical to effective decision making in virtually every field of employment. Students are
taught how to take the data, apply it, and convey the information in a meaningful way.
Unique Coverage of Regression Analysis. Relevant and extensive coverage of
regression without repetition is an important hallmark of this text.
Written as Taught. Topics are presented the way they are taught in class, beginning
with the intuition and explanation and concluding with the application.
Integration of Microsoft Excel®. Students are taught to develop an understanding of
the concepts and how to derive the calculation; then Excel is used as a tool to perform
the cumbersome calculations. In addition, guidelines for using Minitab, SPSS, JMP, and
now R are provided in chapter appendices.
Connect®. Connect is an online system that gives students the tools they need to be
successful in the course. Through guided examples and LearnSmart adaptive study tools,
students receive guidance and practice to help them master the topics.
I really like the case studies and the emphasis on writing. We are making a big effort
to incorporate more business writing in our core courses, so that meshes well.
Elizabeth Haran, Salem State University
For a statistical analyst, your analytical skill is only as good as your communication
skill. Writing with statistics reinforces the importance of communication and
provides students with concrete examples to follow.
Jun Liu, Georgia Southern University
viii E S S E N T I A L S
O F B usiness S tatistics WALKTHROUGH
www.ebookslides.com
Features New to the Second Edition
The second edition of Essentials of Business Statistics features a number of improvements suggested by many reviewers and users of the first edition. The following are the
major changes.
We focus on the p-Value Approach. We have found that students often get confused
with the mechanics of implementing a hypothesis test using both the p-value approach and
the critical value approach. While the critical value approach is attractive when a computer
is unavailable and all calculations must be done by hand, most researchers and practitioners
favor the p-value approach since virtually every statistical software package reports p-values.
Our decision to focus on the p-value approach was further supported by recommendations
set forth by the Guidelines for Assessment and Instruction in Statistics Education (GAISE)
College Report 2016 published by the American Statistical Association (tat.
org/asa/files/pdfs/GAISE/GaiseCollege_Full.pdf). The GAISE Report recommends that
‘students should be able to interpret and draw conclusions from standard output from statistical software’ (page 11) and that instructors should consider shifting away from the use
of tables (page 23). Finally, we surveyed users of Essentials of Business Statistics, and they
unanimously supported our decision to focus on the p-value approach. For those instructors
interested in covering the critical value approach, it is discussed in the appendix to Chapter 9.
We added dozens of applied exercises with varying levels of difficulty. Many of
these exercises include new data sets that encourage the use of the computer; however,
just as many exercises retain the flexibility of traditional solving by hand.
We streamlined the Excel instructions. We feel that this modification provides a more
seamless reinforcement for the relevant topic. For those instructors who prefer to omit the
Excel parts so that they can use a different software, these sections can be easily skipped.
We completely revised Chapter 13 (More on Regression Analysis). Recognizing
the importance of regression analysis in applied work, we have made major enhancements to Chapter 13. The chapter now contains the following sections: Dummy Variables, Interaction with Dummy Variables, Nonlinear Relationships, Trend Forecasting
Models, and Forecasting with Trend and Seasonality.
In addition to the Minitab, SPSS, and JMP instructions that appear in chapter
appendices, we now include instructions for R. The main reason for this addition
is that R is an easy-to-use and wildly popular software that merges the convenience of
statistical packages with the power of coding.
We reviewed every Connect exercise. Since both of us use Connect in our classes,
we have attempted to make the technology component seamless with the text itself. In
addition to reviewing every Connect exercise, we have added more conceptual exercises,
evaluated rounding rules, and revised tolerance levels. The positive feedback from users
of the first edition has been well worth the effort. We have also reviewed every LearnSmart probe. Instructors who teach in an online or hybrid environment will especially
appreciate our Connect product.
Here are other noteworthy changes:
∙For the sake of simplicity and consistency, we have streamlined or rewritten many
Learning Outcomes.
∙ In Chapter 1 (Statistics and Data), we introduce structured data, unstructured data,
and big data; we have also revised the section on online data sources.
∙ In Chapter 4 (Introduction to Probability), we examine marijuana legalization in the
United States in the Writing with Statistics example.
∙ In Chapter 6 (Continuous Probability Distributions), we cover the normal distribution
in one section, rather than two sections.
∙ In Chapter 7 (Sampling and Sampling Distributions), we added a discussion of the
Trump election coupled with social-desirability bias.
∙ We have moved the section on “Model Assumptions and Common Violations” from
Chapter 13 (More on Regression Analysis) to Chapter 12 (Basics of Regression Analysis).
WALKTHROUGH E S S E N T I A L S O F B usiness S tatistics ix
www.ebookslides.com
Students Learn Through Real-World
Cases and Business Examples . . .
Revised Pages
Integrated Introductory
Cases
EXAMPLE 3.14
Calculate
and interpret
the Sharpe
for the Growth
the Valuefor
mutual
Each chapter opens with a real-life
case
study
thatratiosforms
the andbasis
several examfunds given that the return on a 1-year T-bill is 2%.
ples within the chapter. The questions
included
in
the
examples
create
a
roadmap for
¯ = 2. Plugging in the values
SOLUTION: Since the return on a 1-year T-bill is 2%, R
of the relevant means
and standard deviations
into thethe
Sharpechapter.
ratio yields
mastering the most important learning
outcomes
within
A synopsis of
¯ 10.09
¯ −last
R
each chapter’s introductory case is Sharpe
presented
when
the: x______
of− 2these
examples has
ratio for the Growth
mutual fund
= ________
= 0.40.
s
20.45
been discussed. Instructors of distance learners may find these
introductory
cases partic¯ 7.56 − 2
x¯ − R
Sharpe ratio for the Value mutual fund : ______ = _______ = 0.30.
ularly useful.
s
18.46
f
I
f
I
I
f
I
We had earlier
shown
Revised
Pagesthat the Growth mutual fund had a higher return, which is
good, along with a higher variance, which is bad. We can use the Sharpe ratio to
make a valid comparison between the funds. The Growth mutual fund provides
a higher Sharpe ratio than the Value mutual fund (0.40 > 0.30); therefore, the
Growth mutual fund offered more reward per unit of risk compared to the Value
mutual fund.
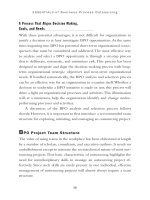
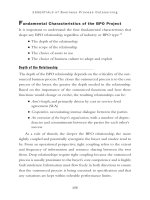
SYNOPSIS OF INTRODUCTORY CASE
Growth and value are two fundamental styles in stock and mutual
fund investing. Proponents of growth investing believe that companies that are growing faster than their peers are trendsetters
and will be able to maintain their superior growth. By investing in
the stocks of these companies, they expect their investment to
grow at a rate faster than the overall stock market. By comparison,
value investors focus on the stocks of companies that are trading
at a discount relative to the overall market or a specific sector.
Investors of value stocks believe that these stocks are undervalued and that their price will increase once their true value is
recognized by other investors. The debate between growth and
©Ingram Publishing/Getty Images
value investing is age-old, and which style dominates depends on
the sample period used for the analysis.
An analysis of annual return data for Vanguard’s Growth Index mutual fund (Growth) and Vanguard’s Value
Index mutual fund (Value) for the years 2007 through 2016 provides important information for an investor trying
to determine whether to invest in a growth mutual fund, a value mutual fund, or both types of mutual funds. Over
©Mark Bowden/Getty Images
this period, the mean return for the Growth fund of 10.09% is greater than the mean return for the Value fund
of 7.56%. While the mean return typically represents the reward of investing, it does not incorporate the risk of
investing.
Standard deviation tends to be the most common measure of risk with financial data. Since the standard deviation for the Growth fund (20.45%) is greater than the standard deviation for the Value fund (18.46%), the Growth
fund is likelier to have returns farther above and below its mean. Finally, given a risk-free rate of 2%, the Sharpe ratio
for the Growth fund is 0.40 compared to that for the Value fund of 0.30, indicating that the Growth fund provides
Jacqueline Brennan works as a financial advisor at a large investment firm. Shemore
meets
withper unit of risk. Assuming that the behavior of these returns will continue, the investor will favor investreward
an inexperienced investor who has some questions regarding two approachesingtoin mutual
Growth over Value. A commonly used disclaimer, however, states that past performance is no guarantee of
fund investing: growth investing versus value investing. The investor has heard future
that growth
results. Since the two styles often complement each other, it might be advisable for the investor to add diverfunds invest in companies whose stock prices are expected to grow at a faster rate,
to
sityrelative
to his portfolio
by using them together.
Introductory Case
Investment Decision
the overall stock market, and value funds invest in companies whose stock prices are below
their true worth. The investor has also heard that the main component of investment return is
through capital appreciation in growth funds and through dividend income in value funds. The
investor shows Jacqueline the annual return data for Vanguard’s Growth Index mutual fund
(henceforth, Growth) and Vanguard’s Value Index mutual fund (henceforth, Value). Table 3.1
shows the annual return data for these two mutual funds for the years 2007–2016.
ChAPTeR 3
numerical Descriptive Measures
B u S I n e S S S TAT I S T I C S
83
TABLE 3.1 Returns (in percent) for the Growth and the Value Funds
Year
Growth
Value
Year
2007
12.56
0.09
2012
Growth
16.89
15.00
Value
2008
−38.32
−35.97
2013
32.16
jag39519_ch03_060-103
32.85
2009
36.29
19.58
2014
13.47
13.05
2010
16.96
14.28
2015
3.17
−1.03
2011
1.71
1.00
2016
5.99
16.75
Growth_Value
83
06/13/18 07:43 PM
In all of these chapters, the opening case leads directly into the application questions that
addition to clarifying the style differences in growth investing versus value investing, Jacqueline
students will Inwill
have
regarding the material. Having a strong and related case will certainly provide
use the above sample information to
1. Calculate and interpret the typical return for these two mutual funds.
more benefit 2.toCalculate
the student,
context
leads
to improved
learning.
and interpret theas
investment
risk for these
two mutual
funds.
3. Determine which mutual fund provides the greater return relative to risk.
A synopsis of this case is provided at the end of Section 3.4.
Alan Chow, University of South Alabama
Source: finance.yahoo.com, data retrieved February 17, 2017.
61
This is an excellent approach. The student gradually gets the idea that he can look at a problem—
one which might be fairly complex—and break it down into root components. He learns that a
little bit of math could go a long way, and even more math is even more beneficial to evaluating
the problem.
Dane Peterson, Missouri State University
jag39519_ch03_060-103
x E S S E N T I A L S
61
06/13/18 07:43 PM
O F B usiness S tatistics WALKTHROUGH
www.ebookslides.com
and Build Skills to Communicate
Results
Writing with Statistics
Writing with statistics shows
One of our most important innovations is the inclusion of a sample report
within every chapter (except Chapter 1). Our intent is to show students how
that statistics is more than
to convey statistical information in written form to those who may not know
number crunching.
detailed statistical methods. For example, such a report may be needed as
input for managerial decision making in sales, marketing, or company planGreg Cameron,
ning. Several similar writing exercises are provided at the end of each chapBrigham Young University
ter. Each chapter also includes a synopsis that addresses questions raised from
the introductory case. This serves as a shorter writing sample for students.
These technical writing
Instructors of large sections may find these reports useful for incorporating
First Pages
writing into their statistics courses.
examples provide a very
useful example of how to
make statistics work and
turn it into a report that will
be useful to an organization.
I will strive to have my
students learn from these
examples.
Bruce P. Christensen,
Weber State University
First Pages
W R I T I N G W I T H S TAT I S T I C S
Professor Lang is a professor of economics at Salem State university. She has been
W R teaching
I T I N Ga course
W I TinHPrinciples
S T A TofI economics
S T I C S for over 25 years. Professor Lang has
never graded on a curve since she believes that relative grading may unduly penalize
(benefit) a good (poor) student in an unusually strong (weak) class. She always uses an
Professor Lang is a professor of economics at Salem State university. She has been
absolute
for making
grades, as
the two
left columns
teaching
a coursescale
in Principles
of economics
for shown
over 25 in
years.
Professor
Lang has of table 6.5.
never graded on a curve since she believes that relative grading may unduly penalize
TABLE
6.5 Grading
Scales with
Absolute
versus
Relative
(benefit) a good
(poor) student
in an unusually
strong
(weak)Grading
class. She
always
uses Grading
an
absolute scale for making grades, as shown in the two left columns of table 6.5.
Absolute Grading
Relative Grading
TABLE 6.5
Grading Scales with Absolute
Grade
Score Grading versus Relative
GradeGrading
Absolute
Grading
A
0.10
78 upGrade
to 92
Grade B
A
Score
92 and above
A
B
78 up to 92
B
64 up to 78
C
C
D
C
D
F
F
B
Probability
0.35
64 up to 78
C
0.10
0.40
58 up to 64
D
58 up to 64BelowD58
Below 58
Probability
Relative
92 and above
A Grading
F
F
0.35
0.10
0.40
0.05
0.10
0.05
©image Source, all rights reserved.
©image Source, all rights reserved.
A colleague of Professor Lang’s has convinced her to move to relative grading, since it corA colleague
Professor Lang’sproblems.
has convinced
her to move
relative grading,
since it cor-with grading based
rects forofunanticipated
Professor
Langto decides
to experiment
rects for
unanticipated
Professor
decides
experiment
with gradingusing
basedthis relative grading
on the relative problems.
scale as shown
in Lang
the two
righttocolumns
of table 6.5.
on the relative scale as shown in the two right columns of table 6.5. using this relative grading
scheme, the top 10% of students will get A’s, the next 35% B’s, and so on. Based on her years
scheme, the top 10% of students will get A’s, the next 35% B’s, and so on. Based on her years
of teaching experience, Professor Lang believes that the scores in her course follow a normal
of teaching experience, Professor Lang believes that the scores in her course follow a normal
distribution
withofa78.6
mean
anddeviation
a standard
deviation of 12.4.
distribution
with a mean
andofa 78.6
standard
of 12.4.
Professor
Lang
wants
to useinformation
the abovetoinformation to
Professor
Lang wants
to use
the above
This is an excellent
approach. . . . The ability
to translate numerical
information into words that
others can understand is
critical.
Scott Bailey, Troy University
1. Calculate
probabilities
based on the
absolute
scale.
Comparescale.
these Compare
probabilitiesthese
to the probabilities to the
1. Calculate
probabilities
based
on the
absolute
relativerelative
scale. scale.
2. Calculate the range of scores for various grades based on the relative scale. Compare
2. Calculate the range of scores for various grades based on the relative scale. Compare
these ranges to the absolute scale.
these ranges to the absolute scale.
3. Determine which grading scale makes it harder to get higher grades.
3. Determine which grading scale makes it harder to get higher grades.
Sample
Report—
Absolute
Grading
versus
Relative
Grading
Many teachers would confess that grading is one of the most difficult tasks of their profession.
two common grading systems used in higher education are relative and absolute. Relative
Many teachers would confess that grading is one of the most difficult tasks of their profession.
grading systems are norm-referenced or curve-based, in which a grade is based on the stucommon
systemsgrading
used in
higheroneducation
are relative
and absolute. Relative
dent’s two
relative
position grading
in class. Absolute
systems,
the other hand,
are criteriongrading
systems
areis related
norm-referenced
or absolute
curve-based,
in which
a grade
is based on the stureferenced,
in which
a grade
to the student’s
performance
in class.
in short,
dent’s grading,
relativethe
position
class.
Absolutetograding
systems,
on whereas
the other
with absolute
student’sinscore
is compared
a predetermined
scale,
withhand, are criterionrelativereferenced,
grading, the score
is
compared
to
the
scores
of
other
students
in
the
class.
in which a grade is related to the student’s absolute performance in class. in short,
Letwith
X represent
a grade
in Professor
Lang’s class,
which
is normally to
distributed
with a meanscale, whereas with
absolute
grading,
the student’s
score
is compared
a predetermined
of 78.6 and a standard deviation of 12.4. this information is used to derive the grade probabilirelative grading, the score is compared to the scores of other students in the class.
ties based on the absolute scale. For instance, the probability of receiving an A is derived as
Let X represent a Other
gradeprobabilities,
in Professor
Lang’s
class,are
which
is normally
with a mean
P(X ≥ 92) = P(Z ≥ 1.08) = 0.14.
derived
similarly,
presented
in tabledistributed
6.A.
Sample
Report—
Absolute
Grading
versus
Relative
Grading
of 78.6 and a standard deviation of 12.4. this information is used to derive the grade probabilities based
on6.A
theProbabilities
absoluteBased
scale.
For instance,
probability
of receiving an A is derived as
TABLE
on Absolute
Scale and the
Relative
Scale
P(X ≥ 92) = P(Z ≥ 1.08) = 0.14.
Otheron
probabilities,
derived
are presented in table 6.A.
Probability Based
Probability
Based similarly,
on
Grade
A
B
C
D
F
Absolute Scale
Excellent. Students need to
become better writers.
Bob Nauss, University of
Missouri, St. Louis
Relative Scale
0.14
0.10 Scale and Relative Scale
TABLE 6.A Probabilities
Based on Absolute
Grade
A
B
C
D
F
jag39519_ch06_182-217 209
jag39519_ch06_182-217 209
0.38
0.35
Probability Based on
0.36
0.40
Absolute Scale
0.07
0.10
0.14
0.05
0.05
0.38
0.36
0.07
0.05
Probability Based on
Relative Scale
0.10
0.35
0.40
0.10
0.05
209
05/25/18 02:33 PM
209
05/25/18 02:33 PM
WALKTHROUGH E S S E N T I A L S O F B usiness S tatistics xi
www.ebookslides.com
Unique Coverage and
Presentation . . .
Unique Coverage of Regression Analysis
By comparing this
chapter with other
books, I think that
this is one of the best
explanations about
regression I have seen.
Cecilia Maldonado,
Georgia Southwestern
State University
This is easy for students
to follow and I do get
the feeling . . . the
sections are spoken
language.
Zhen Zhu, University of
Central Oklahoma
xii E S S E N T I A L S
We combine simple and multiple regression in one chapter, which we believe is a
seamless grouping and eliminates needless repetition. This grouping allows more
coverage of regression analysis than the vast majority of Essentials texts. This focus
reflects the topic’s growing use in practice. However, for those instructors who prefer
to cover only simple regression, doing so is still an option.
The authors have put forth a novel and innovative way to present
regression which in and of itself should make instructors take a long and
hard look at this book. Students should find this book very readable and
a good companion for their course.
Harvey A. Singer, George Mason University
Written as Taught
We introduce topics just the way we teach them; that is, the relevant tools follow the
opening application. Our roadmap for solving problems is
1. Start with intuition
2. Introduce mathematical rigor, and
3. Produce computer output that confirms results.
We use worked examples throughout the text to illustrate how to apply concepts to
solve real-world problems.
O F B usiness S tatistics WALKTHROUGH
Hypergeometric
P(X = x)
www.ebookslides.com
=HYPGeOM.Dist(x,
n, S, N, 0)
P(X ≤ x)
=HYPGeOM.Dist(x, n, S, N, 1)
that Make the Content More
EXAMPLE 5.7
Effective
In the past decade, the use of technology has skyrocketed, with social media
blooming into one of the most valuable methods of communication. People are
®
Integration
of media
Microsoft
turning to social
to stay in Excel
touch with friends and family members, connect
with old
friends,
catch
thefocus
news,onlook
employment,
and bematerial
entertained.
AccordWe prefer
that
students
first
andfor
absorb
the statistical
before
replicating
ing
to
a
2016
Pew
Research
survey,
68%
of
all
U.S.
adults
are
users. with
their results with a computer. Solving each application manually provides students
Consider
a sample ofof100
a deeper
understanding
therandomly
relevantselected
concept.American
However,adults.
we recognize that, primarily
a. cumbersome
What is the probability
thatorexactly
70 American
adultstables,
are Facebook
users?
due to
calculations
the need
for statistical
embedding
computer
output
necessary.
Microsoftthat
Excel
is thethan
primary
softwareadults
package
b. isWhat
is the probability
no more
70 American
are used in this text.
We chose
Excel over
other statistical packages based on reviewer feedback and the fact
users?
that students
benefit
from
the added
experience.
provide instructions
for
c. What is the probability
that at spreadsheet
least 70 American
adults We
are Facebook
users?
using Minitab, SPSS, JMP, and R in chapter appendices.
SOLUTION: We let X denote the number of American adults who are Facebook
users. We also know that p = 0.68 and n = 100.
Using Excel to Obtain Binomial Probabilities
We use Excel’s BINOM.DIST function to calculate binomial probabilities. In order to find P(X = x), we enter “=BINOM.DIST(x, n, p, 0)” where x
is the number of successes, n is the number of trials, and p is the probability
of success. If we enter a “1” for the last argument in the function, then Excel
returns P(X ≤ x).
a. In order to find the probability that exactly 70 American adults are Facebook
users, P(X = 70), we enter “=BINOM.DIST(70, 100, 0.68, 0)” and Excel
returns 0.0791.
b. In order to find the probability that no more than 70 American adults are
Facebook users, P(X ≤ 70), we enter “=BINOM.DIST(70, 100, 0.68, 1)”
and Excel returns 0.7007.
c. In order to find the probability that at least 70 American adults are
Facebook users, P(X ≥ 70) = 1 − P(X ≤ 69), we enter “=1−BINOM.
DIST(69, 100, 0.68, 1)” and Excel returns 0.3784.
B u s i n e s s s tat i s t i c s
162
PaRt tHRee
. . . does a solid job of
building the intuition
behind the concepts
and then adding
mathematical rigor
to these ideas before
finally verifying the
results with Excel.
Matthew Dean,
University of
Southern Maine
Probability and Probability Distributions
06/26/18 04:58 PM
WALKTHROUGH E S S E N T I A L S O F B usiness S tatistics xiii
www.ebookslides.com
Real-World Exercises and Case
Studies that Reinforce the Material
Mechanical and Applied Exercises
Chapter exercises are a well-balanced blend of mechanical, computational-type problems
followed by more ambitious, interpretive-type problems. We have found that simpler drill
problems tend to build students’ confidence prior to tackling more difficult applied problems. Moreover, we repeatedly use many data sets—including house prices, rents, stock
returns, salaries, and debt—in various chapters of the text. For instance, students first use
these real data to calculate summary measures, make statistical inferences
with confiConfirming
Pages
dence intervals and hypothesis tests, and finally, perform regression analysis.
18. Consider the following hypothesis test:
H 0 : μ ≤ −5
HA: μ > −5
Applied exercises from
The Wall Street Journal,
A random sample of 50 observations yields a sample mean
Kiplinger’s, Fortune, The New of −3. The population standard deviation is 10. Calculate the
p-value. What is the conclusion to the test if α = 0.05?
York Times, USA Today; various
19. Consider the following hypothesis test:
H : μ ≤ 75
websites—Census.gov,
H : μ > 75
Zillow.com, Finance.yahoo.com, A random sample of 100 observations yields a sample mean
of 80. The population standard deviation is 30. Calculate the
ESPN.com; and more.
0
A
p-value. What is the conclusion to the test if α = 0.10?
20. Consider the following hypothesis test:
H 0 : μ = −100
H A : μ ≠ −100
A random sample of 36 observations yields a sample mean
of −125. The population standard deviation is 42. Conduct
the test at α = 0.01.
21. Consider the following hypotheses:
H 0 : μ = 120
H A : μ ≠ 120
The population is normally distributed with a population
standard deviation of 46.
a. If x¯ = 132 and n = 50, what is the conclusion at the
5% significance level?
b. If x¯ = 108 and n = 50, what is the conclusion at the
10% significance level?
22.
Excel_1. Given the accompanying sample data, use
Excel’s formula options to determine if the population mean
is less than 125 at the 5% significance level. Assume that the
population is normally distributed and that the population
standard deviation equals 12.
23.
Excel_2. Given the accompanying sample data, use
Excel’s formula options to determine if the population mean
differs from 3 at the 5% significance level. Assume that the
population is normally distributed and that the population
standard deviation equals 5.
25. Customers at Costco spend an average of $130 per trip (The
Wall Street Journal, October 6, 2010). One of Costco’s rivals
would like to determine whether its customers spend more
per trip. A survey of the receipts of 25 customers found that
the sample mean was $135.25. Assume that the population
standard deviation is $10.50 and that spending follows a
normal distribution.
a. Specify the null and alternative hypotheses to test whether
average spending at the rival’s store is more than $130.
b. Calculate the value of the test statistic and the p-value.
c. At the 5% significance level, what is the conclusion
to the test?
26. In May 2008, CNN reported that sports utility vehicles (SUVs)
are plunging toward the “endangered” list. Due to the uncertainty of oil prices and environmental concerns, consumers are
replacing gas-guzzling vehicles with fuel-efficient smaller cars.
As a result, there has been a big drop in the demand for new
as well as used SUVs. A sales manager of a used car dealership for SUVs believes that it takes more than 90 days, on
average, to sell an SUV. In order to test his claim, he samples
40 recently sold SUVs and finds that it took an average of
95 days to sell an SUV. He believes that the population
standard deviation is fairly stable at 20 days.
a. State the null and the alternative hypotheses for
the test.
b. What is the p-value?
c. Is the sales manager’s claim justified at α = 0.01?
27. According to the Centers for Disease Control and Prevention
(February 18, 2016), 1 in 3 American adults do not get enough
sleep. A researcher wants to determine if Americans are sleeping
less than the recommended 7 hours of sleep on weekdays. He
takes a random sample of 150 Americans and computes the
average sleep time of 6.7 hours on weekdays. Assume that the
population is normally distributed with a known standard deviation of 2.1 hours. Test the researcher’s claim at α = 0.01.
28. A local bottler in Hawaii wishes to ensure that an average
of 16 ounces of passion fruit juice is used to fill each bottle.
In order to analyze the accuracy of the bottling process, he
takes a random sample of 48 bottles. The mean weight of the
passion fruit juice in the sample is 15.80 ounces. Assume that
the population standard deviation is 0.8 ounce.
a. State the null and the alternative hypotheses to test if the
bottling process is inaccurate.
b. What is the value of the test statistic and the p-value?
c. At α = 0.05, what is the conclusion to the hypothesis
test? Make a recommendation to the bottler.
I especially like the introductory cases, the quality of the end-of-section
Applications
problems, and the writing examples.
24. It is advertised that the average braking distance for a small
Dave Leupp,
ofequals
Colorado
at Colorado Springs
car travelingUniversity
at 65 miles per hour
120 feet. A transportation researcher wants to determine if the statement made in
the advertisement is false. She randomly test drives 36 small
cars at 65 miles per hour and records the braking distance.
The sample average braking distance is computed as 114 feet.
Assume that the population standard deviation is 22 feet.
a. State the null and the alternative hypotheses for the test.
b. Calculate the value of the test statistic and the p-value.
c. Use α = 0.01 to determine if the average breaking
distance differs from 120 feet.
Their exercises and problems are excellent!
29.
xiv E S S E N T I A L S
MV_Houses. A realtor in Mission Viejo, California,
believes that the average price of a house is more than
$500,000.
a. State the null and the alternative hypotheses for the test.
b. The data accompanying this exercise show house prices.
(Data are in $1,000s.) Assume the population standard
O F B usiness S tatistics WALKTHROUGH
Chapter 9
hypothesis testing
Erl Sorensen, Bentley University
e S S e N t I a L S O F B u S I N e S S S tat I S t I C S
307
www.ebookslides.com
Features that Go Beyond the
Typical
TABLE 5.B Calculating Arroyo’s Expected Bonus
Bonus (in $), xi
0
Probability, P(xi)
0.20
Weighted Value, xi P(xi)
0 × 0.20 = 0
50,000
0.25
50,000 × 0.25 = 12,500
100,000
0.35
100,000 × 0.35 = 35,000
150,000
0.20
150,000 × 0.20 = 30,000
Conceptual Review
Total = 77,500
bonus
to $77,500.
Thus, her salary
options
are provides a more holistic
At the end ofArroyo’s
each expected
chapter,
weamounts
present
a conceptual
review
that
approach to reviewing
the material. This section revisits the learning outcomes and proOption 1: $125,000 + $77,500 = $202,500
Option 2: $150,000 + (1/2 × $77,500) = $188,750
vides the most important
definitions, interpretations, and formulas.
Arroyo should choose Option 1 as her salary plan.
COnCEPTUAL REVIEW
LO 5.1 Describe a discrete random variable and its probability distribution.
A random variable summarizes outcomes of an experiment with numerical values. A
discrete random variable assumes a countable number of distinct values, whereas a
continuous random variable is characterized by uncountable values in an interval.
The probability mass function for a discrete random variable X is a list of the values of
X with the associated probabilities; that is, the list of all possible pairs (x, P(X = x)). The
cumulative distribution function of X is defined as P(X ≤ x).
LO 5.2 Calculate and interpret summary measures for a discrete random
variable.
For a discrete random variable X with values x1, x2, x3, . . . , which occur with probabilities P(X = xi), the expected value of X is calculated as E(X) = μ = ΣxiP(X = xi). We
interpret the expected value as the long-run average value of the random variable over
infinitely many independent repetitions of an experiment. Measures of dispersion indicate whether the values of X are clustered about μ or widely scattered from μ. The variance
2
2
of X is calculated
__ as Var(X) = σ = Σ(xi − μ) P(X = xi). The standard deviation of X is
SD(X ) = σ = √σ2 .
In general, a risk-averse consumer expects a reward for taking risk. A risk-averse
consumer may decline a risky prospect even if it offers a positive expected gain. A
risk-neutral consumer completely ignores risk and always accepts a prospect that offers
a positive expected gain.
LO 5.3 Calculate and interpret probabilities for a binomial random variable.
A Bernoulli process is a series of n independent and identical trials of an experiment
such that on each trial there are only two possible outcomes, conventionally labeled “success” and “failure.” The probabilities of success and failure, denoted p and 1 − p, remain
the same from trial to trial.
For a binomial random variable X, the probability of x successes in n Bernoulli trials is
x
n−x
n!
P(X = x) = (nx)px (1 − p)n−x = _____
for x = 0, 1, 2, . . . , n.
x!(n − x)! p (1 − p)
The expected value, the variance, and the standard deviation of a_______
binomial random variable are E(X) = np, Var(X) = σ2 = np(1 − p), and SD(X ) = σ = √np(1 − p ) , respectively.
CHAPTER 5
Discrete Probability Distributions
B U S I n E S S S TAT I S T I C S
175
Most texts basically list what one should have learned but don’t add much to that. You do a
good job of reminding the reader of what was covered and what was most important about it.
Andrew Koch, James Madison University
jag39519_ch05_144-181
175
06/13/18 07:46 PM
They have gone beyond the typical [summarizing formulas] and I like the structure.
This is a very strong feature of this text.
Virginia M. Miori, St. Joseph’s University
WALKTHROUGH E S S E N T I A L S O F B usiness S tatistics xv
www.ebookslides.com
Students—study more efficiently, retain more
and achieve better outcomes. Instructors—focus
on what you love—teaching.
SUCCESSFUL SEMESTERS INCLUDE CONNECT
For Instructors
You’re in the driver’s seat.
Want to build your own course? No problem. Prefer to use our
turnkey, prebuilt course? Easy. Want to make changes throughout the
semester? Sure. And you’ll save time with Connect’s auto-grading too.
65%
Less Time
Grading
They’ll thank you for it.
Adaptive study resources like SmartBook® help your
students be better prepared in less time. You can
transform your class time from dull definitions to dynamic
debates. Hear from your peers about the benefits of
Connect at www.mheducation.com/highered/connect
Make it simple, make it affordable.
Connect makes it easy with seamless integration using any of the
major Learning Management Systems—Blackboard®, Canvas,
and D2L, among others—to let you organize your course in one
convenient location. Give your students access to digital materials
at a discount with our inclusive access program. Ask your
McGraw-Hill representative for more information.
©Hill Street Studios/Tobin Rogers/Blend Images LLC
Solutions for your challenges.
A product isn’t a solution. Real solutions are affordable,
reliable, and come with training and ongoing support
when you need it and how you want it. Our Customer
Experience Group can also help you troubleshoot
tech problems—although Connect’s 99% uptime
means you might not need to call them. See for
yourself at status.mheducation.com
www.ebookslides.com
For Students
Effective, efficient studying.
Connect helps you be more productive with your
study time and get better grades using tools like
SmartBook, which highlights key concepts and creates
a personalized study plan. Connect sets you up for
success, so you walk into class with confidence and
walk out with better grades.
©Shutterstock/wavebreakmedia
I really liked this app it
“
made it easy to study when
—
you don't have your textbook in front of you.
”
- Jordan Cunningham,
Eastern Washington University
Study anytime, anywhere.
Download the free ReadAnywhere app and access your
online eBook when it’s convenient, even if you’re offline.
And since the app automatically syncs with your eBook in
Connect, all of your notes are available every time you open
it. Find out more at www.mheducation.com/readanywhere
No surprises.
The Connect Calendar and Reports tools
keep you on track with the work you need
to get done and your assignment scores.
Life gets busy; Connect tools help you
keep learning through it all.
13
14
Chapter 12 Quiz
Chapter 11 Quiz
Chapter 13 Evidence of Evolution
Chapter 11 DNA Technology
Chapter 7 Quiz
Chapter 7 DNA Structure and Gene...
and 7 more...
Learning for everyone.
McGraw-Hill works directly with Accessibility Services
Departments and faculty to meet the learning needs of all
students. Please contact your Accessibility Services office
and ask them to email , or visit
www.mheducation.com/accessibility for more information.
www.ebookslides.com
What Resources are Available for
Instructors?
Instructor Library
The Connect Instructor Library is your repository for additional resources to improve student engagement in and out of class. You can select and use any asset that enhances your
lecture. The Connect Instructor Library includes:
∙
∙
∙
∙
∙
PowerPoint presentations
Excel Data Files
Test Bank
Instructor’s Solutions Manual
Digital Image Library
Tegrity Campus:
Lectures 24/7
Tegrity Campus is integrated in Connect to help make your class time available 24/7.
With Tegrity, you can capture each one of your lectures in a searchable format for students to review when they study and complete assignments using Connect. With a simple
one-click start-and-stop process, you can capture everything that is presented to students
during your lecture from your computer, including audio. Students can replay any part of
any class with easy-to-use browser-based viewing on a PC or Mac.
Educators know that the more students can see, hear, and experience class resources,
the better they learn. In fact, studies prove it. With Tegrity Campus, students quickly
recall key moments by using Tegrity Campus’s unique search feature. This search helps
students efficiently find what they need, when they need it, across an entire semester of
class recordings. Help turn all your students’ study time into learning moments immediately supported by your lecture. To learn more about Tegrity, watch a two-minute Flash
demo at .
xviii E S S E N T I A L S
O F B usiness S tatistics WALKTHROUGH
www.ebookslides.com
ALEKS
ALEKS is an assessment and learning program that provides individualized instruction
in Business Statistics, Business Math, and Accounting. Available online in partnership
with McGraw-Hill Education, ALEKS interacts with students much like a skilled human
tutor, with the ability to assess precisely a student’s knowledge and provide instruction on
the exact topics the student is most ready to learn. By providing topics to meet individual
students’ needs, allowing students to move between explanation and practice, correcting
and analyzing errors, and defining terms, ALEKS helps students to master course content
quickly and easily.
ALEKS also includes an instructor module with powerful, assignment-driven features and extensive content flexibility. ALEKS simplifies course management and allows
instructors to spend less time with administrative tasks and more time directing student
learning. To learn more about ALEKS, visit www.aleks.com.
MegaStat® for Microsoft Excel®
MegaStat® by J. B. Orris of Butler University is a full-featured Excel add-in that is
available online through the MegaStat website at www.mhhe.com/megastat or through
an access card packaged with the text. It works with Excel 2016, 2013, and 2010 (and
Excel: Mac 2016). On the website, students have 10 days to successfully download and
install MegaStat on their local computer. Once installed, MegaStat will remain active in
Excel with no expiration date or time limitations. The software performs statistical analyses within an Excel workbook. It does basic functions, such as descriptive statistics, frequency distributions, and probability calculations, as well as hypothesis testing, ANOVA,
and regression. MegaStat output is carefully formatted, and its ease-of-use features
include Auto Expand for quick data selection and Auto Label detect. Since MegaStat
is easy to use, students can focus on learning statistics without being distracted by the
software. MegaStat is always available from Excel’s main menu. Selecting a menu item
pops up a dialog box. Screencam tutorials are included that provide a walkthrough of
major business statistics topics. Help files are built in, and an introductory user’s manual
is also included.
WALKTHROUGH E S S E N T I A L S O F B usiness S tatistics xix
www.ebookslides.com
What Resources are Available for
Students?
Revised Pages
a. State the null and the alternative hypotheses for the test.
b. The data accompanying this exercise show hourly
wages. Find the value of the test statistic and the
p-value.
c. At α = 0.05, what is the conclusion to the test? Is the
average hourly wage less than $22?
deviation is $100 (in $1,000s). What is the value of the
test statistic and the p-value?
At α = 0.05, what is the conclusion to the test? Is the
realtor’s claim supported by the data?
c.
30.
Home_Depot. The data accompanying this exercise
show the weekly stock price for Home Depot. Assume that
stock prices are normally distributed with a population stan32.
CT_Undergrad_Debt. On average, a college student
dard deviation of $3.
graduates with $27,200 in debt (The Boston Globe, May 27,
a. State the null and the alternative hypotheses in order
2012). The data accompanying this exercise show the debt for
to test whether or not the average weekly stock price
40 recent undergraduates from Connecticut. Assume that the
Confirmingpopulation
Pages standard deviation is $5,000.
differs from $30.
b. Find the value of the test statistic and the p-value.
a. A researcher believes that recent undergraduates
c. At α = 0.05, can you conclude that the average weekly
from Connecticut have less debt than the national
stock price does not equal $30?
average. Specify the competing hypotheses to test
31.
Hourly_Wage. An economist wants to test if the average hourly wage is less than $22. Assume that the population
standard deviation is $6.
Integration of Excel Data Sets. A convenient feature is the inclusion of an Excel data file
link in many problems using data files in their
calculation. The link allows students to easily
launch into Excel, work the problem, and return
to Connect to key in the answer and receive
feedback on their results.
this belief.
b. Find the value of the test statistic and the p-value.
c. Do the data support the researcher’s claim, at α = 0.10?
a. Find the sample mean time used to compute the
rtgage rate
confidence interval.
sample of
d from this
LO 9.4 b. Determine the confidence level used for the analysis.
ar fixed mort15.
A study reports that recent
Conduct
a hypothesisCT_Undergrad_Debt.
test
ulation standard for the population
college
graduates from New Hampshire face the highest
mean
nfidence inter- when σ is unknown.
average debt of $31,048
Boston
Globe, Mayhypothesis
27, 2012). tests for the population mean μ under the assumpSo far(The
we have
considered
tgage rate.
A researcher from Connecticut
to determine
howdeviation σ is known. In most business applications, σ is
tion that thewants
population
standard
9.3 HYPOTHESIS TEST FOR THE POPuLATION
MEAN WHEN σ IS uNKNOWN
not known
wefare.
haveHetocollects
replacedata
σ with the sample standard deviation s to estimate the
recent undergraduates
from thatand
state
X . A portion of the
standard
error of ¯
on debt from 40 recent
undergraduates.
data is shown in the accompanying table. Assume that the
population standard deviation is $5,000.
T E ST STAT I ST I C F O R μ WH EN σ I S UNK NOWN
TheDebt
value of the test statistic for the hypothesis test of the population mean μ when
the population standard deviation σ is unknown is computed as
24040
x¯ − μ 0
__ ,
t df = _____
19153
s / √n
⋮
where μ0 is the hypothesized value of the population mean, s is the sample standard
29329 n is the sample size, and the degrees of freedom df = n − 1. This formula
deviation,
X (approximately) follows a normal distribution.
is valid only if ¯
.S. Racking Up
hat Americans
archer in a
mean weekday
dom sample of
mean sleep time
ard deviation is
the population
dents of this
at the mean
dwestern town
o California.
Louis, it is takis concerned
ir house on
t the last 26
average time of
t based on her
ation is 72 days.
n is necessary
pulation mean?
the mean sale
a. Construct the 95% confidence interval for the mean debt
of all undergraduates from Connecticut.
The next two
examples
show ifhow
b. Use the 95% confidence
interval
to determine
the we
debtuse the four-step procedure for hypothesis testing
when we are testing the population mean μ and the population standard deviation σ is
of Connecticut undergraduates differs from that of New
unknown.
Hampshire undergraduates.
16.
Hourly_Wage. An economist wants to estimate
the mean hourly wage (in $) of all workers. She collects
9.10of the data
data on 50 hourly wageEXAMPLE
earners. A portion
In the introductory
isFIshown in
the accompanying
table. Assumecase
thatto
thethis chapter, the dean at a large university in California
LE
Study_Hours
wondersis if$6.students
at and
her university study less than the 1961 national average of
population standard deviation
Construct
hours perintervals
week. She
randomly
interpret 90% and 99%24
confidence
for the
mean selects 35 students and asks their average study
time per week (in hours). From their responses, she calculates a sample mean of
hourly wage of all workers.
16.3714 hours and a sample standard deviation of 7.2155 hours.
Hourly Wage
Guided Examples. These narrated video walkthroughs provide students with step-by-step guidelines
for solving selected exercises similar to those contained
in the text. The student is given personalized instruction
on how to solve a problem by applying the concepts presented in the chapter. The video shows the steps to take
to work through an exercise. Students can go through
each example multiple times if needed.
The Connect Student Resource page is the place for
students to access additional resources. The Student
Resource page offers students quick access to the recommended study tools, data files, and helpful tutorials
on statistical programs.
37.85
ESSENTIALS OF BuSIN
E S S S TAT I S T I C S
9.3
Hypothesis Test for the Population Mean When σ is unknown
ards as a con- 308
21.72
rage amount
⋮
ger’s, August
24.18
a sample of 100
viation is $500.
jag39519_ch09_292-327 308
08/21/18 06:11 PM
error?
17.
Highway_Speeds. A safety officer is concerned about
the population
speeds on a certain section of the New Jersey Turnpike. He
ard.
records the speeds of 40 cars on a Saturday afternoon. The
accompanying table shows a portion of the results. Assume
ean salary of
that the population standard deviation is 5 mph. Construct the
en by [$36,080,
95% confidence interval for the mean speed of all cars on that
sed for the
section of the turnpike. Are the safety officer’s concerns valid if
the speed limit is 55 mph? Explain.
ary for all
nalysis.
time (in
ant uses a
dence interval
eviation is
al Estimation
Highway Speeds
70
60
⋮
65
E S S E N T I A L S O F B u S I N E S S S TAT I S T I c S
xx E S S E N T I A L S
267
O F B usiness S tatistics WALKTHROUGH
08/22/18 07:00 PM
www.ebookslides.com
McGraw-Hill Customer Care
Contact Information
At McGraw-Hill, we understand that getting the most from new technology can be
challenging. That’s why our services don’t stop after you purchase our products. You
can e-mail our product specialists 24 hours a day to get product training online. Or you
can search our knowledge bank of frequently asked questions on our support website.
For customer support, call 800-331-5094 or visit www.mhhe.com/support. One of
our technical support analysts will be able to assist you in a timely fashion.
WALKTHROUGH E S S E N T I A L S O F B usiness S tatistics xxi
www.ebookslides.com
AC K N O W L E D G M E N T S
We would like to acknowledge the following people for providing useful comments and
suggestions for past and present editions of all aspects of Business Statistics.
John Affisco
Hofstra University
Mehdi Afiat
College of Southern Nevada
Mohammad Ahmadi
University of Tennessee—
Chattanooga
Sung Ahn
Washington State University
Mohammad Ahsanullah
Rider University
Imam Alam
University of Northern Iowa
Mostafa Aminzadeh
Towson University
Ardavan Asef-Vaziri
California State University
Antenah Ayanso
Brock University
Scott Bailey
Troy University
Jayanta Bandyopadhyay
Central Michigan University
Samir Barman
University of Oklahoma
Douglas Barrett
University of North Alabama
John Beyers
University of Maryland
Arnab Bisi
Purdue University—West
Lafayette
Gary Black
University of Southern
Indiana
Randy Boan
Aims Community College
Matthew Bognar
University of Iowa
Juan Cabrera
Ramapo College of New
Jersey
Scott Callan
Bentley University
Gregory Cameron
Brigham Young University
Kathleen Campbell
St. Joseph’s University
xxii
Alan Cannon
University of Texas—
Arlington
Michael Cervetti
University of Memphis
Samathy Chandrashekar
Salisbury University
Gary Huaite Chao
University of Pennsylvania—
Kutztown
Sangit Chatterjee
Northeastern University
Leida Chen
California Polytechnic State
University
Anna Chernobai
Syracuse University
Alan Chesen
Wright State University
Juyan Cho
Colorado State
University—Pueblo
Alan Chow
University of South Alabama
Bruce Christensen
Weber State University
Howard Clayton
Auburn University
Robert Collins
Marquette University
M. Halim Dalgin
Kutztown University
Tom Davis
University of Dayton
Matthew Dean
University of Maine
Jason Delaney
University of Arkansas—
Little Rock
Ferdinand DiFurio
Tennessee Tech University
Matt Dobra
UMUC
Luca Donno
University of Miami
Joan Donohue
University of South Carolina
David Doorn
University of Minnesota
James Dunne
University of Dayton
Mike Easley
University of New Orleans
Erick Elder
University of Arkansas—
Little Rock
Ashraf ElHoubi
Lamar University
Roman Erenshteyn
Goldey-Beacom College
Grace Esimai
University of
Texas—Arlington
Soheila Fardanesh
Towson University
Carol Flannery
University of Texas—Dallas
Sydney Fletcher
Mississippi Gulf Coast
Community College
Andrew Flight
Portland State University
Samuel Frame
Cal Poly San Luis Obispo
Priya Francisco
Purdue University
Vickie Fry
Westmoreland County
Community College
Ed Gallo
Sinclair Community
College
Glenn Gilbreath
Virginia Commonwealth
University
Robert Gillette
University of Kentucky
Xiaoning Gilliam
Texas Tech University
Mark Gius
Quinnipiac University
Malcolm Gold
Saint Mary’s University of
Minnesota
Michael Gordinier
Washington University
www.ebookslides.com
Deborah Gougeon
University of Scranton
Don Gren
Salt Lake Community
College
Thomas G. Groleau
Carthage College
Babita Gupta
CSU Monterey Bay
Robert Hammond
North Carolina State
University
Jim Han
Florida Atlantic University
Elizabeth Haran
Salem State University
Jack Harshbarger
Montreat College
Edward Hartono
University of
Alabama—Huntsville
Clifford Hawley
West Virginia University
Santhi Heejebu
Cornell College
Paul Hong
University of Toledo
Ping-Hung Hsieh
Oregon State University
Marc Isaacson
Augsburg College
Mohammad Jamal
Northern Virginia
Community College
Robin James
Harper College
Molly Jensen
University of Arkansas
Craig Johnson
Brigham Young
University—Idaho
Janine Sanders Jones
University of St. Thomas
Vivian Jones
Bethune—Cookman
University
Jerzy Kamburowski
University of Toledo
Howard Kaplon
Towson University
Krishna Kasibhatla
North Carolina A&T State
University
Mohammad Kazemi
University of North
Carolina—Charlotte
Ken Kelley
University of Notre Dame
Lara Khansa
Virginia Tech
Esther C. Klein
St. Francis College
Ronald Klimberg
St. Joseph’s University
Andrew Koch
James Madison University
Subhash Kochar
Portland State University
Brandon Koford
Weber University
Randy Kolb
St. Cloud State University
Vadim Kutsyy
San Jose State University
Francis Laatsch
University of Southern
Mississippi
David Larson
University of South Alabama
John Lawrence
California State
University—Fullerton
Shari Lawrence
Nicholls State University
Radu Lazar
University of Maryland
David Leupp
University of Colorado—
Colorado Springs
Carel Ligeon
Auburn
University—Montgomery
Carin Lightner
North Carolina A&T State
University
Constance Lightner
Fayetteville State University
Scott Lindsey
Dixie State College of Utah
Ken Linna
Auburn
University—Montgomery
Andy Litteral
University of Richmond
Jun Liu
Georgia Southern
University
Chung-Ping Loh
University of North Florida
Salvador Lopez
University of West Georgia
John Loucks
St. Edward’s University
Cecilia Maldonado
Georgia Southwestern State
University
Farooq Malik
University of Southern
Mississippi
Ken Mayer
University of
Nebraska—Omaha
Bradley McDonald
Northern Illinois University
Elaine McGivern
Duquesne University
John McKenzie
Babson University
Norbert Michel
Nicholls State University
John Miller
Sam Houston State
University
Virginia Miori
St. Joseph’s University
Prakash Mirchandani
University of Pittsburgh
Jason Molitierno
Sacred Heart University
Elizabeth Moliski
University of Texas—Austin
Joseph Mollick
Texas A&M University—
Corpus Christi
James Moran
Oregon State University
Khosrow Moshirvaziri
California State University—
Long Beach
Tariq Mughal
University of Utah
Patricia Mullins
University of
Wisconsin—Madison
Kusum Mundra
Rutgers University—Newark
Anthony Narsing
Macon State College
Robert Nauss
University of Missouri—St.
Louis
Satish Nayak
University of Missouri—St.
Louis
Thang Nguyen
California State University—
Long Beach
Mohammad Oskoorouchi
California State University—
San Marcos
Barb Osyk
University of Akron
Bhavik Pathak
Indiana University South
Bend
Scott Paulsen
Illinois Central College
James Payne
Calhoun Community
College
Norman Pence
Metropolitan State College
of Denver
ACKNOWLEDGMENTS E S S E N T I A L S O F B usiness S tatistics xxiii
www.ebookslides.com
Dane Peterson
Missouri State University
Joseph Petry
University of
Illinois—Urbana/Champaign
Courtney Pham
Missouri State University
Martha Pilcher
University of Washington
Cathy Poliak
University of
Wisconsin—Milwaukee
Simcha Pollack
St. John’s University
Hamid Pourmohammadi
California State University—
Dominguez Hills
Tammy Prater
Alabama State University
Zbigniew H. Przasnyski
Loyola Marymount
University
Manying Qiu
Virginia State University
Troy Quast
Sam Houston State
University
Michael Racer
University of Memphis
Srikant Raghavan
Lawrence Technological
University
Bharatendra Rai
University of
Massachusetts—
Dartmouth
Michael Aaron Ratajczyk
Saint Mary’s University of
Minnesota
Tony Ratcliffe
James Madison University
David Ravetch
University of California
Bruce Reinig
San Diego State University
Darlene Riedemann
Eastern Illinois University
David Roach
Arkansas Tech University
Carolyn Rochelle
East Tennessee State
University
Alfredo Romero
North Carolina A&T State
University
Ann Rothermel
University of Akron
Jeff Rummel
Emory University
Deborah Rumsey
The Ohio State University
xxiv E S S E N T I A L S
Stephen Russell
Weber State University
William Rybolt
Babson College
Fati Salimian
Salisbury University
Fatollah Salimian
Perdue School of Business
Samuel Sarri
College of Southern Nevada
Jim Schmidt
University of
Nebraska—Lincoln
Patrick Scholten
Bentley University
Bonnie Schroeder
Ohio State University
Pali Sen
University of North Florida
Donald Sexton
Columbia University
Vijay Shah
West Virginia
University—Parkersburg
Dmitriy Shaltayev
Christopher Newport
University
Soheil Sibdari
University of
Massachusetts—
Dartmouth
Prodosh Simlai
University of North Dakota
Harvey Singer
George Mason University
Harry Sink
North Carolina A&T State
University
Don Skousen
Salt Lake Community
College
Robert Smidt
California Polytechnic State
University
Gary Smith
Florida State University
Antoinette Somers
Wayne State University
Ryan Songstad
Augustana College
Erland Sorensen
Bentley University
Arun Kumar Srinivasan
Indiana
University—Southeast
Scott Stevens
James Madison University
Alicia Strandberg
Temple University
Linda Sturges
Suny Maritime College
O F B usiness S tatistics ACKNOWLEDGMENTS
Wendi Sun
Rockland Trust
Bedassa Tadesse
University of Minnesota
Pandu Tadikamalta
University of Pittsburgh
Roberto Duncan Tarabay
University of
Wisconsin—Madison
Faye Teer
James Madison University
Deborah Tesch
Xavier University
Patrick Thompson
University of Florida
Satish Thosar
University of Redlands
Ricardo Tovar-Silos
Lamar University
Quoc Hung Tran
Bridgewater State University
Elzbieta Trybus
California State
University—Northridge
Fan Tseng
University of
Alabama—Huntsville
Silvanus Udoka
North Carolina A&T State
University
Shawn Ulrick
Georgetown University
Bulent Uyar
University of Northern Iowa
Ahmad Vakil
Tobin College of Business
Tim Vaughan
University of Wisconsin—
Eau Claire
Raja Velu
Syracuse University
Holly Verhasselt
University of
Houston—Victoria
Zhaowei Wang
Citizens Bank
Rachel Webb
Portland State University
Kyle Wells
Dixie State College
Alan Wheeler
University of Missouri—
St. Louis
Mary Whiteside
University of Texas—
Arlington
Blake Whitten
University of Iowa
Rick Wing
San Francisco
State University