Tài liệu Advances in Database Technology- P15 docx
Bạn đang xem bản rút gọn của tài liệu. Xem và tải ngay bản đầy đủ của tài liệu tại đây (1.01 MB, 50 trang )
682
K. Kailing et al.
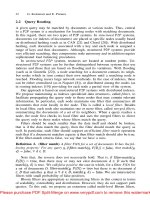
Fig. 5. Folding techniques for histograms: The technique of Papadopoulos and Manolopoulos
(top) and the modulo folding technique (bottom).
Theorem 2. For any two trees and the
of the leaf distance histograms
is a lower bound of the degree-2 edit distance of
and
Proof. Analogously to the proof of theorem 1.
Theorem 1 and 2 also allow us to use leaf distance histograms as a filter for the
weighted edit and weighted degree-2 edit distance. This statement is justified by the fol-
lowing considerations. As shown above, the of two leaf distance histograms
gives a lower bound for the insert and delete operations that are necessary to transform
the two corresponding trees into each other. This fact also holds for weighted relabeling
operations, as weights do not have any influence on the necessary structural modifica-
tions. But even when insert/delete operations are weighted, our filter can be used as long
as their exists a smallest possible weight for an insert or delete operation. In this
case, the term is a lower bound for the weighted edit and
degree-2 edit distance between the trees and Since we assume metric properties as
well as the symmetry of insertions and deletions for the distance, the triangle inequal-
ity guarantees the existence of such a minimum weight. Otherwise, any relabeling of a
node would be performed cheaper by a deletion and a corresponding insertion operation.
Moreover, structural differences of objects would be reflected only weakly if structural
changes are not weighted properly.
Histogram folding. Another property of leaf distance histograms is that their size
is unbounded as long as the height of the trees in the database is also unbounded.
This problem arises for several feature vector types, including the degree histograms
presented in section 4.2. Papadopoulos and Manolopoulos [10] address this problem by
folding the histograms into vectors with fixed dimension. This is done in a piecewise
grouping process. For example, when a 5-dimensional feature vector is desired, the
first one fifth of the histogram bins is summed up and the result is used as the first
component of the feature vector. This is done analogously for the rest of the histogram
bins. The above approach could also be used for leaf distance histograms, but it has
the disadvantage that the maximal height of all trees in the database has to be known
in advance. For dynamic data sets, this precondition cannot be fulfilled. Therefore, we
Please purchase PDF Split-Merge on www.verypdf.com to remove this watermark.
Efficient Similarity Search for Hierarchical Data in Large Databases
683
propose a different technique that yields fixed-size n-dimensional histograms by adding
up the values of certain entries in the leaf distance histogram. Instead of summing up
adjacent bins in the histogram, we add up those with the same index modulo n, as
depicted in figure 5. This way, histograms of distinct length can be compared, and there
is no bound for the length of the original histograms.
Definition 7 (folded histogram). A folded histogram of a histogram for a
given parameter is a vector of size where the value of any bin is
the sum of all bins
in with mod i.e.
The following theorem justifies to use folded histograms in a multi-step query pro-
cessing architecture.
Theorem 3. For any two histograms and and any parameter the
of the folded histograms of
and is a lower bound for the
of
and
Proof. Let be the length of and If necessary, and
are extended with bins containing 0 until and Then the following
holds:
4.2
Filtering Based on Degree of Nodes
The degrees of the nodes are another structural property of trees which can be used
as a filter for the edit distances. Again, a simple filter can be obtained by using the
Please purchase PDF Split-Merge on www.verypdf.com to remove this watermark.
684
K. Kailing et al.
maximal degree of all nodes in a tree denoted by as a single feature.
The difference between the maximal degrees of two trees is an obvious lower bound for
the edit distance as well as for the degree-2 edit distance. As before, this single-valued
filter is very coarse and using a degree histogram clearly increases the selectivity.
Definition 8 (degree histogram). The degree histogram
of a tree is a vector of
length where the value of any bin is the number of
nodes that share the degree i.e.
Theorem 4. For any two trees and the of the degree histograms
divided by three is a lower bound of the edit distance of
and
Proof. Given two arbitrary trees and let us consider an edit sequence
that transforms into We proceed by induction over the length of the
sequence If i.e. and the values of
and of both are equal to zero. For let us assume that the lower-bounding
property already holds for and i.e.
When extending the sequence by to S, the right hand side of the
inequality is increased by The situation on the left hand side is as follows.
The edit step may be a relabeling, an insert or a delete operation. Obviously, for a
relabeling, the degree histogram does not change, i.e.
and the inequality holds.
The insertion of a single node affects the histogram and the of the
histograms in the following way:
1.
2.
3.
The inserted node causes an increase in the bin of degree. That may change
the by at most one.
The degree of parent node may change. In the worst case this affects two bins.
The bin of former degree is decreased by one while the bin of its new degree
is increased by one. Therefore, the may additionally be changed by at
most two.
No other nodes are affected.
From the above three points it follows that the of the two histograms
and changes by at most three. Therefore, the following holds:
Please purchase PDF Split-Merge on www.verypdf.com to remove this watermark.
Efficient Similarity Search for Hierarchical Data in Large Databases
685
As the above considerations also hold for the degree-2 edit distance, theorem 4 holds
analogously for this similarity measure.
4.3
Filtering Based on Node Labels
Apart from the structure of the trees, the content features, expressed through node labels,
have an impact on the similarity of attributed trees. The node labels can be used to define
a filter function. To be useful in our filter-refinement architecture, this filter method has
to deliver a lower bound for the edit cost when transforming two trees into each other.
The difference between the distribution of the values within a tree and the distribution
of the values in another tree can be used to develop a lower-bounding filter. To ensure
efficient evaluation of the filter, the distribution of those values has to be approximated
for the filter step.
One way to approximate the distribution of values is to use histograms. In this case,
an histogram is derived by dividing the range of the node label into bins.
Then, each bin is assigned the number of nodes in the tree whose value is in the range
of the bin. To estimate the edit distance or the degree-2 edit distance between two trees,
half of the of their corresponding label histograms is appropriate. A single
insert or delete operation changes exactly one bin of such a label histogram, a single
relabeling operation can influence at most two histogram bins. If a node is assigned to
a new bin after relabeling, the entry in the old bin is decreased by one and the entry in
the new bin is increased by one (cf. figure 6). Otherwise, a relabeling does not change
the histogram. This method also works for weighted variants of the edit distance and the
degree-2 edit distance as long as there is a minimal weight for a relabeling operation. In
this case, the calculated filter value has to be multiplied by this minimal weight in order
to gain a lower-bounding filter.
This histogram approach applies to discrete label distributions very well. However,
for continuous label spaces, the use of a continuous weight function which may become
arbitrarily small, can be reasonable. In this case, a discrete histogram approach can not
be used. An example for such a weight function is the Euclidean distance in the color
space, assuming trees where the node labels are colors. Here, the cost for changing a
color value is proportional to the Euclidean distance between the original and the target
color. As this distance can be infinitely small, it is impossible to estimate the relabeling
cost based on a label histogram as in the above cases.
Fig. 6. A single relabeling operation may result in a label histogram distance of two.
Please purchase PDF Split-Merge on www.verypdf.com to remove this watermark.
686
K. Kailing et al.
Fig. 7. Filtering for continuous weight functions.
More formally, when using the term ‘continuous weight function’ we mean that the
cost for changing a node label from value to value is proportional to
Let be the maximal possible difference between two attribute values. Then
has to be normalized to [0,1] by dividing it through assuming that
the maximal cost for a single insertion, deletion or relabeling is one. To develop a filter
method for attributes with such a weight function, we exploit the following property of
the edit distance measure. The cost-minimal edit sequence between two trees removes
the difference between the distributions of attribute values of those two trees. It does not
matter whether this is achieved through relabelings, insertions or deletions.
For our filter function we define the following feature value for a tree
Here is the attribute value of the node in and is the size of tree The absolute
difference between two such feature values is an obvious lower bound for the difference
between the distribution of attribute values of the corresponding trees. Consequently,
we
use
as a filter function for continuous label spaces, see figure 7 for an illustration. Once
more, the above considerations also hold for the degree-2 edit distance.
To simplify the presentation we assumed that a node label consists of just one single
attribute. But usually a node will carry several different attributes. If possible, the attribute
with the highest selectivity can be chosen for filtering. In practice, there is often no such
single attribute. In this case, filters for different attributes can be combined with the
technique described in the following section.
4.4
Combining Filter Methods
All of the above filters use a single feature of an attributed tree to approximate the edit
distance or degree-2 edit distance. As the filters are not equally selective in each situation,
we propose a method to combine several of the presented filters.
A very flexible way of combining different filters is to follow the inverted list ap-
proach, i.e. to apply the different filters independently from each other and then intersect
Please purchase PDF Split-Merge on www.verypdf.com to remove this watermark.
Efficient Similarity Search for Hierarchical Data in Large Databases
687
the resulting candidate sets. With this approach, separate index structures for the differ-
ent filters have to be maintained and for each query, a time-consuming intersection step
is necessary. To avoid those disadvantages, we concatenate the different filter histograms
and filter values for each object and use a combined distance function as a similarity
function.
Definition 9 (Combined distance function). Let be a set of distance functions
for trees. Then, the combined distance function is defined to be the maximum of the
component functions:
Theorem
5.
For every set of lower-bounding distance functions
i.e. for all trees and the combined distance function is
a lower bound of the edit distance function
Proof. For all trees and the following equivalences hold:
The final inequality represents the precondition.
Justified by theorem 5, we apply each separate filter function to its corresponding
component of the combined histogram. The combined distance function is derived from
the results of this step.
5
Experimental Evaluation
For our tests, we implemented a filter and refinement architecture according to the
optimal multi-step k-nearest-neighbor search approach as proposed in [16]. Naturally,
the positive effects which we show in the following experiments for k-nn-queries also
hold for range queries and for all data mining algorithms based on range queries or
k-nn-queries (e.g. clustering, k-nn-classification). As similarity measure for trees, we
implemented the degree-2 edit distance algorithm as presented in [14]. The filter his-
tograms were organized in an X-tree [17]. All algorithms were implemented in Java 1.4
and the experiments were run on a workstation with a Xeon 1,7 GHz processor and 2
GB main memory under Linux.
To show the efficiency of our approach, we chose two different applications, an
image database and a database of websites which are described in the following.
Please purchase PDF Split-Merge on www.verypdf.com to remove this watermark.
688
K. Kailing et al.
Fig. 8. Structural and content-based information of a picture represented as a tree.
5.1
Image Databases
As one example of tree structured objects we chose images, because for images, both,
content-based as well as structural information are important. Figure 8 gives an idea of
the two aspects which are present in a picture.
The images we used for our experiments were taken from three real-world databases:
a set of 705 black and white pictographs, a set of 8,536 commercially available color
images and a set of 43,000 color TV-Images. We extracted trees from those images in
a two-step process. First, the images were divided into segments of similar color by a
segmentation algorithm. In the second step, a tree was created from those segments by
iteratively applying a region-growing algorithm which merges neighboring segments if
their colors are similar. This is done until all segments are merged into a single node. As
a result, we obtain a set of labeled unordered trees where each node label describes the
color, size and horizontal as well as vertical extension of the associated segment. Table
1 shows some statistical information about the trees we generated.
For the first experiments, we used label histograms as described in section 4.3. To
derive a discrete label distribution, we reduced the number of different attribute values
to 16 different color values for each color channel and 4 different values each for size
and extensions. We used a relabeling function with a minimal weight of 0.5. Later on
we also show some experiments where we did not reduce the different attribute values
and used a continuous weight function for relabeling.
Comparison of our filter types. For our first experiment we used 10,000 TV-images. We
created 10-dimensional height and degree histograms and combined them as described in
section 4.4. We also built a 24-dimensional combined label histogram which considered
the color, size and extensions of all node labels (6 attributes with histograms of size 4).
Please purchase PDF Split-Merge on www.verypdf.com to remove this watermark.
Efficient Similarity Search for Hierarchical Data in Large Databases
689
Fig. 9. Runtime and number of candidates for k-nn-queries on 10,000 color TV-images.
Finally, the combination of this combined label histogram and a 4-dimensional height
histogram was taken as another filter criterion. Let us note, that the creation of the filter
X-trees took between 25 sec. for the height histogram and 62 sec. for the combined
height-label histogram.
We ran 70 k-nearest-neighbor queries (k = 1, 10, 100) for each of our filters. Figure
9 shows the selectivity of our filters, measured in the average number of candidates
with respect to the size of the data set. The figures show that filtering based solely on
structural (height or degree histogram) or content-based features (label histogram) is not
as effective as their combination. Figure 9 also shows that for this data the degree filter
is less selective than the height filter. The method which combines the filtering based on
the height of the nodes and on content features is most effective. Figure 5.1 additionally
depicts the average runtime of our filters compared to the sequential scan. As one can see,
we reduced the runtime by a factor of up to 5. Furthermore, the comparison of the two
diagrams in figure 9 shows that the runtime is dominated by the number of candidates,
whereas the additional overhead due to the filtering is negligible.
Influence of histogram size. In a next step we tested to what extent the size of the
histogram influences the size of the candidate set and the corresponding runtime. The
results for nearest neighbor queries on 10,000 color TV-images are shown in figure 10.
With increasing dimension, the number of candidates as well as the runtime decrease. The
comparison of the two diagrams in figure 10 shows that the runtime is again dominated
Fig. 10. Influence of dimensionality of histograms.
Please purchase PDF Split-Merge on www.verypdf.com to remove this watermark.
690
K. Kailing et al.
Fig. 11. Scalability versus size of data set.
by the number of candidates, while the additional overhead due to higher dimensional
histograms is negligible.
Scalability of filters versus size of data set. For this experiment we united all three
image data sets and chose three subsets of size 10,000, 25,000 and 50,000. On these
subsets we performed several representative 5-nn queries. Figure 11 shows that the
selectivity of our structural filters does not depend on the size of the data set.
Comparison of different filters for a continuous weight function. As mentioned
above, we also tested our filters when using a continuous weight function for relabeling.
For this experiment, we used the same 10,000 color images as in 5.1. Figure 12 shows
the results averaged over 200 k-nn queries. In this case, both the height histogram and
the label filter are very selective. Unfortunately, the combination of both does not further
enhance the runtime. While there is a slight decrease in the number of candidates, this
is used up by the additional overhead of evaluating two different filter criteria.
Comparison with a metric tree. In [18] other efficient access methods for similarity
search in metric spaces are presented. In order to support dynamic datasets, we use
the X-tree that can be updated at any time. Therefore, we chose to compare our filter
methods to the M-tree which analogously is a dynamic index structure for metric spaces.
Fig. 12. Runtime and number of candidates when using a continuous weight function.
Please purchase PDF Split-Merge on www.verypdf.com to remove this watermark.
Efficient Similarity Search for Hierarchical Data in Large Databases
691
Fig. 13.
Runtime and number of distance computations of filter methods compared to the M-Tree.
We implemented the M-tree
as
described in [ 19] by using the best split policy mentioned
there.
The creation of an M-tree for 1,000 tree objects already took more than one day, due
to the split policy that has quadratic time-complexity. The time for the creation of the
filter vectors, on the other hand, was in the range of a few seconds. As can be seen in
figure 13, the M-tree outperformed the sequential scan for small result sizes. However,
all of our filtering techniques significantly outperform the sequential scan and the M-tree
index for all result set sizes. This observation is mainly due to the fact that the filtering
techniques reduce the number of necessary distance calculations far more than the M-
tree index. This behavior results in speed-up factors between 2.5 and 6.2 compared to
the M-tree index and even higher factors compared to a simple sequential scan. This
way, our multi-step query processing architecture is a significant improvement over the
standard indexing approach.
5.2
Web Site Graphs
As demonstrated in [20], the degree-2 edit distance is well suitable for approximate
website matching. In website management it can be used for searching similar websites.
In [21] web site mining is described as a new way to spot competitors, customers and
suppliers in the world wide web.
By choosing the main page as the root, one can represent a website as a rooted,
labeled, unordered tree. Each node in the tree represents a webpage of the site and is
labeled with the URL of that page. All referenced pages are children of that node and
the borders of the website where chosen carefully. See figure 14 for an illustration.
Fig. 14. Part of a website tree.
Please purchase PDF Split-Merge on www.verypdf.com to remove this watermark.
692
K. Kailing et al.
Fig. 15. Average runtime and number of candidates for 5-nn queries.
For our experiment, we used a compressed form of the 207 web sites described in
[21], resulting in trees that have 67 nodes on the average. We ran 5-nn-queries on this
data. The results are shown in figure 15. We notice that even if the degree filter produces
a lot more candidates than the height filter, it results in a better run time. This is due to
the fact that it filters out those trees, where the computation of the degree-2 edit distance
is especially time-consuming. Using the combination of both histograms, the runtime is
reduced by a factor of 4.
6
Conclusions
In this paper, we presented a new approach for efficient similarity search in large
databases of tree structures. Based on the degree-2 edit distance as similarity measure,
we developed a multi-step query architecture for similarity search in tree structures. For
structural as well as for content-based features of unordered attributed trees, we sug-
gested several filter methods. These filter methods significantly reduce the number of
complex edit distance calculations necessary for a similarity search. The main idea be-
hind our filter methods is to approximate the distribution of structural and content-based
features within a tree by means of feature histograms. Furthermore, we proposed a new
technique for folding histograms and a new way to combine different filter methods in
order to improve the filter selectivity. We performed extensive experiments on two sets
of real data from the domains of image similarity and website mining. Our experiments
showed that filtering significantly accelerates the complex task of similarity search for
tree-structured objects. Moreover, it turned out that no single feature of a tree is sufficient
for effective filtering, but only the combination of structural and content-based filters
yields good results.
In our future work, we will explore how different weights for edit operations influence
the selectivity of our filter methods. Additionally, we intend to investigate other structural
features of trees for their appropriateness in the filter step. In a recent publication [5], an
edit distance for XML-documents has been proposed. An interesting question is, how
our architecture and filters can be applied to the problem of similarity search in large
databases of XML-documents.
Please purchase PDF Split-Merge on www.verypdf.com to remove this watermark.
Efficient Similarity Search for Hierarchical Data in Large Databases
693
References
1.
2.
3.
4.
5.
6.
7.
8.
9.
10.
11.
12.
13.
14.
15.
16.
17.
18.
19.
20.
21.
Jiang, T., Wang, L., Zhang, K.: Alignment of trees - an alternative to tree edit. Proc. Int. Conf.
on Combinatorial Pattern Matching (CPM), LNCS 807 (1994) 75–86
Selkow, S.: The tree-to-tree editing problem. Information Processing Letters 6 (1977) 576–
584
Zhang, K.: A constrained editing distance between unordered labeled trees. Algorithmica 15
(1996) 205–222
Wang, J.T.L., Zhang, K., Chang, G., Shasha, D.: Finding approximate pattersn in undirected
acyclic graphs. Pattern Recognition 35 (2002) 473–483
Nierman, A., Jagadish, H.V.: Evaluating structural similarity in XML documents. In: Proc.
5th Int. Workshop on the Web and Databases (WebDB 2002), Madison, Wisconsin, USA.
(2002) 61–66
Sebastian, T.B., Klein, P.N., Kimia, B.B.: Recognition of shapes by editing shock graphs.
In: Proc. 8th Int. Conf. on Computer Vision (ICCV’01), Vancouver, BC, Canada. Volume 1.
(2001) 755–762
Bunke, H., Shearer, K.: A graph distance metric based on the maximal common subgraph.
Pattern Recognition Letters 19 (1998) 255–259
Chartrand, G., Kubicki, G., Schultz, M.: Graph similarity and distance in graphs. Aequationes
Mathematicae 55 (1998) 129–145
Kubicka, E., Kubicki, G., Vakalis, I.: Using graph distance in object recognition. In: Proc.
ACM Computer Science Conference. (1990) 43–48
Papadopoulos, A., Manolopoulos,Y.: Structure-based similarity search with graph histograms.
In: Proc. DEXA/IWOSS Int. Workshop on Similarity Search. (1999) 174–178
Levenshtein, V.: Binary codes capable of correcting deletions, insertions and reversals. Soviet
Physics-Doklady 10 (1966) 707–710
Wagner, R.A., Fisher, M.J.: The string-to-string correction problem. Journal of the ACM 21
(1974) 168–173
Zhang, K., Statman, R., Shasha, D.: On the editing distance between unordered labeled trees.
Information Processing Letters 42 (1992) 133–139
Zhang, K., Wang, J., Shasha, D.: On the editing distance between undirected acyclic graphs.
International Journal of Foundations of Computer Science 7 (1996) 43–57
Agrawal, R., Faloutsos, C., Swami, A.N.: Efficient similarity search in sequence databases.
In: Proc. 4th Int. Conf. of Foundations of Data Organization and Algorithms (FODO). (1993)
69–84
Seidl, T., Kriegel, H.P.: Optimal multi-step k-nearest neighbor search. In Haas, L.M., Tiwary,
A., eds.: Proc. ACM SIGMOD Int. Conf. on Managment of Data, ACM Press (1998) 154–165
Berchtold, S., Keim, D., Kriegel, H.P.: The X-tree: An index structure for high-dimensional
data. In: 22nd Conference on Very Large Databases, Bombay, India (1996) 28–39
Chavez, E., Navarro, G., Baeza-Yates, R., Marroquin, J.: Searching in metric spaces. ACM
Computing Surveys 33 (2001) 273–321
Ciaccia, P., Patella, M., Zezula, P.: M-tree: An efficient access method for similarity search in
metric spaces. In: VLDB’97, Proc. 23rd Int. Conf. on Very Large Databases, August 25-29,
1997, Athens, Greece. (1997) 426–435
Wang, J., Zhang, K., Jeong, K., Shasha, D.: A system for approximate tree matching. IEEE
Transactions on Knowledge and Data Engineering 6 (1994) 559–571
Ester, M., Kriegel, H.P., Schubert, M.: Web site mining: A new way to spot competitors,
customers and suppliers in the world wide web. In: Proc. 8th Int. Conf on Knowledge
Discovery in Databases (SIGKDD’02), Edmonton, Alberta, Canada. (2002) 249–258
Please purchase PDF Split-Merge on www.verypdf.com to remove this watermark.
QuaSAQ: An Approach to Enabling End-to-End
QoS for Multimedia Databases
Yi-Cheng Tu, Sunil Prabhakar, Ahmed K. Elmagarmid, and Radu Sion
Purdue University, West Lafayette IN 47907, USA
Abstract. The paper discusses the design and prototype implementa-
tion of a QoS-aware multimedia database system. Recent research in
multimedia databases has devoted little attention to the aspect of the
integration of QoS support at the user level. Our proposed architec-
ture to enable end-to-end QoS control, the QoS-Aware Query Processor
(QuaSAQ), satisfies user specified quality requirements. The users need
not be aware of detailed low-level QoS parameters, but rather specifies
high-level, qualitative attributes. In addition to an overview of key re-
search issues in the design of QoS-aware databases, this paper presents
our proposed solutions, and system implementation details. An impor-
tant issue relates to the enumeration and evaluation of alternative plans
for servicing QoS-enhanced queries. This step follows the conventional
query execution which results in the identification of objects of interest
to the user. We propose a novel cost model for media delivery that ex-
plicitly takes the resource utilization of the plan and the current system
contention level into account. Experiments run on the QuaSAQ proto-
type show significantly improved QoS and system throughput.
1
Introduction
As compared to traditional applications, multimedia applications have special
requirements with respect to search and playback with satisfactory quality. The
problem of searching multimedia data has received significant attention from
researchers with the resulting development of content-based retrieval for multi-
media databases. The problem of efficient delivery and playback of such data
(especially video data), on the other hand, has not received the same level of
attention. From the point of view of multimedia DBMS design, one has to be
concerned about not only the correctness but also the quality of the query results.
The set of quality parameters that describes the temporal/spatial constraints of
media-related applications is called Quality of Service (QoS) [1]. Guaranteeing
QoS for the user requires an end-to-end solution – all the way from the retrieval
of data at the source to the playback of the data at the user.
In spite of the fact that research in multimedia databases has covered many
key issues such as data models, system architectures, query languages, algorithms
for effective data organization and retrieval [2], little effort has been devoted to
the aspect of the integration of QoS support. In the context of general multime-
dia system, research on QoS has concentrated on system and network support
E. Bertino et al. (Eds.): EDBT 2004, LNCS 2992, pp. 694–711, 2004.
© Springer-Verlag Berlin Heidelberg 2004
Please purchase PDF Split-Merge on www.verypdf.com to remove this watermark.
QuaSAQ: An Approach to Enabling End-to-End QoS
695
with little concern for QoS control on the higher (user, application) levels. High-
level QoS support is essential in any multimedia systems because the satisfaction
of human users is the primary concern in defining QoS [3]. Simply deploying a
multimedia DBMS on top of a QoS-provisioning system will not provide end-
to-end QoS. Moreover, such a solution is unable to exploit the application level
flexibility such as the user’s acceptable range of quality. For example, for a physi-
cian diagnosing a patient, the jitter-free playback of very high frame rate and
resolution video of the patient’s test data is critical; whereas a nurse accessing
the same data for organization purposes may not require the same high quality.
Such information is only available at the user or application levels.
We envision users such as medical professionals accessing these databases via
a simple user interface. In addition to specifying the multimedia items of interest
(directly or via content-based similarity to other items), the user specifies a set
of desired quality parameter bounds. The quality bounds could be specified
explicitly or automatically generated based upon the user’s profile. The user
should not need to be aware of detailed system QoS parameters but rather
specifies high-level qualitative attributes (e.g. “high resolution”, or “CD quality
audio”). Thus a QoS-enabled database will search for multimedia objects that
satisfy the content component of the query and at the same time can be delivered
to the user with the desired level of quality.
In this paper we discuss the design and prototype implementation of our
QoS-aware multimedia DBMS. We describe the major challenges to enabling
end-to-end QoS, and present our proposed solutions to these problems. To the
best of our knowledge, this is the first prototype system that achieves end-to-
end QoS for multimedia databases. We present experimental results from our
prototype that establish the feasibility and advantages of such a system. Our
implementation builds upon the VDBMS prototype multimedia database system
developed by our group at Purdue University [4]. Among other enhancements,
QuaSAQ extends VDBMS to build a distributed QoS-aware multimedia DBMS
with multiple copies of storage/streaming manager.
To address the structure of a QoS-provisioning networked multimedia sys-
tem, four levels of QoS have been proposed: user QoS, application QoS, system
QoS, and network QoS [1,5]. We consider a series of QoS parameters in our
research as shown in Table 1. QoS guarantees for individual requests and the
overall system performance are in most cases two conflicting goals since the en-
tire QoS problem is caused by scarcity of resources. Most current research on
QoS fail to address the optimization of system performance. In this paper, we
highlight the key elements of our proposed approach to supporting end-to-end
QoS and achieving high performance in a multimedia database environment.
The approach is motivated by query processing and optimization techniques in
conventional distributed databases.
The key idea of our approach is to augment the query evaluation and opti-
mization modules of a distributed database management system (D-DBMS) to
directly take QoS into account. To incorporate QoS control into the database,
user-level QoS parameters are translated into application QoS and become an
Please purchase PDF Split-Merge on www.verypdf.com to remove this watermark.
696
Y.-C.
Tu et al.
augmented component of the query. For each raw media object, a number
of copies with different application QoS parameters are generated offline by
transcoding and these copies are replicated on the distributed servers. Based on
the information of data replication and runtime QoS adaptation options (e.g.
frame dropping), the query processor generates various plans for each query
and evaluates them according to a predefined cost model. The query evalua-
tion/optimization module also takes care of resource reservation to satisfy low-
level QoS. For this part, we propose the design of a unified API and implemen-
tation module that enables negotiation and control of the underlying system
and network QoS APIs, thereby providing a single entry-point to a multitude of
QoS layers (system and network). The major contributions of this paper are: 1)
We propose a query processing architecture for multimedia databases for han-
dling queries enhanced with QoS parameters; 2) We propose a cost model that
evaluates QoS-aware queries by their resource utilization with consideration of
current system status; 3) We implement the proposed query processor within a
multimedia DBMS and evaluate our design via experiments run on this proto-
type.
The paper is organized as follows: Section 2 deals with the main issues en-
countered in the process of designing and implementing the system. Section 3
presents the actual architecture of the Quality of Service Aware Query Proces-
sor (QuaSAQ). We also discuss details pertaining to the design of individual
components in the architecture. The prototype implementation of QuaSAQ is
detailed in Section 4. Section 5 presents the evaluation of the proposed QuaSAQ
architecture. In Section 6, we compare our work with relevant research efforts.
Section 7 concludes the paper.
2
Issues
Building a distributed multimedia DBMS requires a careful design of many com-
plex modules as well as effective interactions between these components. This
becomes further complicated if the system is to support non-trivial aspects such
as QoS. In order to extend the D-DBMS approach to address end-to-end QoS,
several important requirements have to be met. These include:
1.
Smart QoS-aware data replication algorithms have to be developed. Indi-
vidual multimedia objects need to be replicated on various nodes of the
Please purchase PDF Split-Merge on www.verypdf.com to remove this watermark.
QuaSAQ: An Approach to Enabling End-to-End QoS
697
2.
3.
4.
5.
database. Each replica may satisfy different application QoS in order to
closely meet the requirements of user inputs. The total number and choice
of QoS of pre-stored media replicas should reflect the access pattern of media
content. Therefore, dynamic online replication and migration has to be per-
formed to make the system converge to the current status of user requests.
Another concern in replication is the storage space.
Mapping of QoS parameters between different layers has to be achieved. First
of all, user-level qualitative QoS inputs (e.g. DVD-quality video) need to be
translated into application QoS (e.g. spatial resolution) since the underlying
query processor only understands the latter. One critical point here is that
the mapping from user QoS to application QoS highly depends on the user’s
personal preference. Resource consumption of query plans is essential for
cost estimation and query optimization in QoS-aware multimedia databases.
This requires mapping application QoS in our QoS-enhanced queries to QoS
parameters on the system and network level.
A model for the search space of possible execution plans. The search space
is of a very different structure from that of a traditional D-DBMS. In the
latter, the primary data model for search space comprises a query tree. The
query optimizer then explores the space using strategies such as dynamic
programming and randomized search to find the “best” plan according to a
cost model [6]. In our system, various components such as encryption, encod-
ing, and filtering must be individually considered in addition to the choice of
database server and physical media object. Depending on the system status,
any of the above components can be the dominant factor in terms of cost.
A cost estimation model is needed to evaluate the generated QoS-aware
plans. Unlike the static cost estimates in traditional D-DBMS, it is critical
that the costs under current system status (e.g. based upon current load
on a link) be factored into the choice of an acceptable plan. Furthermore,
the cost model in our query processor should also consider optimization
criteria other than the total time
1
, which is normally the only metric used in
D-DBMS. A very important optimization goal in multimedia applications is
system throughput. Resource consumption of each query has to be estimated
and controlled for the system to achieve maximum throughput and yet QoS
constraints of individual requests are not violated.
Once an acceptable quality plan has been chosen, the playback of the media
objects in accordance with the required quality has to be achieved. Gener-
ally, QoS control in multimedia systems are achieved in two ways: resource
reservation and adaptation [1]. Both strategies require deployment of a QoS-
aware resource management module, which is featured with admission con-
trol and reservation mechanisms. There may also be need for renegotiation
(adaptation) of the QoS constraints due to user actions during playback.
Our research addresses all above challenges. In the next section, we present a
framework for QoS provisioning in a distributed multimedia database environ-
ment with the focus on our solutions to items 3 and 4 listed above. For items
1
Sometimes response time is also used, as in distributed INGRES.
Please purchase PDF Split-Merge on www.verypdf.com to remove this watermark.
698
Y.-C.
Tu et al.
Fig. 1. QuaSAQ architecture
2 and 5, we concentrate on the implementation and evaluation of known ap-
proaches within the context of multimedia databases. Item1 will be covered in a
follow-up paper.
3
Quality-of-Service Aware Query Processor (QuaSAQ)
Figure 1 describes in detail the proposed architecture of our QoS-aware dis-
tributed multimedia DBMS, which we call Quality-of-Service Aware Query Pro-
cessor (QuaSAQ). In this section, we present detailed descriptions of the various
components of QuaSAQ.
3.1
Offline Components
The offline components of QuaSAQ provide a basis for the database adminis-
trators to accomplish QoS-related database maintenance. Two major activities,
offline replication and QoS sampling, are performed for each media object in-
serted into the database. As a result of those, relevant information such as the
quality, location and resource consumption pattern of each replica of the newly-
inserted object is fed into the Distributed Metadata Engine as metadata. Please
refer to [7] for more details of replication and QoS mapping in QuaSAQ.
Please purchase PDF Split-Merge on www.verypdf.com to remove this watermark.
QuaSAQ: An Approach to Enabling End-to-End QoS
699
3.2
QoP Browser
The QoP Browser is the user interface to the underlying storage, processing
and retrieval system. It enables certain QoP parameter control, generation of
QoS-aware queries, and execution of the resulting presentation plans. The main
entities of the QoP Browser include: The User Profile contains high-level QoP
parameter mappings to lower level QoS parameter settings as well as various user
related statistics acquired over time, enabling better renegotiation decisions in
case of resource failure. The Query Producer takes as input some user actions
(requests with QoP inputs) and the current settings from the user profile and
generates a query. As compared to those of traditional DBMS, the queries gener-
ated in QuaSAQ are enhanced with QoS requirements. We call them QoS-aware
queries. The Plan Executor is in charge of actually running the chosen plan.
It basically performs actual presentation, synchronization as well as runtime
maintenance of underlying QoS parameters.
Quality of Presentation. From a user’s perspective, QoS translates into the
more qualitative notion of Quality of Presentation (QoP). The user is not ex-
pected to understand low level quality parameters such as frame rates or packet
loss rate. Instead, the user specifies high-level qualitative parameters to the best
of his/her understanding of QoS. Some key QoP parameters that are often con-
sidered in multimedia systems include: spatial resolution, temporal resolution or
period, color depth, reliability, and audio quality. Before being integrated into a
database query, the QoP inputs are translated into application QoS based on the
information stored in the User Profile. For example, a user input of “VCD-like
spatial resolution” can be interpreted as a resolution range of 320×240 – 352×288
pixels. The application QoS parameters are quantitative and we achieve some
flexibility by allowing one QoP mapped to a range of QoS values. QoS require-
ments are allowed to be modified during media playback and a renegotiation is
expected. Another scenario for renegotiation is when the user-specified QoP is
rejected by the admission control module due to low resource availability. Under
such circumstances, a number of admittable alternative plans will be presented
as a “second chance” for the query to be serviced.
One important weakness of these qualitative formulations of QoP is their
lack of flexibility (i.e. failure to capture differences between users). For example,
when renegotiation has to be performed, one user may prefer reduction in the
temporal resolution while another user may prefer a reduction in the spatial
resolution. We remedy this by introducing a per-user weighting of the quality
parameters as part of the User Profile.
3.3
Distributed Metadata Engine
In a multimedia DBMS, operations such as content-based searching depend heav-
ily, if not exclusively, on the metadata of the media objects [2]. As mentioned
in Section 2, video objects are stored in several locations, each copy with dif-
ferent representation characteristics. This requires more items in the metadata
collection. Specifically, we require at least the following types of metadata for a
QoS-aware DBMS:
Please purchase PDF Split-Merge on www.verypdf.com to remove this watermark.
700
Y.-C. Tu et al.
Content Metadata: describe the content of objects to enable multimedia
query, search, and retrieval. In our system, a number of visual and seman-
tic descriptors such as shot detection, frame extraction, segmentation, and
camera motion are extracted.
Quality Metadata: describe the quality characteristics (in the form of appli-
cation level QoS) of physical media objects. For our QoS-aware DBMS, the
following parameters are kept as metadata for each video object: resolution,
color depth, frame rate, and file format.
Distribution Metadata: describe the physical locations (i.e. paths, servers,
proxies, etc.) of the media objects. It records the OIDs of objects and the
mapping between media content and media file.
QoS profile: describe the resource consumption in the delivery of individual
media objects. The data in QoS profiles is obtained via static QoS map-
ping performed by the QoS sampler. The QoS profiles are the basis for cost
estimation of QoS-aware query execution plans.
We distribute the metadata in various locations enabling ease of use and migra-
tion. Caching is used to accelerate non-local metadata accesses.
3.4
Quality Manager
The Quality Manager is the focal point of the entire system. It is heavily inte-
grated with the Composite QoS in order to enable reservation and negoti-
ation. It has the following main components:
Plan Generator. The Plan Generator is in charge of generating plans that
enable the execution of the query from the Query Producer. The Content Meta-
data is used to identify logical objects that satisfy the content component of
the query (e.g. videos with images of George Bush or Sunsets). A given logical
object may be replicated at multiple sites and further with different formats. For
example, a given video may be stored in different resolutions and color depth at
two different sites. The plan generator determines which of the alternatives can
be used to satisfy the request and also the necessary steps needed to present it
to the user.
The final execution of QoS-aware query plans can be viewed as a series of
server activities that may include retrieval, decoding, transcoding between dif-
ferent formats and/or qualities, and encryption. Therefore, the search space of
alternative QoS-aware plans consists of all possible combinations of media repos-
itories, target objects, and server activities mentioned above. We can model the
search space as a universe of disjoint sets. Each set represents a target media
object or a server activity whose possible choices serve as elements in the set.
Suppose we have such sets then an execution plan is an ordered
set satisfying the following conditions:
(1)
(2)
(3)
For any
with
and
we have
APIs
Please purchase PDF Split-Merge on www.verypdf.com to remove this watermark.
QuaSAQ: An Approach to Enabling End-to-End QoS
701
The semantics of the above conditions are: (1) The total number of compo-
nents in a plan cannot exceed the number of possible server activities; (2) All
components in a plan come from some disjoint set; and (3) No two components
in a plan come from the same set. The size of the search space is huge even
with the above restrictions. Suppose each set of server activity has elements,
the number of possible plans is Fortunately, there are also some other
system-specific rules that further reduce the number of alternative plans. One
salient rule is related to the order of server activities. For example, the first
server activity should always be the retrieval of a media object from a certain
site, all other activities such as transcoding, encryption have to follow the the
media retrieval in a plan. If the order of all server activity sets are fixed, the size
of search space decreases to
Fig. 2. Illustrative plan generation in QuaSAQ
Runtime QoS Evaluation and Plan Drop. The Plan Generator described
above does not check generated plans for any QoS constraints. We can perform
those verifications by applying a set of static and dynamic rules. First of all,
decisions can be made instantly based on QoS inputs in the query. For example,
we cannot retrieve a video with resolution lower than that required by the user.
Similarly, it makes no sense to transcode from low resolution to high resolution.
Therefore, QoS constraints help further reduce the size of search space by de-
creasing the appropriate set size In practice, can be regarded as a constant.
Some of the plans can be immediately dropped by the Plan Generator if their
costs are intolerably high. This requires QuaSAQ to be aware of some obvious
performance pitfalls. For example, encryption should always follow the frame
dropping since it is a waste of CPU cycles to encrypt the data in frames that
will be dropped. Once a suitable plan has been discovered, the Plan Generator
computes its resource requirements (in the form of a resource vector
)
and feeds
it to the next component down the processing pipe-line.
Please purchase PDF Split-Merge on www.verypdf.com to remove this watermark.