Tài liệu OCA: Oracle Database 11g Administrator Certified Associate Study Guide- P18 pdf
Bạn đang xem bản rút gọn của tài liệu. Xem và tải ngay bản đầy đủ của tài liệu tại đây (1.22 MB, 50 trang )
Proactive Database Maintenance
781
EXTSTAT
--------------------------------
SYS_STUZVS6GX30A0GN_5YRYSD2LPM
SQL>
SQL> exec dbms_stats.gather_table_stats(null, ‘customers’,
method_opt=>’for all columns size skewonly’);
PL/SQL procedure successfully completed.
SQL> select column_name, num_distinct, histogram
2 from user_tab_col_statistics
3* where table_name = ‘CUSTOMERS’
SQL> /
COLUMN_NAME NUM_DISTINCT HISTOGRAM
------------------------------ ------------ ---------------
CUST_NAME 47692 HEIGHT BALANCED
CUST_STATE 6 FREQUENCY
CUST_COUNTRY 3 FREQUENCY
SYS_STUZVS6GX30A0GN_5YRYSD2LPM 8 FREQUENCY
SQL> select * from customers where cust_country = ‘India’ and cust_state =
‘TN’;
-------------------------------------------------------------------------------
| Id | Operation | Name | Rows | Bytes | Cost (%CPU)| Time |
-------------------------------------------------------------------------------
| 0 | SELECT STATEMENT | | 86 | 2580 | 137 (1)| 00:00:02 |
|* 1 | TABLE ACCESS FULL| CUSTOMERS | 86 | 2580 | 137 (1)| 00:00:02 |
-------------------------------------------------------------------------------
Predicate Information (identified by operation id):
---------------------------------------------------
1 - filter(“CUST_STATE”=’TN’ AND “CUST_COUNTRY”=’India’)
As you can see in the example, before extended statistics were collected, the estimated
number of rows was 1447, whereas after the extended statistics collection, the number of
rows optimizer estimated to return is 86.
95127c14.indd 781 2/17/09 2:54:18 PM
Please purchase PDF Split-Merge on www.verypdf.com to remove this watermark.
782
Chapter 14
N
Maintaining the Database and Managing Performance
To drop the extend statistics, use the
DROP_EXTENDED_STATISTICS
procedure:
SQL> exec dbms_stats.drop_extended_stats(null,’CUSTOMERS’,
‘(CUST_COUNTRY, CUST_STATE)’);
PL/SQL procedure successfully completed.
SQL>
To define the extension and collect statistics in one step, you can do the following:
SQL> exec dbms_stats.gather_table_stats(null, ‘customers’,
method_opt=>’for all columns size skewonly
for columns (cust_country, cust_state)’);
PL/SQL procedure successfully completed.
SQL> select extension_name, extension from user_stat_extensions
2 where table_name = ‘CUSTOMERS’;
EXTENSION_NAME EXTENSION
------------------------------------ -----------------------------
SYS_STUZVS6GX30A0GN_5YRYSD2LPM (“CUST_COUNTRY”,”CUST_STATE”)
In the next section, you’ll learn to enable and disable the automatic statistics collection
as well as perform other AutoTask jobs.
Configuring Automated Maintenance Tasks Using EM
The following are three default automated maintenance tasks:
Gathering optimizer statistics
ÛN
Running the Segment Advisor
ÛN
Running the SQL Tuning Advisor
ÛN
You can also enable and disable the AutoTask jobs using EM Grid Control. On the
Server tab, choose Automated Maintenance Tasks under Oracle Scheduler. Figure 14.8
shows the Automated Maintenance Tasks screen.
By clicking the Configure button, you can enable or disable the default AutoTask jobs, as
well as adjust the days on which these tasks are run, as shown in Figure 14.9.
To learn more about Automated Maintenance Tasks and Oracle Scheduler,
read the “Oracle Database Administrator’s Guide 11g Release 1 (11.1) Part
Number B28310-04” Oracle documentation.
95127c14.indd 782 2/17/09 2:54:18 PM
Please purchase PDF Split-Merge on www.verypdf.com to remove this watermark.
Proactive Database Maintenance
783
Figure 14.8 Automated Maintenance Tasks screen
Figure 14.9 Configure Automated Maintenance Tasks screen
95127c14.indd 783 2/17/09 2:54:18 PM
Please purchase PDF Split-Merge on www.verypdf.com to remove this watermark.
784
Chapter 14
N
Maintaining the Database and Managing Performance
Gathering Performance Statistics
Oracle Database generates several performance statistics that are used for self-tuning purposes
and are available for administrators to better tune the database. Most of the performance
statistics information is available through
V$
dictionary views (also known as dynamic
performance views). The information in the
V$
views are not persistent; that is, informa-
tion is lost when the database is shut down. Automatic Workload Repository (AWR) saves
the performance information in system tables and is made available for analysis through
EM Database Control and other third-party tools. AWR information is persistent across
database shutdowns.
The AWR data is captured at a system or database level, and session-level information is
captured using another mechanism called the Active Session History (ASH). You will learn
about AWR and ASH in the following sections.
Using Automatic Workload Repository
Two background processes are responsible for collecting the performance statistics:
Memory Monitor (MMON) and Memory Monitor Light (MMNL). These processes work
together to collect performance statistics directly from the system global area (SGA). The
MMON process does most of the work by waking up every 60 minutes and gathering
statistical information from the data dictionary views, dynamic performance views, and
optimizer and then storing this information in the database. The tables that store these sta-
tistics are the Automatic Workload Repository. These tables are owned by the user
SYSMAN
and are stored in the
SYSAUX
tablespace.
To activate the AWR feature, you must set the pfile/spfile’s parameter
STATISTICS_LEVEL
to the appropriate value. The values assigned to this parameter determine the depth of the
statistics that the MMON process gathers. Table 14.3 shows the values that can be assigned
to the
STATISTICS_LEVEL
parameter.
table 14.3 Specifying Statistics Collection Levels
Collection Level Description
BASIC
Disables the AWR and most other diagnostic monitoring and advisory
activities. Few database statistics are gathered at each collection inter-
val when operating the instance in this mode.
TYPICAL
Activates the standard level of collection activity. This is the default
value for AWR and is appropriate for most environments.
ALL
Captures all the statistics gathered by the
TYPICAL
collection level, plus
the execution plans and timing information from the operating system.
95127c14.indd 784 2/17/09 2:54:18 PM
Please purchase PDF Split-Merge on www.verypdf.com to remove this watermark.
Proactive Database Maintenance
785
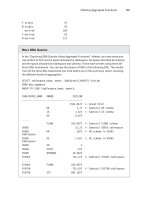
Once gathered, the statistics are stored in the AWR for a default duration of eight days.
However, you can modify both the frequency of the snapshots and the duration for which
they are saved in the AWR. One way to modify these intervals is by using the Oracle-supplied
package
DBMS_WORKLOAD_REPOSITORY
. The following SQL command shows the
DBMS_WORKLOAD_
REPOSITORY
package being used to change the AWR collection interval to 1 hour and the
retention period to 30 days:
SQL> execute dbms_workload_repository.modify_snapshot_settings
(interval=>60,retention=>43200);
PL/SQL procedure successfully completed.
The 30-day retention value shown here is expressed in minutes: 60 minutes
per hour × 24 hours per day × 30 days = 43,200 minutes.
You can also change the AWR collection interval, retention period, and collection depth
using EM Database Control. Choose the Server tab, and click Automatic Workload Reposi-
tory under Statistics Management (see Figure 14.10).
Figure 14.10 AWR statistics collection and retention using EM
Click the Edit button to change the settings, as shown in Figure 14.11.
95127c14.indd 785 2/17/09 2:54:18 PM
Please purchase PDF Split-Merge on www.verypdf.com to remove this watermark.
786
Chapter 14
N
Maintaining the Database and Managing Performance
Figure 14.11 Changing AWR statistics collection and retention using EM
In Figure 14.11, the retention period for statistics gathered by the MMON process is set
to 15 days, and statistics are collected every 30 minutes. You can also modify the depth at
which statistics are collected by the AWR by clicking the Collection Level link. Clicking
this link opens the Initialization Parameters screen where you can specify any of the three
predefined collection levels shown in Table 14.3. Figure 14.12 shows the AWR collection
level being changed from
TYPICAL
to
ALL
.
Figure 14.12 Changing the AWR statistics collection level
95127c14.indd 786 2/17/09 2:54:19 PM
Please purchase PDF Split-Merge on www.verypdf.com to remove this watermark.
Proactive Database Maintenance
787
Take care when specifying the AWR statistics collection interval. Gath-
ering snapshots too frequently requires additional space in the
SYSAUX
tablespace and adds database overhead each time the statistics are col-
lected. AWR does not use any space in the SGA.
Using EM Database Control, you can view the AWR report. Click the Run AWR Report but-
ton on the Automatic Workload Repository screen shown earlier in Figure 14.10. You can get
the same report using SQL*Plus by running the script
$ORACLE_HOME/rdbms/admin/awrrpt.sql
.
You can manage the AWR snapshots with SQL*Plus by utilizing the
DBMS_WORKLOAD_
REPOSITORY
package, as described in the next section.
Managing AWR Snapshots Manually
You can create AWR snapshots by using the
CREATE_SNAPSHOT
procedure, as shown here:
SQL> EXECUTE DBMS_WORKLOAD_REPOSITORY.CREATE_SNAPSHOT ();
PL/SQL procedure successfully completed.
SQL>
You can use the
DROP_SNAPSHOT_RANGE
procedure to delete a range of snapshots, and you
can query valid snapshot IDs from the
DBA_HIST_SNAPSHOT
view. The following example
shows how to query the
DBA_HIST_SNAPSHOT
view:
SQL> SELECT snap_id, begin_interval_time, end_interval_time
2 FROM dba_hist_snapshot
3 ORDER BY snap_id;
SNAP_ID BEGIN_INTERVAL_TIME END_INTERVAL_TIME
---------- ------------------------------ ------------------------------
1 24-SEP-08 02.06.11.000 AM 24-SEP-08 03.00.14.156 AM
2 25-SEP-08 12.06.26.000 AM 25-SEP-08 12.17.55.437 AM
3 25-SEP-08 12.17.55.437 AM 25-SEP-08 01.00.51.296 AM
4 25-SEP-08 01.00.51.296 AM 25-SEP-08 02.00.22.109 AM
… … …
27 27-SEP-08 07.03.17.375 PM 29-SEP-08 04.03.47.687 AM
28 29-SEP-08 04.03.47.687 AM 29-SEP-08 05.00.39.437 AM
29 29-SEP-08 05.00.39.437 AM 29-SEP-08 05.42.13.718 AM
To delete snapshots in the range 5–15, you can execute the following code. Note that the
ASH (discussed in the next section) data is also purged between the time periods specified
by the snapshot range.
SQL> BEGIN
2 DBMS_WORKLOAD_REPOSITORY.DROP_SNAPSHOT_RANGE (5, 15);
3 END;
4 /
PL/SQL procedure successfully completed.
SQL>
95127c14.indd 787 2/17/09 2:54:19 PM
Please purchase PDF Split-Merge on www.verypdf.com to remove this watermark.
788
Chapter 14
N
Maintaining the Database and Managing Performance
Once AWR snapshots are taken and stored in the database, the Automatic Database
Diagnostic feature uses the AWR data, as described in the “Automatic Database Diagnostic
Monitoring” section.
Active Session History
ASH is sampled data at specified intervals from the current state of all active sessions. The
data is collected in memory and can be accessed by
V$
views. The ASH information is also
written to a persistent store by the AWR snapshots.
The
V$ACTIVE_SESSION_HISTORY
provides the information collected by the ASH sampler.
The sessions are sampled every second and are stored in a circular buffer in SGA. Each
session is stored as a row. The current and historical information is available in the data
dictionary view
DBA_HIST_ACTIVE_SESS_HISTORY
. ASH information also includes the execu-
tion plan for each SQL captured.
Oracle provides a script to generate an ASH report,
$ORACLE_HOME/rdbms/admin/
ashrpt.sql
. You will be prompted for the report type (HTML or text), the begin time in
minutes prior to
SYSDATE
, the duration in minutes for the report, and a name for the report.
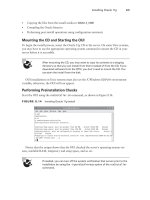
You can also use EM Database Control to generate the ASH report.
On the EM Database Control home screen, click the Performance tab, and click the Run
ASH Report button, as shown in Figure 14.13.
Figure 14.13 Performance screen in EM Database Control
95127c14.indd 788 2/17/09 2:54:19 PM
Please purchase PDF Split-Merge on www.verypdf.com to remove this watermark.
Proactive Database Maintenance
789
The screen shown in Figure 14.14 captures parameters for the ASH report. Specify the
start time and end time for the report, and click the Generate Report button.
Figure 14.14 ASH report parameters
Any session that is connected to the database and does not wait for a wait
event that belongs to the idle wait class is considered as an active session.
AWR Baselines
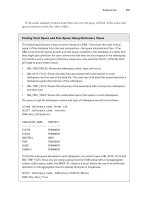
It is a good practice to baseline your database when everything is working as expected.
When things go south, you can use this baseline to compare system statistics and perfor-
mance metrics. AWR baselines contain performance data from a specific time period that
is preserved for comparison when problems occur. This baseline data is excluded from the
AWR purging process.
You can create two types of baselines: a single baseline and a repeating baseline. A single
baseline is captured at a single fixed-time interval, such as October 5 between 10 a.m. and
1 p.m. A repeating baseline repeats during a time interval for a specific period, such as
every Friday between 10 a.m. and 1 p.m. You can create and delete AWR baselines using
EM Database Control or SQL*Plus.
Managing AWR Baselines Using SQL*Plus
To create a single baseline, use the
CREATE_BASELINE
procedure as shown in the following
code. You can include the optional
expiration
parameter to automatically delete the snap-
shot after the specified number of days.
95127c14.indd 789 2/17/09 2:54:19 PM
Please purchase PDF Split-Merge on www.verypdf.com to remove this watermark.
790
Chapter 14
N
Maintaining the Database and Managing Performance
SQL> BEGIN
2 DBMS_WORKLOAD_REPOSITORY.CREATE_BASELINE(
3 start_snap_id => 27,
4 end_snap_id => 29,
5 baseline_name => ‘OCP Example’,
6 expiration => 21);
7 END;
SQL> /
PL/SQL procedure successfully completed.
SQL>
To drop a baseline, use the
DROP_BASELINE
procedure as shown in the following code.
The
cascade
parameter specifies that only the baseline should be dropped, not the snap-
shots associated with the baseline.
SQL> BEGIN
2 DBMS_WORKLOAD_REPOSITORY.DROP_BASELINE(
3 baseline_name => ‘OCP Example’,
4 cascade => FALSE);
5 END;
SQL> /
PL/SQL procedure successfully completed.
SQL>
You can create a baseline for the future date and time. These are called baseline templates.
The following code creates a baseline template:
SQL> BEGIN
2 DBMS_WORKLOAD_REPOSITORY.CREATE_BASELINE_TEMPLATE(
3 start_time => TO_DATE(‘01-JAN-09 05.00.00’,’DD-MON-YY HH.MI.SS’),
4 end_time => TO_DATE(‘01-JAN-09 08.00.00’,’DD-MON-YY HH.MI.SS’),
5 baseline_name => ‘baseline_090101’,
6 template_name => ‘template_090101’,
7 expiration => 21);
8 END;
SQL> /
PL/SQL procedure successfully completed.
SQL>
AWR baselines and baseline templates are never dropped automatically
(or purged) from the database unless explicitly dropped by the DBA or the
expiration period ends.
Managing AWR Baselines Using EM Database Control
Using EM Database Control to create, rename, and drop AWR baselines is easier than
using SQL*Plus and error-free. From the database home page, click the Server tab (shown
95127c14.indd 790 2/17/09 2:54:19 PM
Please purchase PDF Split-Merge on www.verypdf.com to remove this watermark.
Proactive Database Maintenance
791
earlier in Figure 14.1). Click the AWR Baselines link under Statistics Management. The
current baselines are displayed, as shown in Figure 14.15.
Figure 14.15 AWR Baselines screen
Click the Create button to create a new baseline. You will be presented with the option
to create a single baseline or a repeating baseline. If you choose a single baseline, you will
be presented with the screen shown in Figure 14.16. Enter the name of the baseline. You
can specify the snapshots to include in the baseline by using the snapshot IDs or using a
time range.
Figure 14.16 AWR Create Single Baseline screen
95127c14.indd 791 2/17/09 2:54:20 PM
Please purchase PDF Split-Merge on www.verypdf.com to remove this watermark.
792
Chapter 14
N
Maintaining the Database and Managing Performance
If you choose to create a repeating baseline, you’ll see the screen shown in Figure 14.17.
Enter a baseline name, and specify the frequency.
Figure 14.17 AWR Create Repeating Baseline screen
You can drop a baseline by choosing the baseline and clicking the Delete button on the
AWR Baselines screen (Figure 14.15).
Automatic Database Diagnostic Monitoring
Following each AWR statistics-collection process, the Automated Database Diagnostic
Monitoring (ADDM) feature automatically analyzes the gathered statistics and compares
them to the statistics gathered by the previous two AWR snapshots. By comparing the cur-
rent statistics to these two previous snapshots, the ADDM can easily identify potential
database problems such as these:
CPU and I/O bottlenecks
ÛN
Resource-intensive SQL or PL/SQL or Java execution
ÛN
Lock contention
ÛN
Utilization of Oracle’s memory structures within the SGA
ÛN
RAC-specific issues
ÛN
Issues with Oracle Net configuration
ÛN
Data-concurrency issues
ÛN
95127c14.indd 792 2/17/09 2:54:20 PM
Please purchase PDF Split-Merge on www.verypdf.com to remove this watermark.
Proactive Database Maintenance
793
Based on these findings, the ADDM may recommend possible remedies. The goal of
these recommendations is to minimize DB Time. DB Time is composed of two types of
time measures for nonidle database users: CPU time and wait time. This information is
stored as the cumulative time that all database users have spent either using CPU resources
or waiting for access to resources such as CPU, I/O, or Oracle’s memory structures. High
or increasing values for DB Time indicate that users are requesting increasingly more server
resources and may also be experiencing waits for those resources, which can lead to less
than optimal performance. In this way, minimizing DB Time is a much better way to mea-
sure overall database performance than Oracle’s old ratio-based tuning methodologies.
DB Time is calculated by combining all the times from all nonidle user ses-
sions into one number. Therefore, it is possible for the DB Time value to be
larger than the total time that the instance has been running.
Once ADDM completes its comparison of the newly collected statistics to the previously
collected statistics, the results are stored in the AWR. You can use these statistics to establish
baselines against which future performance will be compared, and you can use deviations
from these baseline measures to identify areas that need attention. In this manner, ADDM
allows you to not only better detect and alert yourself to potential management and per-
formance problems in the database but also allows you to automatically take corrective
actions to rectify those problems quickly and with little or no manual intervention.
The following sections introduce the interfaces, features, and functionality of ADDM
and explain how you can use this utility to monitor and manage database storage, security,
and performance. We’ll begin by examining the EM Database Control tools you can use to
view the results of ADDM analysis.
Using EM Database Control to View ADDM Analysis
EM Database Control graphically displays the results of the ADDM analysis on several
screens, including the following:
The Performance Findings link under the Diagnostic Summary section of the EM
ÛN
Database Control main screen
The Performance tab of the EM Database Control main screen
ÛN
The ADDM screen located by clicking the Advisor Central link at the bottom of the
ÛN
EM Database Control main screen
You’ll see sample output from each of the EM Database Control screens in the following
sections.
The EM Database Control Performance Findings Link
The EM Database Control home screen contains a section called Diagnostic Summary. One
of the links under this section is ADDM Findings. Figure 14.18 shows this section.
95127c14.indd 793 2/17/09 2:54:20 PM
Please purchase PDF Split-Merge on www.verypdf.com to remove this watermark.
794
Chapter 14
N
Maintaining the Database and Managing Performance
Figure 14.18 The Diagnostic Summary section of the EM Database Control home
screen
The output in Figure 14.18 shows that ADDM discovered four performance-related
findings. Clicking the link for these four performance findings displays the ADDM sum-
mary screen, at the bottom of which is the Performance Analysis section, as shown in
Figure 14.19.
The Findings section on this screen shows the ADDM analysis and the recommendation
to resolve the issue.
Figure 14.19 ADDM summary screen
95127c14.indd 794 2/17/09 2:54:20 PM
Please purchase PDF Split-Merge on www.verypdf.com to remove this watermark.
Proactive Database Maintenance
795
The EM Database Control Performance Tab
You can also click the Performance tab on the EM Database Control main screen to view
performance data collected by AWR and analyzed by ADDM. You can click the Run ADDM
Now button to take an AWR snapshot and perform ADDM analysis. Figure 14.20 shows
the Performance tab of EM Database Control.
Figure 14.20 EM Database Control Performance tab
Using Active Sessions of the Performance tab, you can drill down into detailed informa-
tion that has been identified as having an impact on performance. Click the Scheduler link,
which will take you to the screen shown in Figure 14.21.
95127c14.indd 795 2/17/09 2:54:20 PM
Please purchase PDF Split-Merge on www.verypdf.com to remove this watermark.
796
Chapter 14
N
Maintaining the Database and Managing Performance
Figure 14.21 Detailed performance information
The Advisor Central Screen
The Advisor Central screen also contains ADDM findings. The link for the Advisor Central
screen is at the bottom of the EM Database Control home screen. Click this link to display
the Advisor Central screen, shown in Figure 14.22.
Click the ADDM link in the Advisors section of this screen to display a graph that
shows all the recent AWR snapshots taken by the MMON process.
As stated earlier, the ADDM automatically compares the most recent AWR snapshot
with the last two AWR snapshots when formulating its recommendations. However, you can
use this Create ADDM Task screen to manually select any two AWR snapshot times and
formulate ADDM recommendations for activity that occurred between those two points in
time. To start this process, click the Period Start Time radio button, and then select a start
date and time by clicking the point in the graph’s timeline that corresponds to the beginning
period that you want to use. Repeat this process to specify the end-process timestamp.
You can also manually perform an ADDM analysis without EM Database
Control by using the
addmrpt.sql
script located in the
$ORACLE_HOME/
rdbms/admin
directory.
95127c14.indd 796 2/17/09 2:54:20 PM
Please purchase PDF Split-Merge on www.verypdf.com to remove this watermark.
Proactive Database Maintenance
797
Figure 14.22 The Advisor Central screen
You can use the
DBMS_ADDM
package to manually analyze AWR snapshots. Table 14.4 shows
some of the subprograms in
DBMS_ADDM
that can be used to manually manage ADDM analysis.
table 14.4 Partial List of
DBMS_ADDM
Subprograms
Procedure Name Description
ANALYZE_DB
Creates an ADDM analysis by specifying the begin and
end AWR snapshot IDs
DELETE
Deletes an ADDM task
INSERT_FINDING_DIRECTIVE
Excludes certain findings from ADDM reporting
INSERT_SEGMENT_DIRECTIVE
Excludes a certain schema, object, or segment from ADDM
reporting (do not run Segment Advisor on these segments)
INSERT_SQL_DIRECTIVE
Excludes certain SQL from ADDM reporting
95127c14.indd 797 2/17/09 2:54:20 PM
Please purchase PDF Split-Merge on www.verypdf.com to remove this watermark.
798
Chapter 14
N
Maintaining the Database and Managing Performance
The
DBA_ADVISOR_FINDINGS
,
DBA_ADVISOR_RECOMMENDATIONS
, and
DBA_
ADVISOR_ACTIONS
dictionary views have a column named
FILTERED
. If the
value for this column is
Y
, the row in the view is filtered by a directive and
is not reported.
Although using EM Database Control to create and view ADDM results is by far the
simplest way to review ADDM recommendations, you can also query the ADDM data
dictionary views directly. I’ll discuss some of these data dictionary views in the following
section.
Using Data Dictionary Views to View ADDM Analysis
You can use more than 20 data dictionary views to examine the results of ADDM’s activi-
ties. Table 14.5 describes five commonly used ADDM views that store the recommendation
information you saw in the EM Database Control pages.
table 14.5 ADDM Data Dictionary Views
View Name Description
DBA_ADDM_TASKS
Displays executed advisor tasks
DBA_ADDM_FINDINGS
Describes the findings identified by the ADDM analysis
DBA_ADVISOR_OBJECTS
Describes the objects that are referenced in the ADDM
findings and recommendations
DBA_ADVISOR_RECOMMENDATIONS
Describes the recommendations made based on ADDM
findings
DBA_ADVISOR_RATIONALE
Describes the rationale behind each ADDM finding
DBA_ADDM_TASKS
,
DBA_ADDM_INSTANCES
, and
DBA_ADDM_FINDINGS
are exten-
sions of the corresponding
DBA_ADVISOR_
views but are specific for ADDM
tasks and findings.
The following SQL statement shows a sample query on the
DBA_ADVISOR_FINDINGS
data
dictionary view that identifies the type of performance problem that is causing the most
impact on the database:
SQL> SELECT task_id, type, message
2 FROm dba_advisor_findings
3 WHERE impact= (select MAX(impcat) FROM dba_advisor_findings);
95127c14.indd 798 2/17/09 2:54:20 PM
Please purchase PDF Split-Merge on www.verypdf.com to remove this watermark.
Proactive Database Maintenance
799
TASK_ID TYPE MESSAGE
------- --------- ----------------------------------------------------
164 PROBLEM SQL statements consuming significant database time
were found.
The output from this query shows that SQL statements being executed in the database
are contributing to the poor database performance. By itself, the
DBA_ADVISOR_FINDINGS
table does not identify which SQL statements are consuming the database time. Instead,
these are shown in the
DBA_ADVISOR_OBJECTS
data dictionary view and are identified by the
TASK_ID
value shown in the query on
DBA_ADVISOR_FINDINGS
. A query on that view, using
the
TASK_ID
of 164 returned by the ADDM session that had the potential for the greatest
database impact, returns the SQL statements shown here:
SQL> SELECT attr4
2 FROM dba_advisor_objects
3 WHERE task_id = 164;
ATTR4
-----------------------------------------------------------------------
UPDATE customers SET credit_limit=credit_limit*1.15 WHERE cust_id = :B1
DELETE FROM sales WHERE time_id BETWEEN ’01-JAN-00’ and ’01-JAN-01’;
UPDATE sales_history SET quantity_sold = quantity_sold+10 WHERE
CHANNEL_ID := B1
SELECT COUNT(*) FROM Sales_history;
SELECT DISTINCT channel_id FROM sales_history;
This query shows all the SQL statements that were captured by the AWR during the
snapshot period and that were used in the ADDM analysis for that same period.
The
DBA_ADVISOR_ACTIONS
data dictionary view shows the ADDM recommendations for
each finding. The following query shows the recommendations for correcting the performance
issues associated with
TASK_ID
164, which was identified earlier as being the costliest database
activity:
SQL> SELECT TRIM(attr1) ATTR1, TRIM(attr2) ATTR2, TRIM(attr3) ATTR3
2 FROM dba_advisor_actions
3 WHERE task_id = 164;
ATTR1 ATTR2 ATTR3
---------- ------ ----------
log_buffer 262144 15728640
db_cache_size 25165824 50331648
undo_retention 900 363
95127c14.indd 799 2/17/09 2:54:21 PM
Please purchase PDF Split-Merge on www.verypdf.com to remove this watermark.
800
Chapter 14
N
Maintaining the Database and Managing Performance
This output indicates that ADDM recommends that the values for
LOG_BUFFER
,
DB_
CACHE_SIZE
, and
UNDO_RETENTION
all be changed from their current values to 15,728,640
bytes; 50,331,648 bytes; and 363 seconds, respectively.
If you want to see the rationale behind each of the actions shown in
DBA_ADVISOR_ACTIONS
,
query the
DBA_ADVISOR_RATIONALE
data dictionary view. The
DBA_ADVISOR_RATIONALE
view
stores the ADDM recommendations that ADDM has formulated based on the AWR data like
those stored in
DBA_ADVISOR_FINDINGS
and
DBA_ADVISOR_OBJECTS
. The following example
shows a sample query on the
DBA_ADVISOR_RATIONALE
view using the
TASK_ID
of 164 identi-
fied earlier:
SQL> SELECT message
2 FROM dba_advisor_rationale
3 WHERE task_id = 164;
MESSAGE
-----------------------------------------------------------------------
Buffer cache writes due to small log files were consuming significant
database time.
The buffer cache was undersized causing significant read I/O.
The value of “undo retention” was 900 seconds and the longest running
query lasted only 330 seconds. This extra retention caused
unnecessary I/O.
As you can see from the complexity of these examples, examining the
ADDM results via EM Database Control is much easier than accessing the
data dictionary views via SQL. From a practical standpoint, you would run
SQL queries against these ADDM views only if EM Database Control were
unavailable.
To gain further insight into the recommendations and information gathered by the
ADDM, Oracle 11g also provides several advisor utilities in EM Database Control. I will
discuss these advisors in the next section.
The Advisory Framework
Oracle 11g comes with several advisors to help proactively manage the database. The top
portion of Figure 14.22 shows the advisors available in Oracle 11g and how to invoke them.
95127c14.indd 800 2/17/09 2:54:21 PM
Please purchase PDF Split-Merge on www.verypdf.com to remove this watermark.