Tài liệu Giới thiệu về IP và ATM - Thiết kế và hiệu suất P3 pptx
Bạn đang xem bản rút gọn của tài liệu. Xem và tải ngay bản đầy đủ của tài liệu tại đây (106.21 KB, 11 trang )
3
Teletraffic Engineering
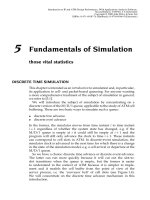
the economic and service arguments
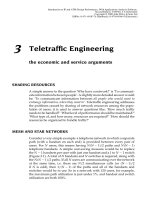
SHARING RESOURCES
A simple answer to the question ‘Why have a network?’ is ‘To communi-
cate information between people’. A slightly more detailed answer would
be: ‘To communicate information between all people who would want to
exchange information, when they want to’. Teletraffic engineering addresses
the problems caused by sharing of network resources among the popu-
lation of users; it is used to answer questions like: ‘How much traffic
needs to be handled?’ ‘What level of performance should be maintained?’
‘What type of, and how many, resources are required?’ ‘How should the
resources be organized to handle traffic?’
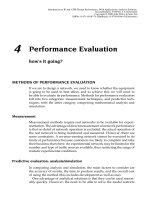
MESH AND STAR NETWORKS
Consider a very simple example: a telephone network in which a separate
path (with a handset on each end) is provided between every pair of
users. For N users, this means having NN 1/2 paths and NN 1
telephone handsets. A simple cost-saving measure would be to replace
the N 1 handsets per user with just one handset and a 1 to N 1switch
(Figure 3.1). A total of N handsets and N switches is required, along with
the NN 1/2paths.IfallN users are communicating over the network
at the same time, i.e. there are N/2 simultaneous calls (or N 1/2
if N is odd), then 1/N 1 of the paths and all of the handsets and
switches would be in use. So in a network with 120 users, for example,
the maximum path utilization is just under 1%, and handset and switch
utilization are both 100%.
Introduction to IP and ATM Design Performance: With Applications Analysis Software,
Second Edition. J M Pitts, J A Schormans
Copyright © 2000 John Wiley & Sons Ltd
ISBNs: 0-471-49187-X (Hardback); 0-470-84166-4 (Electronic)
46
TELETRAFFIC ENGINEERING
Contrast this with a star network, where each user has a single handset
connected to two N to 1 switches, and the poles of the switches are
connected by a single path (Figure 3.2). In this example, there are N
handsets, N C 1 paths, and 2 switches. However, only 2 users may
communicate at any one time, i.e. 3/N C 1 of the paths, 2/N of the
handsets and both of the switches would be in use. So for a network with
120 users, the maximum values are: path utilization is just under 3%,
handset utilization is just under 2% and switch utilization is 100%.
In the course of one day, suppose that each one of the 120 users
initiates on average two 3-minute calls. Thus the total traffic volume is
120 ð 2 ð 3 D 720 call minutes, i.e. 12 hours of calls. Both star and mesh
networks can handle this amount of traffic; the mesh network can carry
up to 60 calls simultaneously; the star network carries only 1 call at a
time. The mesh network provides the maximum capability for immediate
communication, but at the expense of many paths and switches. The star
network provides the minimum capability for communication between
any two users at minimum cost, but at the inconvenience of having to
wait to use the network.
The capacity of the star network could be increased by installing M
switching ‘units’, where each unit comprises two N to 1 switches linked
by a single path (Figure 3.3). Thus, with N/2 switching units, the star
network would have the same communication capability as the mesh
network, with the same number of switches and handsets, but requiring
only 3N/2 paths. Even in this case, though, the size becomes impractical as
N
N.(N-1)/2
N
Figure 3.1. The Mesh Network
N
N+1
2
Figure 3.2. The Star Network
TRAFFIC INTENSITY
47
N
N +M
2M
Figure 3.3. The Star Network with M Switching ‘Units’
N increases, such that reorganization and further sharing of the switching
capacity becomes necessary.
TRAFFIC INTENSITY
Trafficvolumeisdefined as the total call holding time for all calls, i.e. the
number of calls multiplied by the mean holding time per call. This is not
very helpful in determining the total number of paths or switching units
required. We need a measure that gives some indication of the average
workload we are applying to the network.
Trafficintensityisdefined in two ways, depending on whether we
are concerned with the workload applied to the network (offered traffic),
or the work done by the network (carried traffic). The offered traffic
intensity is defined as:
A D
c Ð h
T
where c is number of call attempts in time period T,andh is the mean
call holding time (the average call duration). Note that if we let T equal h
then the offered traffic intensity is just the number of call attempts during
the mean call holding time. The rate of call attempts, also called the ‘call
arrival rate’, is given by
a D
c
T
So the offered traffic intensity can also be expressed as
A D a Ð h
For any specific pattern of call attempts, there may be insufficient paths
to satisfy all of the call attempts; this is particularly obvious in the case
of the star network in Figure 3.2 which has just one path available. A call
attempt made when the network is full is blocked (lost) and cannot be
carried. If, during time period T, c
c
calls are carried and c
l
calls are lost,
then the total number of call attempts is
c D c
c
C c
l
48
TELETRAFFIC ENGINEERING
We then have
A D
c
c
C c
l
Ð h
T
D C C L
where C, the carried traffic, is given by
C D
c
c
Ð h
T
and L,thelosttraffic, is given by
L D
c
l
Ð h
T
The blocked calls contributing to the lost traffic intensity obviously do
notlastforanylengthoftime.Thelosttrafficintensity,asdefined, is thus
a theoretical intensity which would exist if there were infinite resources
available. Hence the lost traffic cannot be measured, although the number
of lost calls can. The carried traffic intensity can be measured, and is the
average number of paths in use simultaneously (this is intuitive, as we
have already stated that it should be a measure of the work being done by
the network). As theoretical concepts, however, we shall see that offered,
lost and carried traffic prove to be very useful indeed.
Traffic intensity is a dimensionless quantity. It is given the ‘honorary’
dimension of erlangs in memory of Anders K. Erlang, the founder of
traffic theory: one erlang of traffic is written as 1 E. Let’sputsome
numbers in the formulas. In our previous example we had 240 calls over
the period of a day, and an average call duration of 3 minutes. Suppose
24 calls are unsuccessful, then c D 240, c
c
D 216, and c
l
D 24. Thus
A D
240 ð 3
24 ð 60
D 0.5E
L D
24 ð 3
24 ð 60
D 0.05 E
C D
216 ð 3
24 ð 60
D 0.45 E
Later in this chapter we will introduce a formula which relates A and L
according to the number of available paths, N.
It is important to keep in mind that one erlang (1 E) implicitly represents
a quantity of bandwidth, e.g. a 64 kbit/s circuit, being used continuously.
For circuit-switched telephone networks, it is unnecessary to make this
explicit: one telephone call occupies one circuit for the duration of one
call. However, if we need to handle traffic with many different bandwidth
demands, traffic intensity is rather more difficult to define.
TCP: TRAFFIC, CAPACITY AND PERFORMANCE
49
One way of taking the service bandwidth into account is to use
the MbitE/s (the ‘megabit-erlang-per-second’)asameasureoftraffic
intensity. Thus 1 E of 64 kbit/s digital telephony is represented as
0.064 MbitE/s (in each direction of communication). We shall see later,
though, that finding a single value for the service bandwidth of variable-
rate traffic is not an easy matter. Suffice to say that we need to know the
call arrival rate and the average call duration to give the traffic flow in
erlangs, and also the fact that some bandwidth is implicitly associated
with the traffic flow for each different type of traffic.
PERFORMANCE
The two different network structures, mesh and star, illustrate how the
same volume of traffic can be handled very differently. With the star
network, users may have to wait significantly longer for service (which,
in a circuit-switched network, can mean repeated attempts by a user to
establish a call). A comparison of the waiting time and the delay that users
will tolerate (before they give up and become customers of a competing
network operator) enables us to assess the adequacy of the network. The
waiting time is a measure of performance, as is the ‘loss’ of a customer.
This also shows a general principle about the flow of traffic:introducing
delay reduces the flow, and a reduced traffic flow requires fewer
resources. The challenge is to find an optimum value of the delay
introduced in order to balance the traffic demand, the performance
requirements, and the amount (and cost) of network resources. We
will see that much teletraffic engineering is concerned with assessing
the traffic flow of cells or packets being carried through the delaying
mechanism of the buffer.
TCP: TRAFFIC, CAPACITY AND PERFORMANCE
So we have identified three elements: the capacity of a network and its
constituent parts; the amount of traffic to be carried on the network; and
the requirements associated with that traffic, in terms of the performance
offered by the network to users (see Figure 3.4). One of these elements
Capacity
Performance
Traffic
Figure 3.4. Traffic, Capacity and Performance