Tài liệu Nothing But Net 2009 Internet Investment Guide 5 pdf
Bạn đang xem bản rút gọn của tài liệu. Xem và tải ngay bản đầy đủ của tài liệu tại đây (60.62 KB, 10 trang )
41
Global Equity Research
05 Januar
y 2009
Imran Khan
(1-212) 622-6693
For our international forecast, we expect two main drivers to impact eCommerce
growth: (a) a very weak consumer outlook, with historically low consumer
confidence in parts of the world, including the UK, and (b) continued shift of wallet
share from offline retailers to online sellers.
Both in the US and worldwide, we expect the eCommerce to benefit from several
drivers, some region-specific and some general. Of primary importance among these
is the growing adoption of broadband, which is much more conducive to eCommerce
growth than slower forms of Internet access. Other factors include: (1) continued
rises in online shopping penetration in Western Europe, (2) continued investments by
online retailers in broadening selection, (3) improvements in shipping infrastructure,
(4) improved payment systems and (5) better fraud protection.
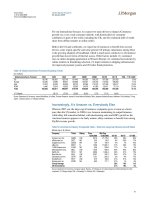
Table 18: Global eCommerce Forecast (Excluding Travel)
$ in millions
Global eCommerce Forecast 2004 2005 2006 2007 2008E 2009E 2010E 2011E ’08E – ’11E CAGR
US 88,780 106,851 128,708 151,443 160,563 168,270 187,958 207,505 8.9%
Europe 52,430 72,690 96,631 123,698 152,537 140,740 170,942 198,200 9.1%
Asia 31,972 43,054 55,556 69,705 90,585 112,573 127,949 139,617 15.5%
ROW 9,440 13,216 18,502 25,903 34,970 41,963 55,811 73,113 27.9%
Total 182,622 235,811 299,397 370,749 438,655 463,546 542,660 618,435 12.1%
Y/Y Growth 29.1% 27.0% 23.8% 18.3% 5.7% 17.1% 14.0%
Source: Department of Commerce, Internet WorldStats, UK eStats, Forrester Research, Iresearch, Korea National Statistics Office, Japanese Statistics Bureau, eMarketer, PhuCusWright, TIA.org,
Jupiter, company reports, J.P. Morgan estimates
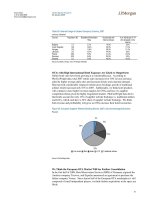
Increasingly, It’s Amazon vs. Everybody Else
Whereas 2007 saw the large-cap eCommerce companies grow revenue at a faster
pace than the US market, in 2008 it was Amazon maintaining its outperformance,
while eBay fell somewhat behind, with decelerating sales and GMV growth as the
Auctions business appears to be fairly mature; eBay continues to benefit from strong
PayPal revenue growth.
Table 19: eCommerce Industry Comparable Table -- Small and Large Cap Revenue Growth Rates
Market cap in $ millions
Company Ticker Rating Price Mkt Cap
12/30/2008 12/30/2008 ’05/’06 ’06/’07 ’07/’08E
Amazon.com Inc. AMZN OW 50.76 21,776.0 26% 39% 26%
eDiets.com Inc. DIET NR 3.40 85.5 -9% -39% -17%
drugstore.com inc. DSCM NR 1.04 100.4 4% 7% -10%
eBay Inc. EBAY N 13.96 17,824.7 31% 29% 13%
1-800-Flowers.com FLWS NR 3.55 225.6 17% 1% 5%
MercadoLibre Corp. MELI OW 15.69 695.0 84% 64% 62%
Netflix Inc. NFLX NR 28.66 1,694.4 46% 21% 13%
Blue Nile Inc. NILE UW 23.67 343.7 24% 27% -3%
Overstock.com Inc. OSTK NR 11.51 261.8 -2% -4% 17%
Shutterfly Inc. SFLY OW 6.75 169.2 47% 51% 12%
Stamps.com Inc. STMP NR 9.23 177.1 37% 1% -2%
Group Average 28% 18% 11%
US E-Commerce 21% 18% 6%
Source: Department of Commerce, Company reports, Reuters, J.P. Morgan est. for rated companies, FactSet estimates for other
companies. J.P. Morgan ratings: OW = Overweight; N = Neutral; UW = Underweight
42
Global Equity Research
05 Januar
y 2009
Imran Khan
(1-212) 622-6693
Takeaways from the J.P. Morgan Internet Team’s 2008
Consumer Survey
In the second half of November, we conducted a proprietary survey of US
consumers. The survey had 766 participants, residents of the United States aged 18+.
In addition to asking consumers about their shopping plans for the 2008 holiday
season, we asked the respondents a variety of questions about their online shopping
habits in general, and the key broad takeaways are summarized below:
Price Is Biggest Factor in Choosing a Site
Nearly half of shoppers indicated that price was their top factor when it comes to
choosing an online store, with selection also important. Of the options included in
our survey, the least popular one, by a wide margin, was, “recommendations from
friends and relatives.”
Table 20: Price Is Paramount: Factors that Influence Buyers’ Choices
% among respondents who indicated they shop online
Factor #1 factor #2 factor In top 5
Price 48.8% 19.5% 91.0%
Selection 12.0% 25.3% 79.1%
Familiarity/experience with store 12.0% 8.7% 57.3%
Payment options 5.0% 10.2% 50.9%
Customer service 5.0% 7.9% 50.0%
Promotions / advertisements 3.7% 9.9% 42.8%
Access to customer reviews / product info 2.7% 5.9% 39.0%
Ability to purchase multiple items 2.7% 4.9% 33.4%
Name recognition 5.8% 5.0% 32.5%
Recommendations from friends / relatives 2.1% 2.6% 21.0%
Source: J.P. Morgan Internet Team 2008 Consumer Survey
Looking at the data on a site-by-site basis does not change the top-line conclusion:
price remains the #1 consideration for most shoppers regardless of site, with 46-50%
of shoppers at each of Amazon, eBay, Walmart.com, Target.com and Sears.com
listing price as their top factor in choosing a site.
Higher-income shoppers look for slightly different things in a site. More shoppers
with incomes over $100K listed “Familiarity/experience with store” as one of their
top five factors than did those earning less than $100K. Even for the >$100K-income
shoppers, price is the biggest factor, but notably fewer respondents chose it as their
#1 factor: 38% for the higher-income group, vs. 50% for those with incomes below
$100K.
Table 21: Familiarity Matters More to Higher-Income Shoppers
% of online shoppers who indicated factor was one of their top 5 factors in choosing a site
Income <$100K Income >$100K Difference
Price 92.3% 82.4% 9.9%
Selection 79.7% 75.3% 4.4%
Familiarity/experience with store 56.7% 61.2% -4.4%
Payment options 51.3% 48.2% 3.1%
Customer service 49.7% 51.8% -2.0%
Promotions / advertisements 42.0% 48.2% -6.2%
Access to customer reviews / product info 38.4% 43.5% -5.2%
Ability to purchase multiple items 33.8% 30.6% 3.2%
Name recognition 32.4% 32.9% -0.5%
Recommendations from friends / relatives 20.7% 23.5% -2.9%
Source: J.P. Morgan Internet Team 2008 Consumer Survey
43
Global Equity Research
05 Januar
y 2009
Imran Khan
(1-212) 622-6693
Walmart.com, Target.com Catching Up to Large Online Sites
Third-party metrics indicate eBay and Amazon are the two largest online-only stores
in terms of unique users, whereas Walmart.com and Target.com are the two biggest
sites belonging to brick-and-mortar retailers.
In ’07, Amazon and eBay drew business from more online shoppers than any other
sites we asked about. For the ’08 holidays, our survey reveals no significant change
in Amazon and eBay’s reach, compared to double-digit increases in the number of
shoppers planning to use Walmart.com and Target.com; the only other site in our
survey with a statistically significant Y/Y increase, Sears.com, also belongs to a
brick-and-mortar retailer.
Table 22: Online Shoppers Who Used (’07) or Plan to Use (’08) Specific Sites for Holiday
Shopping
Site 2007 2008 Y/Y difference significant?
Amazon 50.9% 48.3% No
eBay 33.6% 32.4% No
Walmart.com 31.3% 34.7% Yes, up 11% Y/Y
Bestbuy.com 22.1% 22.4% No
Target.com 21.7% 26.8% Yes, up 24% Y/Y
Overstock.com 16.4% 18.2% No
Circuitcity.com 12.0% 13.6% No
Sears.com 9.0% 12.3% Yes, up 36% Y/Y
QVC.com 7.3% 7.0% No
HSN.com 5.1% 5.1% No
Source: J.P. Morgan Internet Team 2008 Consumer Survey. Statistical significance at a p<.05 level.
Media, Apparel Top Categories
Books, music and video comprised the top category, with ~65% of online shoppers
reporting they had bought such items online within the past year; the number was in
line with our survey result a year ago. Apparel and accessories, at 59% penetration,
was second, tilted predominantly toward female shoppers. Unsurprisingly, men were
more likely to shop in both the Computers and videogames category and the
Electronics category.
The results were very similar to those in our 2007 survey, with the top four
categories among men unchanged (Toys replaced Health and Beauty at #5). For
women, the five most popular categories remained the same, though Apparel
leapfrogged over Media into first place, and Toys edged out Computers and
videogames for #4.
Table 23: Media Items Popular with Both Genders: Top Five Categories among Men and Women
%, among respondents who indicated they shop online, that indicated they had made purchases in category
Men Women
Books, music, videos and other media 61.5% Apparel and accessories (includes shoes,
handbags and jewelry)
69.0%
Computer and videogames software and
hardware
50.5% Books, music, videos and other media 68.5%
Apparel and accessories (includes
shoes, handbags and jewelry)
46.2% Health & Beauty 41.1%
Electronics (includes television and
stereo equipment)
33.2% Toys 39.7%
Toys 29.6% Computer and videogames software and
hardware
37.5%
Source: J.P. Morgan Internet Team 2008 Consumer Survey
44
Global Equity Research
05 Januar
y 2009
Imran Khan
(1-212) 622-6693
Younger Users Shop Online More, Use Classifieds More
Among online shoppers, 40% of those aged 18-41 expect to do more than 40% of
their holiday shopping online this year, compared to 27% of shoppers aged 42+.
Nearly half of the older group plans to do 20% or less of their holiday shopping
online. At the same time, the 42+ bracket included almost twice as high a percentage
of people who planned to do almost all (over 80%) of their shopping online, 8% vs.
4%.
Figure 20: Expectation of Portion of Holiday Shopping to Be Done Online, Holiday Season ’08
% among respondents who indicated they shop online
34%
26%
23%
13%
4%
47%
25%
11%
9%
8%
0%
10%
20%
30%
40%
50%
0-20% 21-40% 41-60% 61-80% 81-100%
Age 18-41 Age 42+
Source: J.P. Morgan Internet Team 2008 Consumer Survey
Younger shoppers also appear to be more open to using classified sites, with
significantly higher usage rates. The discrepancy is even more extreme at the edges
of the age distribution: 48% of online shoppers 18-25 reported having bought
something on a classified site, compared to only 17% of those aged 58 and older.
Likewise, more than 41% in the youngest group reported having sold something on a
classified site, compared to only 16% of respondents aged 58 and older.
Figure 21: Online Classified Sites Attract a Younger Demographic
% of online shoppers saying they had ever bought/sold on a classified site (such as craigslist)
40%
34%
21%
17%
0%
10%
20%
30%
40%
50%
Bought on a classified site Sold on a classified site
Age 18-41 Age 42+
Source: J.P. Morgan Internet Team 2008 Consumer Survey
Internet Sales Tax: In US, the Action Will Be in the States
In 2008, the state of New York began requiring online retailers to collect sales taxes
even if they had no physical presence in the state, so long as members of their
affiliate networks (who get paid a commission for driving sales traffic to the site) are
present in the state.
45
Global Equity Research
05 Januar
y 2009
Imran Khan
(1-212) 622-6693
Several companies, notably Amazon, have started collecting the NY sales tax while
appealing the ruling. Overstock.com, on the other hand, has chosen to drop its NY-
based affiliates and not charge the tax.
Given that many states are facing significant revenue shortfalls this year, we expect
to see continued efforts by states to collect tax revenue on online sales. While the
implementation of state sales taxes can be a slight negative, we do not expect this
trend to have a material impact on US eCommerce.
Catalysts for International Growth
We believe the rising tide of increased Internet use across the world is likely to help
lift eCommerce globally. However, we see three key challenges to overcome for
eCommerce to fulfill its potential:
• Improvement of shipping infrastructure. Postal and parcel service in
many parts of the world can be unreliable, and a reliable distribution
channel is an essential prerequisite for the growth of eCommerce.
• Improved payment systems. This is not a world-wide challenge, but rather
a slew of country-specific challenges related to the idiosyncrasies of
different countries’ banking systems and conventions. Even in more
developed countries, significant differences emerge: e.g., Germany and
Austria have historically seen lower rates of PayPal use than other eBay
geographies due to the prevalence of bank transfers as a mode of payment
there.
Table 24: PayPal Penetration on Select eBay Country Sites
% of listings that include PayPal
Country % Penetration
US 99.3%
UK 98.8%
Canada 98.6%
Australia 94.2%
Switzerland 89.4%
Italy 87.6%
Germany 82.2%
France 81.6%
Spain 78.9%
Belgium 42.2%
Source: eBay.com (and country sites), J.P. Morgan estimates, data collected December, 2008
• Better fraud protection. The promise of eCommerce has been one of lower
prices and/or better selection, with the trade-off that many purchases must
be made sight-unseen. The threat of fraud remains present, and structures
that insure buyers against fraud should help smooth operations in an
eCommerce environment that is not yet fully mature. (An example is eBay’s
PayPal, which has, over the course of the past year, augmented the level of
fraud protection it provides in the US, from $2K per transaction to as much
as the full purchase price of the transaction. PayPal uses such protection to
create buyer confidence, with transaction loss rates for the PayPal unit of
24-33 bps, as denominated by total payment volume).