Tài liệu Nothing But Net 2009 Internet Investment Guide 14 doc
Bạn đang xem bản rút gọn của tài liệu. Xem và tải ngay bản đầy đủ của tài liệu tại đây (67.3 KB, 10 trang )
131
Global Equity Research
05 Januar
y 2009
Imran Khan
(1-212) 622-6693
Casual games can be broadly classified into 1) board and chess games, and 2)
advanced casual games. Board and chess games, as the name suggests, are board
games, chess, different types of card games, and other traditional games put online.
These are viewed more as commodity products, and difficult to differentiate from
competitors. As such, monetization is typically lower.
Advanced casual games are online games that have more depth and content
compared with board and chess games. However, they are not as involving as
MMORPG. Gamers spend less than an hour per game session. Successful advanced
casual games are typically more innovative, and bring in new ideas to the market
space. The popular advanced casual games include: BNB, O2Jam, Freestyle,
China.com’s Yulgang games, and can also be regarded as casual MMORPG games.
Successful casual games generate more revenue compared to board and chess games.
The revenue model for casual games is in-game item sales. Typical game items are:
avatars (virtual clothing, accessories, and decorative products), tools (i.e., virtual golf
clubs to play golf), weapons, special features (i.e., ability to see competitors’ card in
card games), and membership (priority access to game servers, and “members only”
games).
Casual and MMORPG Are Complementary Rather than Competing Products
We believe casual games and MMOPRG satisfy needs of players at different times.
For example, if a player has 15 minutes to kill, they likely would turn to casual
games, but if a player has a few hours everyday, playing a simple casual game is
likely to become too boring. Therefore, this same player could play both types of
games at different times, depending on his or her availability and needs.
We believe new innovative advanced casual games attract non-game players to
online games and further expand the gamer base. We observe this from the
demographics differences between casual games and MMORPG games. These
additional players could perhaps become MMORPG gamers down the road, if they
find online gaming interesting.
132
Global Equity Research
05 Januar
y 2009
Imran Khan
(1-212) 622-6693
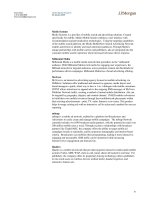
Figure 78: Gender Comparison Between Casual and MMORPG
0%
10%
20%
30%
40%
50%
60%
70%
80%
Casual game MMORPG
Percent
Source: IDC (2007). Note: Grey – Male players, Blue – Female players.
Figure 79: Age Comparison Between Casual and MMORPG
0%
10%
20%
30%
40%
50%
60%
70%
80%
90%
100%
Casual game MMORPG
50 and abov e 40-49 30-39 21-29 20 and be
Source: IDC (2007).
Do Gamers Have Time to Play Both Advanced Casual and MMORPG?
In China, the market trend is to develop advanced casual games that are more
complex and involving, and as such these casual games consume more time
compared with before. Investors are concerned that this would reduce spending on
MMORPG games. We believe this may be true, but the effects on MMORPG should
be minimal, in our opinion. First, it is not uncommon for users to play multiple
games, so users can play both MMORPG and casual games during the same day.
Second, an expanded casual game user base should also bring new users to
MMORPG.
Online Games—A Sticky Business
In online games, players build a strong community with other game players. They
communicate through instant messengers in the game. Once players have been
playing for a certain period, they start building their seniority and respect within the
gaming community, as well as their stock of accumulated weapons. As such, fair
play becomes very important. Hacking not only demoralizes players but also seems
to cause “community unrest” and to threaten the “social order” in the game space.
Game operators hire game masters or ‘GMs’ who patrol the game space to check
unfair practices, and remove those users who violate the rules. Leaving the game
means severing ties with the community, as well as giving up weapons and armors
accumulated over time. As such, players have proved to be quite loyal to the games.
A well-run game is therefore very sticky, and the operators’ goal is to make their
game stickier. To further increase user loyalty, game operators organize special
events in the virtual space, as well as organize offline promotions and parties. One
good example is Lineage in Korea, which was launched in Korea about six years ago
and remains one of the top games in the country.
Any Piracy Issues of Online Games?
Online games are designed to get around the piracy issue. There are two sets of
software – server software and client software. Server software is installed inside
game companies’ servers. The game server is designed to protect against hackers
133
Global Equity Research
05 Januar
y 2009
Imran Khan
(1-212) 622-6693
trying to copy or alter the server software. Client software is distributed free of
charge and can be downloaded from a game operator's sites at any time. Since client
software is free, unlike game consoles where game software is charged for a fee,
there is no reason to make pirated copies. As such, piracy problems are very limited.
What are pirated servers?
This refers to the situation where the main server software is stolen from game
companies or the server software is being reverse-engineered. In this situation,
“criminals” put stolen / pirated server codes on home-run servers and charge users a
lower fee than authentic servers to play the game on their servers. These are referred
to as “pirated” servers.
Games that are operated widely across the globe are more prone to being pirated.
This is because game developers need to distribute a source code to outside game
local operators, and as such, there is a higher chance of the source code being leaked
out. For example, Mir2, Mu, and Lineage are well known for having pirated servers
in China.
NetEase, which develops its games in-house, has not seen any pirated server issues.
Also, new games have more security features to protect the server software from
being pirated. For example, we have not noted any pirated servers for World of
Warcraft.
What are hacking tools / software?
Hacking in online games typically refers to special (purchased or self-written)
programs that run on players’ PCs. With these special hacking tools, game players
can, for example, get infinite lives, nuke all the adjacent players, or take tools from
others. Hacking demoralizes other players and results in their leaving the game.
To tackle the issue, online game operators can: (1) amend the actual game software,
(2) hire more game masters to patrol the virtual community, and (3) bar hacking
players from playing the game. The first option is the most effective way to deal with
the problem. However, as many online game operators only purchase games from
other developers and do not have access to the source code, there could be a time
delay in addressing a particular hacking issue. In fact, this is a fairly frequent issue
raised by operators in China, and has led to the decline of some early online games.
Economy of Games
We believe the required number of concurrent users is low for a MMORPG game to
break even. Excluding development costs or licensing fees, a game can achieve an
operational breakeven at 4,000-5,000 average concurrent users.
With relatively low breakeven user numbers, we believe the number of MMORPG
game titles will continue grow. However, many of these will likely be small-scale
games that we expect will target niche audiences, much like different types of
movies: action-adventure, science-fiction, martial arts, war, mystery, medieval, etc.
134
Global Equity Research
05 Januar
y 2009
Imran Khan
(1-212) 622-6693
Table 64: Estimated Gross Income of a MMORPG under Various Concurrent Users
Case 1 Case 2 Case 3
Average concurrent users 1,000 4,000 10,000
Active paying users 11,000 44,000 110,000
ARPU per users (RMB): 9 9 9
Revenue after distributor’s discount 79,200 316,800 792,000
Number of servers 3 4 9
Monthly server amortization & bandwidth cost 16,375 21,833 49,125
Game masters and other labor cost 48,000 64,000 144,000
Marketing and promotion 55,440 110,880 158,400
Other operating expenses 47,520 95,040 158,400
Gross Net Income (88,135) 25,047 282,075
Source: J.P. Morgan estimates. Note: Excluding development cost, amortization of licensing fee or revenue sharing with game developer.
How Fast Would a Game Decline From Its Peak?
As a rule of thumb, typical popular MMOPRG games reach their peak in around
three years. The rate of decline from the peak varies depending on various factors.
Some games decline at a faster rate compared with others. For example, we noted
Mu, operated by 9Webzen, experienced a step function (around 50% drop each step)
type of sharp fall, mainly due to hacking and cheating tools, while Mir 2 declined
30% Q/Q in 3Q05, mainly due to pirated servers.
We believe the rate of decline from the peak varies, depending mainly on these
factors: 1) hacking or pirated server issues, 2) ongoing promotion and user activities,
3) availability of upgrade packs.
Some of the Korea games have still maintained a high level of usage for over 6 years.
Figure 80: PCU (Peak Concurrent Users) Trend for Long-Running Korean Online Games
0
50
100
150
200
1Q02 3Q02 1Q03 3Q03 1Q04 3Q04 1Q05 3Q05 1Q06 3Q06 1Q07 3Q07 1Q08 3Q08
Lineage - Korea MU - Korea
Li 2 K
Source: Company reports.
Comparison of Leading Games and Game Companies
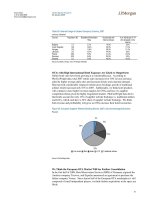
Table 65: Leading MMORPG Companies by Revenue Market Share
2006 2007 1H08
Shanda 22% 24% 21%
NetEase 31% 22% 18%
Giant Interactive 7% 18% 16%
The9 17% 15% 14%
Sohu 1% 4% 10%
Perfect World 2% 7% 9%
NetDragon 2% 4% 5%
Kingsoft 3% 4% 3%
Others 15% 3% 3%
Source: Company reports, J.P. Morgan estimates for companies covered by J.P. Morgan, and IDC for all others.
135
Global Equity Research
05 Januar
y 2009
Imran Khan
(1-212) 622-6693
Table 66: Leading MMORPGs by PCU (Peak Concurrent Users)
(PCU in ‘000s) 1Q06 2Q06 3Q06 4Q06 1Q07 2Q07 3Q07 4Q07 1Q08 2Q08
Fantasy WWJ (NetEase) 1,236 1,313 1,223 1,335 1,503 1,472 1,443 1,520 1,666 2,082
Sequential growth 18.5% 6.2% -6.9% 9.2% 12.5% -2.1% -1.9% 5.3% 9.6% 25.0%
ZT Online (Giant) 120 320 558 755 874 1,073 888 983 1,530 2,100
Sequential growth 166.7% 74.4% 35.3% 15.8% 22.7% -17.2% 10.7% 55.6% 37.3%
WoW (The9) 610 630 595 680 680 665 809 990 999 1,030
Sequential growth 15.1% 3.3% -5.6% 14.3% 0.0% -2.2% 21.7% 22.4% 0.9% 3.1%
TLBB (Sohu) 400 400 400 600 700
Sequential growth 0.0% 0.0% 50.0% 16.7%
WWJ2 (NetEase) 581 562 593 603 480 505 305 387 386 544
Sequential growth 4.8% -3.3% 5.5% 1.7% -20.4% 5.3% -39.7% 26.9% -0.4% 41.1%
Eudemons Online (NetDragon) 26 50 128 325 438 496 527 574 479 505
Sequential growth 92.3% 156.0% 153.9% 34.8% 13.2% 6.3% 8.9% -16.6% 5.4%
Source: Company reports. Note: Individual game data not reported by Shanda and Perfect World.
Table 67: Leaders in MMOG Active Paying Accounts (Free-to-Play Model)
(In ‘000s) 1Q06 2Q06 3Q06 4Q06 1Q07 2Q07 3Q07 4Q07 1Q08 2Q08
Shanda 2,470 2,230 2,140 2,290 2,340 2,720 3,080 3,470 4,110 4,240
Sequential growth -9.7% -4.0% 7.0% 2.2% 16.2% 13.2% 12.7% 18.4% 3.2%
Giant Interactive 143 602 698 787 986 1,248 1,318 1,405 1,447 1,760
Sequential growth 321.0% 15.9% 12.8% 25.3% 26.6% 5.6% 6.6% 3.0% 21.6%
Sohu 209 690 1,096 1,387 1,684
Sequential growth 230.1% 58.8% 26.6% 21.4%
Perfect World 26 602 695 1,040 1,390 1,565 1,701 1,530
Sequential growth 2215% 15.4% 49.6% 33.7% 12.6% 8.7% -10.1%
The9 4 194 183 255 210 165
Sequential growth 4995% -5.3% 39.2% -17.8% -21.6%
Source: Company reports, J.P. Morgan estimates. Note: Perfect World: based on item-based games; Sohu: based on TLBB; The9: based on SUN, GE and JJW.
Table 68: Leaders in MMOG Quarterly ARPU per Active Paying Account (Free-to-play Model)
(In Rmb) 1Q06 2Q06 3Q06 4Q06 1Q07 2Q07 3Q07 4Q07 1Q08 2Q08
Giant Interactive 84 117 220 220 320 295 305 309 325 286
Sequential growth 39.3% 88.0% 0.0% 45.5% -7.8% 3.5% 1.1% 5.3% -12.1%
Perfect World 12 76 95 98 136 141 151 188
Sequential growth 544.9% 25.2% 2.8% 38.8% 3.7% 7.1% 24.5%
Sohu 171 118 147 199 179
Sequential growth -30.8% 24.6% 35.4% -10.1%
Shanda 91 137 155 165 177 174 179 173 156 164
Sequential growth 49.7% 13.4% 6.8% 7.1% -1.9% 3.1% -3.2% -10.0% 5.2%
The9 88 85 175 155 217 228
Sequential growth -3.4% 105.4% -11.2% 39.4% 5.2%
Source: Company reports, J.P. Morgan estimates. Note: Perfect World: based on item-based games; Sohu: based on TLBB; The9: based on SUN, GE and JJW.