Tài liệu High Performance Computing on Vector Systems-P2 pptx
Bạn đang xem bản rút gọn của tài liệu. Xem và tải ngay bản đầy đủ của tài liệu tại đây (734.62 KB, 30 trang )
The NEC SX-8 Vector Supercomputer System 21
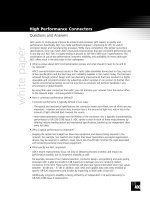
Editing and Compiling
The built-in Source Browser enables the user to edit source programs. For com-
piling all major compiler options are available through pull downs and X-Window
style boxes. Commonly used options can be enabled with buttons and free format
boxes are available to enter specific strings for compilation and linking. Figure 8
shows the integration of the compiler options windows with the Source Browser.
Fig. 8. Compiler Option Win-
dow with Source Browser
Debugging
Debugging is accomplished through the PDBX. PDBX being the symbolic de-
bugger for shared memory parallel programs. Enhanced capabilities include the
graphical presentation of data arrays in various 2 or 3 dimensional styles.
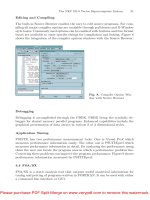
Application Tuning
PSUITE has two performance measurement tools. One is Visual Prof which
measures performance information easily. The other one is PSUITEperf which
measures performance information in detail. By analyzing the performance using
them the user can locate the program area in which a performance problem lies.
Correcting these problems can improve the program performance. Figure 9 shows
performance information measured by PSUITEperf.
4.4 FSA/SX
FSA/SX is a static analysis tool that outputs useful analytical information for
tuning and porting of programs written in FORTRAN. It can be used with either
a command line interface or GUI.
Please purchase PDF Split-Merge on www.verypdf.com to remove this watermark.
22 S. Tagaya et al.
Fig. 9. PSuite Performance View
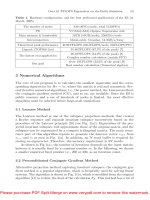
4.5 TotalView
TotalView is the debugger provided by Etnus which has been very popular for use
on HPC platforms including the SX. TotalView for SX-8 system supports FOR-
TRAN90/SX, C++/SX programs and MPI/SX programs. The various function-
alities of TotalView enable easy and efficient development of complicated parallel
and distributed applications.
Figure 10 shows the process window, the call-tree window and Message
queue graph window. The process window in the background shows source
code, stack trace (upper-left), stack frame (upper-right) for one or more threads
in the selected process. The message queue graph window on the right hand
side shows MPI program’s message queue state of the selected communi-
cator graphically. The call-tree window (at the bottom) shows a diagram
linking all the currently-active routines in all the processes or the selected
process by arrows annotated with calling frequency of one routine by an-
other.
Please purchase PDF Split-Merge on www.verypdf.com to remove this watermark.
The NEC SX-8 Vector Supercomputer System 23
Fig. 10. TotalView
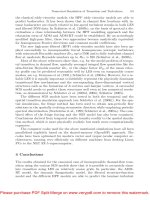
Fig. 11. Vampir/SX
Please purchase PDF Split-Merge on www.verypdf.com to remove this watermark.
24 S. Tagaya et al.
4.6 Vampir/SX
Vampir/SX enables the user to examine execution characteristics of the distri-
buted-memory parallel program. It was originally developed by Pallas GmbH
(though the business has been acquired by Intel) and ported to SX series. Vam-
pir/SX has all major features of Vampir and also has some unique features.
Figure 11 shows a session of Vampir/SX initiated from PSUITE. The display
in the center outlines processes activities and communications between them, the
horizontal axis being time and the vertical process-rank(id). The pie charts to
the right show the ratio for different activities for all processes. The matrix-like
display at the bottom and the bar-graph to the bottom-right shows statistics of
communication between different pairs of processes.
Vampir/SX has various filtering methods for recording only desired informa-
tion. In addition it allows the user to display only part of recorded information,
saving time and memory used for drawing. The window to the top-right is the
interface allowing the user to select time-intervals and a set of processes to be
analyzed.
4.7 Networking
All normal UNIX communications protocols are supported. SUPER-UX sup-
ports Network File System (NFS) Versions 2 and 3.
Please purchase PDF Split-Merge on www.verypdf.com to remove this watermark.
Have the Vectors the Continuing Ability
to Parry the Attack of the Killer Micros?
Peter Lammers
1
, Gerhard Wellein
2
, Thomas Zeiser
2
, Georg Hager
2
,
and Michael Breuer
3
1
High Performance Computing Center Stuttgart (HLRS),
Nobelstraße 19, D-70569 Stuttgart, Germany,
,
2
Regionales Rechenzentrum Erlangen (RRZE),
Martensstraße 1, D-91058 Erlangen, Germany,
,
3
Institute of Fluid Mechanics (LSTM),
Cauerstraße 4, D-91058 Erlangen, Germany,
Abstract Classical vector systems still combine excellent performance with a well
established optimization approach. On the other hand clusters based on commodity
microprocessors offer comparable peak performance at very low costs. In the context
of the introduction of the NEC SX-8 vector computer series we compare single and
parallel performance of two CFD (computational fluid dynamics) applications on the
SX-8 and on the SGI Altix architecture demonstrating the potential of the SX-8 for
teraflop computing in the area of turbulence research for incompressible fluids. The
two codes use either a finite-volume discretization or implement a lattice Boltzmann
approach, respectively.
1 Introduction
Starting with the famous talk of Eugene Brooks at SC 1989 [1] there has been an
intense discussion about the future of vector computers for more than 15 years.
Less than 5 years ago, right at the time when it was widely believed in the
community that the “killer micros” have finally succeeded, the “vectors” stroke
back with the installation of the NEC Earth Simulator (ES). Furthermore, the
U.S. re-entered vector territory, allowing CRAY to go back to its roots.
Even though massively parallel systems or clusters based on microprocessors
deliver high peak performance and large amounts of compute cycles at a very
low price tag, it has been emphasized recently that vector technology is still
extremely competitive or even superior to the “killer micros” if application per-
formance for memory intensive codes is the yardstick [2, 3, 4].
Introducing the new NEC SX-8 series in 2005, the powerful technology used
in the ES has been pushed to new performance levels by doubling all important
Please purchase PDF Split-Merge on www.verypdf.com to remove this watermark.
26 P. Lammers et al.
performance metrics like peak performance, memory bandwidth and intercon-
nect bandwidth. Since the basic architecture of the system itself did not change
at all from a programmer’s point of view, the new system is expected to run
most applications roughly twice as fast as its predecessor, even using the same
binary.
In this report we test the potentials of the new NEC SX-8 architecture using
selected real world applications from CFD and compare the results with the
predecessor system (NEC SX-6+) as well as a microprocessor based system. For
the latter we have chosen the SGI Altix, which uses Intel Itanium 2 processors
and usually provides high efficiencies for the applications under consideration in
this report.
We focus on two CFD codes from turbulence research, both being members
of the HLRS TERAFLOP-Workbench [5], namely DIMPLE and TeraBEST.
The first one is a classical finite-volume code called LE SOCC (Large Eddy
Simulation On Curvilinear Co-ordinates [6, 7, 8, 9]), mainly written in FOR-
TRAN77. The second one is a more recent lattice Boltzmann solver called
BEST (Boltzmann Equation Solver Tool [10]) written in FORTRAN90. Both
codes are MPI-parallelized using domain decomposition and have been opti-
mized for a wide range of computer architectures (see e.g. [11, 12]). As a test
case we run simulations of flow in a long plane channel with square cross section
or over a single flat plate. These flow problems are intensively studied in the
context of wall-bounded turbulence.
2 Architectural Specifications
From a programmer’s view, the NEC SX-8 is a traditional vector processor
with 4-track vector pipes running at 2 GHz. One multiply and one add instruc-
tion per cycle can be sustained by the arithmetic pipes, delivering a theoretical
peak performance of 16 GFlop/s. The memory bandwidth of 64 GByte/s al-
lows for one load or store per multiply-add instruction, providing a balance of
0.5 Word/Flop. The processor has 64 vector registers, each holding 256 64-bit
words. Basic changes compared to its predecessor systems are a separate hard-
ware square root/divide unit and a “memory cache” which lifts stride-2 mem-
ory access patterns to the same performance as contiguous memory access. An
SMP node comprises eight processors and provides a total memory bandwidth
of 512 GByte/s, i. e. the aggregated single processor bandwidths can be satu-
rated. The SX-8 nodes are networked by an interconnect called IXS, providing
a bidirectional bandwidth of 16 GByte/s and a latency of about 5 microseconds.
For a comparison with the technology used in the ES we have chosen a NEC
SX-6+ system which implements the same processor technology as used in the
ES but runs at a clock speed of 565 MHz instead of 500 MHz. In contrast to
the NEC SX-8 this vector processor generation is still equipped with two 8-track
vector pipelines allowing for a peak performance of 9.04 GFlop/s per CPU for the
NEC SX-6+ system. Note that the balance between main memory bandwidth
and peak performance is the same as for the SX-8 (0.5 Word/Flop) both for the
Please purchase PDF Split-Merge on www.verypdf.com to remove this watermark.
Vectors, Attack of the Killer Micros 27
single processor and the 8-way SMP node. Thus, we expect most application
codes to achieve a speed-up of around 1.77 when going from SX-6+ to SX-8.
Due to the architectural changes described above the SX-8 should be able to
show even a better speed-up on some selected codes.
As a competitor we have chosen the SGI Altix architecture which is based
on the Intel Itanium 2 processor. This CPU has a superscalar 64-bit architecture
providing two multiply-add units and uses the Explicitly Parallel Instruction
Computing (EPIC) paradigm. Contrary to traditional scalar processors, there is
no out-of-order execution. Instead, compilers are required to identify and exploit
instruction level parallelism. Today clock frequencies of up to 1.6 GHz and on-
chip caches with up to 9 MBytes are available. The basic building block of
the Altix is a 2-way SMP node offering 6.4 GByte/s memory bandwidth to
both CPUs, i.e. a balance of 0.06 Word/Flop per CPU. The SGI Altix3700Bx2
(SGI Altix3700) architecture as used for the BEST (LE SOCC ) application is
based on the NUMALink4 (NUMALink3) interconnect, which provides up to
3.2 (1.6) GByte/s bidirectional interconnect bandwidth between any two nodes
and latencies as low as 2 microseconds. The NUMALink technology allows to
build up large powerful shared memory nodes with up to 512 CPUs running
a single Linux OS.
The benchmark results presented in this paper were measured on the NEC
SX-8 system (576 CPUs) at High Performance Computing Center Stuttgart
(HLRS), the SGI Altix3700Bx2 (128 CPUs, 1.6 GHz/6 MB L3) at Leibniz
Rechenzentrum M¨unchen (LRZ) and the SGI Altix3700 (128 CPUs, 1.5 GHz/6
MB L3) at CSAR Manchester.
All performance numbers are given either in GFlop/s or, especially for the
lattice Boltzmann application, in MLup/s (Mega Lattice Site Updates per
Second), which is a handy unit for measuring the performance of LBM.
3 Finite-Volume-Code LESOCC
3.1 Background and Implementation
The CFD code LE SOCC was developed for the simulation of complex turbulent
flows using either the methodology of direct numerical simulation (DNS), large-
eddy simulation (LES), or hybrid LES-RANS coupling such as the detached-eddy
simulation (DES).
LES OCC is based on a 3-D finite-volume method for arbitrary non-orthogonal
and non-staggered, block-structured grids [6, 7, 8, 9]. The spatial discretization of
all fluxes is based on central differences of second-order accuracy. A low-storage
multi-stage Runge-Kutta method (second-order accurate) is applied for time-
marching. In order to ensure the coupling of pressure and velocity fields on non-
staggered grids, the momentum interpolation technique is used. For modeling
the non-resolvable subgrid scales, a variety of different models is implemented,
cf. the well-known Smagorinsky model [13] with Van Driest damping near solid
walls and the dynamic approach [14, 15] with a Smagorinsky base model.
Please purchase PDF Split-Merge on www.verypdf.com to remove this watermark.
28 P. Lammers et al.
LES OCC is highly vectorized and additionally parallelized by domain de-
composition using MPI. The block structure builds the natural basis for grid
partitioning. If required, the geometric block structure can be further subdi-
vided into a parallel block structure in order to distribute the computational
load to a number of processors (or nodes).
Because the code was originally developed for high-performance vector com-
puters such as CRAY, NEC or Fujitsu, it achieves high vectorization ratios
(> 99.8%). In the context of vectorization, three different types of loop struc-
tureshavetobedistinguished:
• Loops running linearly over all internal control volumes in a grid block (3-D
volume data) and exhibit no data dependencies. These loops are easy to
vectorize, their loop length is much larger than the length of the vector
registers and they run at high performance on all vector architectures. They
show up in large parts of the code, e.g. in the calculation of the coefficients
and source terms of the linearized conservation equations.
• The second class of loops occurs in the calculation of boundary conditions.
Owing to the restriction to 2-D surface data, the vector length is shorter
than for the first type of loops. However, no data dependence prevents the
vectorization of this part of the code.
• The most complicated loop structure occurs in the solver for the linear sys-
tems of equations in the implicit part of the code. Presently, we use the
strongly implicit procedure (SIP) of Stone [16], a variant of the incomplete
LU (ILU) factorization. All ILU type solvers of standard form are affected by
recursive references to matrix elements which would in general prevent vector-
ization. However, a well-known remedy for this problem exists. First, we have
to introduce diagonal planes (hyper-planes) defined by i + j + k = constant,
where i, j,andk are the grid indices. Based on these hyper-planes we can
decompose the solution procedure for the whole domain into one loop over
all control volumes in a hyper-plane where the solution is dependent only on
the values computed in the previous hyper-plane and an outer do-loop over
the i
max
+ j
max
+ k
max
− 8hyper-planes.
3.2 Performance of LESOCC
The most time-consuming part of the solution procedure is usually the implemen-
tation of the incompressibility constraint. Profiling reveals that LE SOCC spends
typically 20–60% of the total runtime in the SIP-solver, depending on the actual
flow problem and computer architecture. For that reason we have established
a benchmark kernel for the SIP-solver called SipBench [17], which contains the
performance characteristics of the solver routine and is easy to analyze and mod-
ify. In order to test for memory bandwidth restrictions we have also added an
OpenMP parallelization to the different architecture-specific implementations.
In Fig. 1 we show performance numbers for the NEC SX-8 using a hyper-
plane implementation together with the performance of the SGI Altix which
uses a pipeline-parallel implementation (cf. [11]) on up to 16 threads. On both
Please purchase PDF Split-Merge on www.verypdf.com to remove this watermark.
Vectors, Attack of the Killer Micros 29
Fig. 1. Performance of SipBench for different (cubic) domains on SGI Altix using up
to 16 threads and on NEC SX-8 (single CPU performance only)
machines we observe start-up effects (vector pipeline or thread synchronisation),
yielding low performance on small domains and saturation at high performance
on large domains. For the pipeline-parallel (SGI Altix) 3-D implementation
a maximum performance of 1 GFlop/s can be estimated theoretically, if we
assume that the available memory bandwidth of 6.4 GByte/s is the limiting fac-
tor and caches can hold at least two planes of the 3D domain for the residual
vector. Since two threads (sharing a single bus with 6.4 GByte/s bandwidth)
come very close (800 MFlop/s) to this limit we assume that our implementation
is reasonably optimized and pipelining as well as latency effects need not be
further investigated for this report.
For the NEC SX-8 we use a hyper-plane implementation of the SIP-solver.
Compared to the 3-D implementation additional data transfer from main mem-
ory and indirect addressing is required. Ignoring the latter, a maximum per-
formance of 6–7 GFlop/s can be expected on the NEC SX-8. As can be seen
from Fig. 1, with a performance of roughly 3.5 GFlop/s the NEC system falls
short of this expectation. Removing the indirect addressing one can achieve
up to 5 GFlop/s, however at the cost of substantially lower performance for
small/intermediate domain sizes or non-cubic domains. Since this is the appli-
cation regime for our LE SOCC benchmark scenario we do not discuss the latter
version in this report. The inset of Fig. 1 shows the performance impact of slight
changes in domain size. It reveals that solver performance can drop by a fac-
tor of 10 for specific memory access patterns, indicating severe memory bank
conflicts.
The other parts of LES OCC perform significantly better, liftig the total single
processor performance for a cubic plane channel flow scenario with 130
3
grid
Please purchase PDF Split-Merge on www.verypdf.com to remove this watermark.
30 P. Lammers et al.
points to 8.2 GFlop/s on the SX-8. Using the same executable we measured
a performance of 4.8 GFlop/s GFlop/s on a single NEC SX-6+ processor, i.e.
the SX-8 provides a speedup of 1.71 which is in line with our expectations based
on the pure hardware numbers.
For our strong scaling parallel benchmark measurements we have chosen
a boundary layer flow over a flat plate with 11 × 10
6
grid points and focus on
moderate CPU counts (6, 12 and 24 CPUs), where the domain decomposition
for LE SOCC can be reasonably done. For the 6 CPU run the domain was cut
in wall-normal direction only; at 12 and 24 CPUs streamwise cuts have been
introduced, lowering the communication-to-computation ratio.
The absolute parallel performance for the NEC SX-8 and the SGI Altix
systems is depicted in Fig. 2. The parallel speedup on the NEC machine is
obviously not as perfect as on the Altix system. Mainly two effects are responsible
for this behavior. First, the baseline measurements with 6 CPUs were done in
a single node on the NEC machine ignoring the effect of communication over
the IXS. Second, but probably more important the single CPU performance
(cf. Table 1) of the vector machine is almost an order of magnitude higher
than on the Itanium 2 based system, which substantially increases the impact
of communication on total performance due to strong scaling. A more detailed
profiling of the code further reveals that also the performance of the SIP-solver is
reduced with increasing CPU count on the NEC machine due to reduced vector
length (i.e. smaller domain size per CPU).
The single CPU performance ratio between vector machine and cache based
architecture is between 7 and 9.6. Note that we achieve a L3 cache hit ratio of
roughly 97% (i.e. each data element loaded from main memory to cache can be
Fig. 2. Speedup (strong scaling) for a boundary layer flow with 11 × 10
6
grid points
up to 24 CPUs
Please purchase PDF Split-Merge on www.verypdf.com to remove this watermark.
Vectors, Attack of the Killer Micros 31
Table 1. Fraction of the SIP-solver and its performance in comparison of the overall
performance. Data from the boundary layer setup with 24 CPUs
Time SIP-solver L3 cache-hit LESOCC
CPUs SIP-solver GFlop/s/CPU rate GFlop/s/CPU
Platform
(%) (%)
Intel Itanium 2 24 25 0.39 97 0.73
(1.6 GHz)
NEC SX-8 (2 GHz) 6 31.5 3.25 — 7.02
NEC SX-8 (2 GHz)
12 32.9 2.83 — 6.6
NEC SX-8 (2 GHz) 24 33.6 2.5 — 5.2
reused at least once from cache), which is substantially higher than for purely
memory bound applications.
4 Lattice Boltzmann Code BEST
4.1 Background and Implementation
The original motivation for the development of BEST was the ability of the lat-
tice Boltzmann method to handle flows through highly complex geometries very
accurately and efficiently. This refers not only to the flow simulation itself but
also to the grid generation which can be done quite easily by using the “marker
and cell” approach. Applying the method also to the field of numerical simula-
tion (DNS or LES) of turbulence might be further justified by the comparatively
very low effort per grid point. In comparison to spectral methods the effort is
lower at least by a factor of five [10]. Furthermore, the method is based on highly
structured grids which is a big advantage for exploiting all kinds of hardware
architectures efficiently. On the other hand this might imply much larger grids
than normally used by classical methods.
The widely used class of lattice Boltzmann models with BGK approximation
of the collision process [18, 19, 20] is based on the evolution equation
f
i
(x + e
i
δt, t + δt)=f
i
(x,t) −
1
τ
[f
i
(x,t) − f
eq
i
(ρ, u)] ,i=0...N . (1)
Here, f
i
denotes the particle distribution function which represents the fraction
of particles located in timestep t at position x and moving with the microscopic
velocity e
i
. The relaxation time τ determines the rate of approach to local equi-
librium and is related to the kinematic viscosity of the fluid. The equilibrium
state f
eq
i
itself is a low Mach number approximation of the Maxwell-Boltzmann
equilibrium distribution function. It depends only on the macroscopic values of
the fluid density ρ and the flow velocity u. Both can be easily obtained as first
moments of the particle distribution function.
The discrete velocity vectors e
i
arise from the N chosen collocation points of
the velocity-discrete Boltzmann equation and determine the basic structure of
Please purchase PDF Split-Merge on www.verypdf.com to remove this watermark.
32 P. Lammers et al.
the numerical grid. We choose the D3Q19 model [18] for discretization in 3-D,
which uses 19 discrete velocities (collocation points) and provides a computa-
tional domain with equidistant Cartesian cells (voxels).
Each timestep (t → t + δt) consists of the following steps which are repeated
for all cells:
• Calculation of the local macroscopic flow quantities ρ and u from the distri-
bution functions, ρ =
N
i=0
f
i
and u =
1
ρ
N
i=0
f
i
e
i
.
• Calculation of the equilibrium distribution f
eq
i
from the macroscopic flow
quantities (see [18] for the equation and parameters) and execution of the
“collision” (relaxation) process, f
∗
i
(x,t
∗
)=f
i
(x,t) −
1
τ
[f
i
(x,t) − f
eq
i
(ρ, u)],
where the superscript * denotes the post-collision state.
• “Propagation” of the i =0...N post-collision states f
∗
i
(x,t
∗
)totheap-
propriate neighboring cells according to the direction of e
i
, resulting in
f
i
(x + e
i
δt, t + δt), i.e. the values of the next timestep.
The first two steps are computationally intensive but involve only values of the
local node while the third step is just a direction-dependent uniform shift of
data in memory. A fourth step, the so called “bounce back” rule [19, 20], is
incorporated as an additional part of the propagation step and “reflects” the
distribution functions at the interface between fluid and solid cells, resulting in
an approximate no-slip boundary condition at walls.
Of course the code has to be vectorized for the SX. This can easily be done
by using two arrays for the successive time steps. Additionally, the collision and
the propagation step are collapsed in one loop. This reduces transfers to main
memory within one time step. Consequently B =2× 19 × 8Byteshavetobe
transferred per lattice site update. The collision itself involves roughly F = 200
floating point operations per lattice site update. Hence one can estimate the
achievable theoretical peak performance from the basic performance character-
istics of an architecture such as memory bandwidth and peak performance. If
performance is limited by memory bandwidth, this is given by P =MemBW/B
or by P = PeakPerf/F if it is limited by the peak performance.
4.2 Performance of BEST
The performance limits imposed by the hardware together with the measured
performance value can be found in Table 2. Whereas Itanium 2 is clearly lim-
ited by its memory bandwidth, the SX-8 ironically suffers from its “low peak
performance”.ThisistruefortheNECSX-6+aswell.
In Fig. 3 single and parallel performance of BEST on the NEC SX-8 are
documented. First of all, the single CPU performance is viewed in more detail
regarding the influence of vector length. The curve for one CPU shows CPU
efficiency versus domain size, the latter being proportional to the vector length.
For the turbulence applications under consideration in this report, the relevant
application regime starts at grid sizes larger than 10
6
points. As expected, the
performance increases with increasing vector length and saturates at an efficiency
Please purchase PDF Split-Merge on www.verypdf.com to remove this watermark.