Bertoline introduction graphics communications engineers 4th txtbk
Bạn đang xem bản rút gọn của tài liệu. Xem và tải ngay bản đầy đủ của tài liệu tại đây (6.3 MB, 258 trang )
www.elsolucionario.net
ber22643_fm_i-vi.qxd
03/20/2008
6:52 am
Page i pinnacle 206:MHDQ040:ber04%:ber04chfm:
Introduction to
Graphics Communications
for Engineers
Fourth Edition
Gary R. Bertoline
Purdue University
With Contributions From:
Nathan Hartman, Purdue University
William Ross, Purdue University
www.elsolucionario.net
ber22643_fm_i-vi.qxd
03/20/2008
6:52 am
Page iii pinnacle 206:MHDQ040:ber04%:ber04chfm:
About the Author
Gary R. Bertoline is
Professor of Computer
Graphics Technology at
Purdue University and
director of the Envision
Center for Data Perceptualization. He earned his
B.S. degree in Industrial
Technology at Northern
Michigan University in
1974, M.Ed. in Industrial
Technology at Miami
University in 1979, and
Ph.D. at The Ohio State
Gary R. Bertoline
University in Industrial
Technology in 1987. His graduate work focused on the
integration of CAD into engineering graphics and visualization. He has 25 years’ experience teaching graphics at all
levels from elementary school to senior citizens. Prof.
Bertoline taught junior high and high school graphics at St.
Henry High School, St. Henry, Ohio; drafting/ design technology at Wright State University, Lake Campus, Celina,
Ohio; and engineering graphics at The Ohio State University, Columbus, Ohio.
Prof. Bertoline has authored numerous publications,
authored or coauthored 10 textbooks and workbooks, and
made over 100 presentations throughout the world. He
has won the Frank Oppenheimer Award three times for
best paper at the Engineering Design Graphics Division
Mid-year Meeting. He has developed many graphics
courses, including CAD, solid modeling, multimedia, and
virtual reality, and has integrated many modern topics into
traditional engineering graphics courses, such as modeling, animation, and visualization. Prof. Bertoline has conducted research in cognitive visualization and was the
co-author for a curriculum study in engineering graphics
funded by SIGGRAPH. He is on the editorial board for
the Journal for Geometry and Graphics and is the
McGraw-Hill Graphics Series Editor. He was the recipient
of the Orthogonal Medal for outstanding contributions to
the advancement of Graphic Science by North Carolina
State University in 1992, and the 1995 inaugural recipient
of the Steve M. Slaby International Award for Outstanding Contributions in Graphics Education. You can contact
Dr. Bertoline at
iii
www.elsolucionario.net
ber22643_fm_i-vi.qxd
3/21/08
4:35 PM
Page iv ppg 206:MHDQ040:ber04%:ber04chfm:
Contents
4
About the Author, iii
Preface, v
1
Objectives, 127
4.1 Dimensioning, 127
4.2 Size and location dimensions, 127
4.3 Detail Dimensioning, 134
4.4 Tolerancing, 139
4.5 Tolerance Representation, 139
4.6 Thread Notes, 145
Questions for Review, 147
Problems, 148
Introduction to Graphics
Communications, 1
Objectives, 1
1.1 Introduction, 1
1.2 Technical Drawing Tools, 3
1.3 Computer-Aided Drawing Tools, 5
1.4 Traditional Tools, 5
1.5 Media, 6
1.6 Alphabet of Lines, 6
1.7 What You Will Learn, 8
1.8 Future Trends, 8
Problems, 10
2
5
Section and Auxiliary
Views, 80
Reading and Constructing
Working Drawings, 155
Objectives, 155
5.1 Basic Concepts, 155
5.2 Working Drawings, 156
Questions for Review, 166
Problems, 166
Sketching and Text, 17
Objectives, 17
2.1 Technical Sketching, 17
2.2 Sketching Technique, 21
2.3 Proportions and Construction Lines, 29
2.4 Introduction to Projections, 30
2.5 Multiview Sketching Technique, 45
2.6 Multiview Sketches, 47
2.7 Perspective Projection, 51
2.8 Lettering, 56
Questions for Review, 57
Problems, 57
3
Dimensioning and Tolerancing
Practices, 127
6
Design and 3-D Modeling, 185
Objectives, 185
6.1 Engineering Design, 185
6.2 3-D Modeling, 187
6.3 Constraint-Based Modeling, 191
6.4 Feature-Based Modeling, 193
6.5 3-D Modeling and the Design Process, 194
Questions for Review, 194
Problems, 196
SUPPLEMENT Design Problems, 213
Objectives, 80
3.1 Sectioning Basics, 80
3.2 Cutting Plane Lines, 84
3.3 Section Line Practices, 84
3.4 Section View Types, 87
3.5 Special Sectioning Conventions, 93
3.6 Auxiliary View Projection Theory, 96
Questions for Review, 103
Problems, 103
Additional Problems and Worksheets, 221
Index, 249
iv
www.elsolucionario.net
ber22643_fm_i-vi.qxd
03/20/2008
6:52 am
Page v pinnacle 206:MHDQ040:ber04%:ber04chfm:
Preface
Introduction to Graphics Communications for Engineers,
Fourth Edition, is part of the McGraw-Hill’s BEST (Basic
Engineering Series and Tools), which introduces engineering students to various topics and skills important to their
education. This workbook is an introduction to the standard practices used by engineers to communicate graphically. The primary goal of this text is to assist engineering
students in learning the techniques and standards of communicating graphically so that design ideas can be clearly
communicated and produced.
The text concentrates on the concepts and skills needed
to sketch and create 2-D drawings and 3-D CAD models.
Engineering graphics has gone through significant
changes in the last decade as a result of the use of computers and CAD software. It seems as if some new hardware
or software development has an impact on engineering
graphics every year. Although these changes are important to the subject of technical graphics, there is much
about the subject that has not changed. Engineers still find
it necessary to communicate and interpret design ideas
through the use of graphical methods such as sketches and
CAD drawings and models. As powerful as today’s computers and CAD software have become, they are of little
use to engineers who do not fully understand fundamental
graphics communications principles and 3-D modeling
strategies, or who lack high-level visualization skills.
The workbook is divided into six chapters with multiple
units of instruction. Chapter 1, “Introduction to Graphics
Communications,” is an introduction to graphics communications as a language for engineers and describes the
tools used and some of the techniques for communicating
graphically. Chapter 2, “Sketching and Text,” is an introduction to sketching technique, projection theory,
visualization, and the use of text on drawings. Chapter 3,
“Section and Auxiliary Views,” introduces the student to
the use of and technique for creating sectioned drawings
and models and auxiliary views. Chapter 4, “Dimensioning and Tolerancing Practices,” describes how to create
and read dimensional drawings. Chapter 5, “Reading and
Constructing Working Drawings,” describes how to read
and produce working drawings. Finally, Chapter 6,
“Design and 3-D Modeling,” is an overview of 3-D modeling techniques and the engineering design process.
Outstanding features of the fourth edition include:
• New Design Problems were developed to provide students an opportunity to exercise the various stages of
the design process. The problems provide an ideation
stage, a decision-making stage, design creation stage,
and the documentation stage. Each problem includes
provisions for sketching, 3-D modeling, and documentation of the student’s final solution to the problem.
• Supplemental Solid Modeling Exercise—A new
exercise focusing on 3-D solid modeling for parts and
assemblies has been developed. Visual examples for
each part and assembly have been created with various
solid modeling software packages and are included with
engineering sketches to aid students in visualizing part
geometry and the modeling process.
• Design in Industry Boxes, containing some aspect of
design from industry, are featured in this edition. Students will learn how design is done in the real world
from these interesting stories presented by practicing
engineers and technologists.
• Practice Problems are included throughout each chapter in the fourth edition. These problems give students
an opportunity to get drawing practice as they work
through concepts.
• End-of-Chapter Sketching Problems reinforce what
students are learning in the chapter.
• Student-Friendly Pedagogy includes: a list of objectives at the beginning of chapters, step-by-step instructions on how to draw, and a wide assortment of
problems that can be assigned to reinforce concepts.
Sketching worksheets have been integrated into the
end of each chapter. These worksheets can be used for
sketching assignments to augment assignments using
v
www.elsolucionario.net
ber22643_fm_i-vi.qxd
vi
03/20/2008
6:52 am
Page vi pinnacle 206:MHDQ040:ber04%:ber04chfm:
Preface
CAD. After completing the workbook, the student will
be able to create design sketches using various projection techniques, create and read 2-D standard engineering drawings, and create and visualize 3-D computer
models.
Thanks to James Mohler and Amy Fleck for their work
on the illustrations, Jim Leach for some of the drawing
problems added in the second edition and Robert Geenlee,
University of New Mexico, and Hodge E. Jenkins, Mercer
University, for their feedback on the third edition. Special
thanks to Professors Nathan Hartman and William Ross
from Purdue University for their contributions to this
edition of the book.
Gary R. Bertoline, PhD
Professor Computer Graphics Technology
Purdue University
West Lafayette, IN
For Ada, Bryan, Kevin, and Carolyn, who are my motivation and inspiration for all my books.
www.elsolucionario.net
ber22643_ch01_001-016.qxd
03/19/2008
8:01 pm
Page 1 pinnacle 206:MHDQ040:ber04%:ber04ch01:
Chapter
1
Introduction to
Graphics Communications
OBJECTIVES
After completing this chapter, you will be able to:
1. Describe why technical drawings are an effective
communications system for technical ideas about
designs and products.
2. Identify important parts of a CAD system.
3. Identify important traditional tools.
4. Identify standard metric and U.S. drawing sheet sizes.
5. Identify the types and thicknesses of the various lines
in the alphabet of lines.
1.1 INTRODUCTION
Graphics communications using engineering drawings and
models is a language—a clear, precise language—with
definite rules that must be mastered if you are to be successful in engineering design. Once you know the language of graphics communications, it will influence the
way you think, the way you approach problems. Why?
Because humans tend to think using the languages they
know. Thinking in the language of technical graphics, you
will visualize problems more clearly and will use graphic
images to find solutions with greater ease.
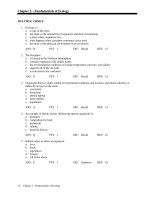
In engineering, 92 percent of the design process is
graphically based. The other 8 percent is divided between
mathematics and written and verbal communications.
Why? Because graphics serves as the primary means of
communication for the design process. Figure 1.1 shows a
breakdown of how engineers spend their time. 3-D
modeling and documentation, along with design modeling, comprise more than 50 percent of the engineer’s time
and are purely visual and graphical activities. Engineering
analysis depends largely on reading technical graphics,
and manufacturing engineering and functional design also
require the production and reading of graphics.
Why do graphics come into every phase of the engineer’s
job? To illustrate, look at the jet aircraft in Figure 1.2. Like
1
www.elsolucionario.net
ber22643_ch01_001-016.qxd
2
03/19/2008
8:01 pm
Page 2 pinnacle 206:MHDQ040:ber04%:ber04ch01:
Introduction to Graphics Communications for Engineers
3-D Modeling and Documentation
Manufacturing Engineering
Functional Design
Engineering Analysis
Other
0
5
10
15
20
25
30
Figure 1.1 A Total View of Engineering Divided into Its
Major Activities
Graphics plays a very important role in all areas of engineering;
for documentation, communications, design, analysis, and
modeling. Each of the activities listed is so heavily slanted
toward graphics communications that engineering is 92 percent
graphically based. (Courtesy of RealD Stereographics)
any new product, it was designed for a specific task and
within specified parameters; however, before it could
be manufactured, a 3-D model and engineering drawings
like that shown in Figure 1.3 had to be produced. Just
imagine trying to communicate all the necessary details
verbally or in writing. It would be impossible!
A designer has to think about the many features of an
object that cannot be communicated with verbal descriptions (Figure 1.4). These thoughts are dealt with in the mind
of the designer using a visual, nonverbal process. This
“visual image in the mind” can be reviewed and modified
to test different solutions before it is ever communicated to
someone else. As the designer draws a line on paper or creates a solid cylinder image with a computer, he or she is
translating the mental picture into a drawing or model that
will produce a similar picture in the mind of anyone who
sees the drawing. This drawing or graphic representation is
the medium through which visual images in the mind of the
designer are converted into the real object.
Technical graphics can also communicate solutions to
technical problems. Such technical graphics are produced
according to certain standards and conventions so they
can be read and accurately interpreted by anyone who has
learned those standards and conventions.
The precision of technical graphics is aided by tools;
some are thousands of years old and still in use today, and
others are as new and rapidly changing as computer-aided
design/drafting (CAD). This book will introduce you to the
Figure 1.2
This jet aircraft would be impossible to create without computer
graphics models and drawings. Drawings are the road maps that
show how to manufacture or build products and structures.
(© Boeing)
standards, conventions, techniques, and tools of technical
graphics and will help you develop your technical skills so
that your design ideas become a reality.
Engineers are creative people who use technical means
to solve problems. They design products, systems, devices,
and structures to improve our living conditions. Although
problem solutions begin with thoughts or images in the
mind of the designer, presentation devices and computer
graphics hardware and software are powerful tools for
communicating those images to others. They can also aid
the visualization process in the mind of the designer. As
computer graphics have a greater impact in the field of
engineering, engineers will need an ever-growing understanding of and facility in graphics communications.
Practice Exercise 1.1
1. Try to describe the part shown in Figure 1.15 using written instructions. The instructions must be of such detail
that another person can make a sketch of the part.
2. Now try verbally describing the part to another person.
Have the person make a sketch from your instructions.
These two examples will help you appreciate the difficulty in
trying to use written or verbal means to describe even simple
mechanical parts. Refer to Figure 1.3 and others in this text to
get an idea of how complicated some parts are compared
with this example. It is also important to note that air and
water craft have thousands of parts. For example, the nuclear
powered Sea Wolf class submarine has more than two million
parts. Try using verbal or written instructions to describe that!
www.elsolucionario.net
ber22643_ch01_001-016.qxd
3/6/08
10:24 PM
Page 3 ppg 206:MHDQ040:ber04%:ber04ch01%0:
3
CHAPTER 1 Introduction to Graphics Communications
162Y259
PART NUMBER
GROUP
A
QUANTITY
SYMBOL
PIECE
OF
GROUP
DRAWING NO.
NAME OF PART
1
126257
20
U - BOLT
1
2
K
FRAME
3Y104
MATERIAL
A
2
HEX NUT
C
2
LOCK WASHER
D
1
PIPE NIPPLE
1
1041Y33
1
E
FRAME
F
PIPE COUPLING
G
342
G
C
D
300
B
BABBITED
44
26
∅12
.25—18 NPT
24
E
F
152
A
B
38
50
R
W
R
L
R N R
DIMENSION TOLERANCES EXCEPT AS SPECIFIED
TITLE
DRAWING
No. 198
HANGAR ASSEMBLY
CHECKED
APPROVED
C
R
J
C
BRONZE CAP NOTE ADDED
E.F.C.
R
D
B
PART No. 283Y112-C ADDED
R.C.
R
T
A
I
M
GROUP B, NOTES & DIMENSIONS FOR
GROUP C, REMOVED - FRAME WAS
1041 Y 33 - B FOR GROUP C ONLY C.W.
O
R
REV
FORM
DATE
SCALE
LINK - BELT COMPANY
DATE
DESCRIPTION OF REVISION
REFERENCE
162Y259
Figure 1.3
Engineering Drawing
Engineering drawings and computer models such as these were needed to produce the hanger assembly shown. The 3-D
model is used to design and visualize the hanger. The engineering drawings are used to communicate and document the
design process.
1.2
TECHNICAL DRAWING TOOLS
Just as the graphics language has evolved over the years into
a sophisticated set of standards and conventions, so have the
tools used to graphically communicate technical ideas.
Tools are used to produce three basic types of drawings:
freehand sketches, instrument drawings, and computer
drawings and models. The tools have evolved from pencils,
triangles, scales, and compasses to computer-aided
design/drafting (CAD) systems. CAD is computer software and related computer hardware that supplements or
replaces traditional hand tools for creating models and technical drawings (Figure 1.5).
Since many industries have not fully integrated CAD
into their design offices, it is necessary to learn both traditional and computer design methods. Also, traditional tools
are used for sketching, which is one of the most effective
methods available to represent design ideas quickly.
www.elsolucionario.net
ber22643_ch01_001-016.qxd
04/01/2008
9:42 pm
Page 4 pinnacle Hard Disk:Desktop Folder:
Design in Industry
Going Virtual
Virtual reality and simulation software tools hold the promise of drastically slashing product development costs
through the elimination of expensive physical prototypes.
With costs for the latest virtual reality (VR) tools and simulation systems coming down, automotive and aerospace
manufacturers increasingly are seeking to deploy sophisticated, collaborative visualization systems throughout their
product development planning organizations, as well as
using virtual simulations for designing overall plant layouts
and within manufacturing cells.
Although VR tools historically have been the domain of
researchers, commercial applications in automotive, aerospace, and medical device manufacturing are becoming
much more common. Using VR systems like the CAVE
(Computer Automated Visualization Environment), developed in the early 1990s by the Electronic Visualization Laboratory at the University of Illinois at Chicago (EVL, UIC),
automakers and aircraft manufacturers can review realistic
virtual model prototypes, avoiding the expense of $200,000
for a fiberglass auto prototype to upwards of $3 million for
an aircraft prototype.
Over the past few years, the addition of more realistic visualization software also has furthered VR’s acceptance, with
efforts like the partnership between software developer Engineering Animation Inc. (Ames, IA), workstation supplier Silicon
Graphics Inc. (Mountain View, CA), and General Motors Corp.
(Detroit) offering EAI’s VisConcept, a software suite providing
a true 1:1, or human-scale, immersive visualization environment. In addition, projection and display technologies have
improved to the point where it’s possible to easily create highresolution stereoscopic images—seeing an image in each eye
with depth and volume just as in the real world.
Collaborative visualization may represent a new
opportunity to manufacturers, particularly in the automotive industry where many major auto manufacturers are trying to persuade their top suppliers to adopt visualization
technology. Large-scale displays like the WorkWall enable
manufacturing teams to collaborate in much the same way
they used to work around drafting tables, but with realistic,
full-scale 3-D models.
Copyright Notice: Copyright by Society of Manufacturing Engineers. All rights
retained. This article may only be viewed or printed one (1) time for personal use.
User may not save any text or graphical items to hard drives or duplicate this
article in whole or in part in any medium. Excerpts from this article appear with
permission from Manufacturing Engineering ®the official publication of the
Society of Manufacturing Engineers (SME). www.sme.org.
With Fakespace Systems’ WorkWall, Teams Can View
Realistic Stereoscopic Images During Product Development
Team Design Reviews.
Users of the Fakespace Wall Can Review Styling and
Component Changes on Virtual Models before Committing
to Final Product Designs.
(Courtesy of Fakespace Systems Inc., A Mechdyne Company)
(Courtesy of Fakespace Systems, Inc., A Mechdyne Company)
4
www.elsolucionario.net
ber22643_ch01_001-016.qxd
03/19/2008
8:01 pm
Page 5 pinnacle 206:MHDQ040:ber04%:ber04ch01:
CHAPTER 1 Introduction to Graphics Communications
5
commands replace the compass, line commands replace
the T-square and triangles, and editing commands replace
the dividers and erasing shield.
A CAD system consists of hardware devices used in
combination with specific software. The hardware for a
CAD system consists of the physical devices used to support
the CAD software. There are many different hardware manufacturers and types of hardware devices, all of which are
used to create, store, or output technical drawings and models. It is not uncommon in industry to have multiple input,
storage, and output devices for a CAD system.
1.4
Figure 1.4
Engineering Drawings Used for
Communications
Engineering drawings are a nonverbal method of communicating information. Descriptions of complex products or
structures must be communicated with drawings. A designer
uses a visual, nonverbal process. A visual image is formed in
the mind, reviewed, modified, and is ultimately communicated
to someone else, all using visual and graphics processes.
(© Charles Thatcher/Getty Images)
1.3
COMPUTER-AIDED DRAWING TOOLS
Traditional tools will continue to be useful for sketching
and rough layout work; however, good CAD software can
create virtually any type of technical drawing. Circle
Figure 1.5
CAD Workstations
Typical CAD workstations used in industry have large color
monitors. (© Bill Aron/Photo Edit, Inc.)
TRADITIONAL TOOLS
The traditional tools used to create technical drawings
have evolved over time. Many tools were originally used
in ancient Greece to study and develop geometry.
Although computers may someday replace the need for
some traditional tools, they are still useful today for drawing, and more importantly, for sketching. Traditional
tools are devices used to assist the human hand in making
technical drawings. The assistance includes drawing lines
straighter, making circles more circular, and increasing
the speed with which drawings are made. The tools typically used to create mechanical drawings or sketches
(Figure 1.6) consist of the following:
1. Wood and mechanical pencils
2. Instrument set, including compass and dividers
3. 45- and 30/60-degree triangles
Figure 1.6
Traditional Tools
These are some of the many traditional mechanical drawing
tools used for engineering drawings. (Courtesy of Staedtler, Inc.)
www.elsolucionario.net
ber22643_ch01_001-016.qxd
6
3/6/08
10:24 PM
Page 6 ppg 206:MHDQ040:ber04%:ber04ch01%0:
Introduction to Graphics Communications for Engineers
4.
5.
6.
7.
8.
9.
10.
1.5
Table 1.1
Scales
Irregular curves
Protractors
Erasers and erasing shields
Drawing paper
Circle templates
Isometric templates
ANSI Standard Sheet Sizes
Metric (mm)
A4 210 × 297
A3 297 × 420
A2 420 × 594
A1 594 × 841
A0 841 × 1189
U.S. Standard
Architectural
A-Size 8.5′′ × 11′′
B-Size 11′′ × 17′′
C-Size 17′′ × 22′′
D-Size 22′′ × 34′′
E-Size 34′′ × 44′′
9′′ × 12′′
12′′ × 18′′
18′′ × 24′′
24′′ × 36′′
36′′ × 48′′
MEDIA
Media are the surfaces upon which an engineer or technologist communicates graphical information. The media
used for technical drawings are different types or grades
of paper, such as tracing paper, vellum, and polyester
film. Tracing paper is a thin, translucent paper used for
detail drawings. Vellum is a tracing paper chemically
treated to improve translucency. Polyester film, or its
trade name Mylar, is transparent, waterproof, and difficult
to tear. Mylar can be used for lead pencil, plastic-lead
pencil, or ink drawings. Mylar is an excellent drawing
surface that leaves no trace of erasure.
Special papers have also been developed for CAD
plotters. For example, plotter paper used for fiber-tipped
pens has a smooth or glossy surface to enhance line definition and minimize skipping. Often, the paper comes
with a preprinted border, title block, and parts list
(Figure 1.7).
The American National Standards Institute (ANSI) has
established standard sheet sizes and title blocks for the media
used for technical drawings. Each paper size is designated by
a letter, as shown in Table 1.1, and title block sizes are shown
in Figure 1.16 at the end of the chapter.
Figure 1.7
Preprinted Title Blocks
Preprinted standard borders and title blocks on drafting paper
are commonly used in industry. (Courtesy of Alvin & Company.)
1.6
ALPHABET OF LINES
The alphabet of lines is a set of standard linetypes established by the American Society of Mechanical Engineers
(ASME) for technical drawing. Figure 1.8 shows the
alphabet of lines and the approximate dimensions used to
create different linetypes, which are referred to as
linestyles when used with CAD. ASME Y14.2M1992 has established these linetypes as the standard for
technical drawings. Two line weights are sufficient to
follow the standards, a 0.6 mm and a 0.3 mm. These
approximate widths are intended to differentiate between
thin and thick lines and are not for control of acceptance
or rejection of drawings. Thick lines are drawn using soft
lead, such as F or HB. Thin lines are drawn using a harder lead, such as H or 2H. Construction lines are very light
and are drawn using 4H or 6H lead. A good rule of thumb
for creating construction lines is to draw them so that they
are difficult to see if your drawing is held at arm’s length.
Following are the standard linetypes and their applications in technical drawings:
Center lines are used to represent symmetry and
paths of motion and to mark the centers of circles and
the axes of symmetrical parts, such as cylinders
and bolts.
Break lines come in two forms: a freehand thick line
and a long, ruled thin line with zigzags. Break lines are
used to show where an object is broken to save drawing space or reveal interior features.
Dimension and extension lines are used to indicate
the sizes of features on a drawing.
Section lines are used in section views to represent
surfaces of an object cut by a cutting plane.
Cutting plane lines are used in section drawings to
show the locations of cutting planes.
Visible lines are used to represent features that can be
seen in the current view.
Hidden lines are used to represent features that cannot
be seen in the current view.
www.elsolucionario.net
ber22643_ch01_001-016.qxd
3/6/08
10:24 PM
Page 7 ppg 206:MHDQ040:ber04%:ber04ch01%0:
CHAPTER 1 Introduction to Graphics Communications
ARROWHEAD .35 mm
DIMENSION LINE .3 mm
7.0
EXTENSION LINE .3 mm
CENTER LINE .3 mm
PHANTOM LINE .3 mm
HIDDEN LINE
.3 mm
CUTTING PLANE LINE .6 mm
CENTER LINE .3 mm
A
SHORT
BREAK LINE .6 mm
CHAIN LINE .6 mm
SECTION LINE .3 mm
A
Ø1.5
VISIBLE LINE .6 mm
NOTE .5 mm
Ø1.5
LEADER .3 mm
SECT. A–A
1
16
1
8
1
.6 mm
.3 mm
CENTER – THIN
VISIBLE LINE – THICK
.6 mm
1
32
SHORT BREAK LINE – THICK
1
8
.3 mm
1
HIDDEN LINE – THIN
.3 mm
LONG BREAK LINE – THIN
1
32
1
8
1
.3 mm
DIMENSION & EXTENSION LINE – THIN
.6 mm
CUTTING PLANE LINE – THICK
.3 mm
SECTION LINE – THIN
1
16
1
4
.6 mm
.3 mm
PHANTOM LINE – THIN
CUTTING PLANE LINE – THICK
.6 mm
.3 mm
STITCH LINE – THIN
CHAIN LINE – THICK
THICK .6 mm
.3 mm
STITCH LINE – THIN
SYMMETRY LINE
Figure 1.8
THIN .3 mm
The Alphabet of Lines
The alphabet of lines is a set of ASME standard linetypes used on technical drawings. The approximate dimensions
shown on some linetypes are used as guides for drawing them with traditional tools. The technical drawing at the top
shows how different linetypes are used in a drawing.
www.elsolucionario.net
7
ber22643_ch01_001-016.qxd
8
3/6/08
10:24 PM
Page 8 ppg 206:MHDQ040:ber04%:ber04ch01%0:
Introduction to Graphics Communications for Engineers
Tools—devices used to create engineering drawings
and models, including both handheld and computer
tools.
Applications—the various uses for technical graphics
in engineering design, such as mechanical, electrical,
and architectural.
AutoCAD® Linestyle Menu Showing Some of
the Linetypes Available
Figure 1.9
(Certain images provided courtesy of Autodesk, Inc. © 2004 All rights reserved.
AutoCAD is a registered trademark of Autodesk, Inc., in the U.S.A. and other
countries.)
Phantom lines are used to represent a movable feature
in its different positions.
Stitch lines are used to indicate a sewing or stitching
process.
Chain lines are used to indicate that a surface is to
receive additional treatment.
Symmetry lines are used as an axis of symmetry for a
particular view.
It is important that you understand and remember these different linetypes and their definitions and uses, because they
are referred to routinely throughout the rest of this book.
CAD software provides different linestyles for creating
standard technical drawings. Figure 1.9 shows the linestyle
menu for a typical CAD system. The thicknesses of lines
on a CAD drawing are controlled by two different means:
(1) controlling the thickness of the lines drawn on the display screen and (2) controlling the plotted output of lines
on pen plotters by using different pen numbers for different linestyles, where different pen numbers have different
thicknesses, such as a 0.7 mm and 0.3 mm.
1.7
WHAT YOU WILL LEARN
In this text, you will learn the six important areas in technical graphics:
Visualization—the ability to mentally control visual
information.
Graphics theory—geometry and projection techniques.
Standards—sets of rules that govern how parts are
made and technical drawings are represented.
Conventions—commonly accepted practices and
methods used for technical drawings.
Each chapter in the text will explain the graphics theory
important for a topic, integrate the visualization practices,
explain the relevant standards and conventions, demonstrate the tools used to create drawings, and apply the topic
to engineering design.
Learning to communicate with drawings is very similar
to learning to write or speak in a language. For someone
inexperienced in technical drawing, the learning process is
very similar to learning a new language. There is a set
of rules that must be learned in order to communicate
graphically or when learning a new language. You will
soon find out that graphics is a very effective method of
supporting the design process.
1.8
FUTURE TRENDS
The convergence of technology, knowledge, and computer hardware and software is resulting in a number of
nontraditional processes that can be used in the engineering design process. These new processes and technologies can extend the circle of people in an organization
who are involved in design. Many of these future trends
are beginning to combine the design and manufacturing
processes into a whole. A few trends even take a more
global approach of attempting to control the entire
enterprise.
1.8.1 Visualization Tools
The sharing of design ideas has always been important for
the engineer. Today, however, the importance of sharing
design ideas with others is even more important. One
technique that is becoming popular is the sharing of
design ideas through various computer graphics techniques. The following is a list in order of realism and
interactivity that can be produced with computer graphics
tools.
• High-resolution rendered images are a static means of
showing initial design ideas (Figure 1.10).
• Computer animations or simulation can also be very
effectively used to share design ideas with others.
www.elsolucionario.net
ber22643_ch01_001-016.qxd
03/19/2008
8:01 pm
Page 9 pinnacle 206:MHDQ040:ber04%:ber04ch01:
CHAPTER 1 Introduction to Graphics Communications
Figure 1.10
9
High-Resolution Rendered Image of a CAD Model
(Courtesy of Simon Floyd Design Group.)
• 3-D stereo graphics can be used to enhance the viewing of static and animated 3-D computer images on the
computer screen (Figure 1.11).
• Holographic and volumetric displays of 3-D computer
images are being developed that allow designers to literally walk around and through the design as it is being
created (Figure 1.12).
• Virtual reality tools can be employed to get an even
higher level of realism by immersing the user in a 3-D
world (Figure 1.13).
• Rapid prototyping systems are used to create
real prototype models directly from CAD models
(Figure 1.14).
Figure 1.11
3-D Stereo Glasses Used to Enhance the
Viewing of CAD Models
Figure 1.12
(Courtesy of Stereographics Corporation)
(© Lou Jones.)
www.elsolucionario.net
Volumetric Display Device
ber22643_ch01_001-016.qxd
10
Figure 1.13
3/6/08
10:24 PM
Page 10 ppg 206:MHDQ040:ber04%:ber04ch01%0:
Introduction to Graphics Communications for Engineers
Stereoscopic Imagery Displayed on a Large
Display
Figure 1.14
(Courtesy of Fakespace Systems, Inc., A Mechdyne Company)
Rapid Prototyping System
(Courtesy of 3D Systems Corp.)
Problems
Use the worksheets provided at the end of this section to
complete the problems.
1.1 Research and report on an important historical figure
in engineering design, such as Henry Ford, Thomas
Edison, the Wright brothers, or Alexander Graham Bell.
1.2 Identify at least five other individuals who worked as
engineers and had an impact on society.
1.3 Research and report on an important historical engineering achievement, such as airplanes, space flight,
computers, or television.
Figure 1.15
1.4 Identify three new products that have appeared on
the market in the last five years.
1.5 Research and report on an important historical figure
in graphics, such as Gaspard Monge, M. C. Escher,
Thomas Edison, Leonardo da Vinci, Albrecht Durer,
or Frank Lloyd Wright.
1.6 To demonstrate the effectiveness of graphics communications, write a description of the object shown in
Figure 1.15. Test your written description by having
someone attempt to make a sketch from your
description.
Problem 1.6 Bearing Block to Be Described Verbally
www.elsolucionario.net
ber22643_ch01_001-016.qxd
3/6/08
10:24 PM
Page 11 ppg 206:MHDQ040:ber04%:ber04ch01%0:
11
CHAPTER 1 Introduction to Graphics Communications
.38
1.25
.38
Title Block for A, B, C.
SIZE
.62
FSCM NO
DWG NO
REV
SCALE
1.75
.38
SHEET
1.50
.25
1.75
4.25
6.25
Title Block for D and E.
SIZE
1.12 2.50
.50
1.25
.38
FSCM NO
DWG NO
REV
.50
SCALE
SHEET
2.38
5.12
.25
1.75
7.62
1.12
.38
.38
.25
SIZE
1.00
FSCM NO
DWG NO
REV
DRAWN
Continuation Sheet Title Block for A, B, C.
.62
SCALE
ISSUED
SHEET
.25
1.75
1.50
4.25
2.00
1.25
.38
.50
.25
SIZE
1.00
Continuation Sheet Title Block
for D and E.
FSCM NO
DWG NO
.75
ISSUED
SCALE
SHEET
2.38
5.12
2.50
Figure 1.16
REV
DRAWN
Size
Designation
Width
(Vertical)
Length
(Horizontal)
A (Horiz)
A (Vert)
B
C
D
E
8.5
11.0
11.0
17.0
22.0
34.0
11.0
8.5
17.0
22.0
34.0
44.0
Margin
Vertical
0.38
0.25
0.38
0.75
0.50
1.00
Horizontal
0.25
0.38
0.62
0.50
1.00
0.50
www.elsolucionario.net
Width
International
Designation
mm
A4
A3
A2
A1
A0
Problem 1.12 ANSI Standard Title Blocks and Border Lines
1.75
Length
in.
210
in.
8.27
mm
297
11.69
297
420
594
841
11.69
16.54
23.39
33.11
420
594
841
1189
16.54
23.39
33.11
46.11
.25
ber22643_ch01_001-016.qxd
12
3/6/08
10:24 PM
Page 12 ppg 206:MHDQ040:ber04%:ber04ch01%0:
Introduction to Graphics Communications for Engineers
1.7 Make a sketch of a common device, such as a telephone, automobile, computer mouse, or coffee cup.
1.8 Get a clear mental picture of a television, then sketch
what you see in your mind. Is this mental image 2-D
or 3-D? Try to put words to each feature of the TV
you are drawing. In this problem you will experience
the difficulty in trying to verbally describe an object
with enough detail for it to be manufactured.
1.9 Interview a practicing engineer or technologist and
ask how graphics are used in his or her daily work.
1.10 Ask the practicing engineer or technologist what
changes are taking place in his or her profession.
1.11 Research and report on an important historical figure in computer graphics, such as Ivan Sutherland,
Steve Coons, R. E. Bezier, or George Lucas.
1.12 Draw the border lines and title blocks for the ANSI
and ISO drawing sheets, using the dimensions
shown. Add text as shown, using a″ (3 mm) all-caps
text (Figure 1.16).
1.13 See Figure 1.17. Using a scale of a′′=1′–0′′, draw
the truss shown in the figure. The rise (R) is onefourth the span of the truss.
1.15 See Figure 1.19. Construct the irregular polygon
shown in the figure, using the given dimensions, on
an A- or A4-size sheet. Do not dimension.
90°
G
F
105°
C
AB = .94
EF = .66
BC = .90
FG = .40
CD = .46
GH = 1.06
DE = .34
HI = .68
IJ = 1.30
JA = ?
105°
75°
E
H
135°
60°
D
90°
120°
B
A
?
J
I
Figure 1.19
Problem 1.15 Irregular Polygon
RISE = 1/4 SPAN
1.16 See Figure 1.20. Construct the centering plate,
using the given dimensions. All of the angles are
proportional to angle A. Place the drawing on an Aor A4-size sheet. Do not dimension.
3/4 R
2/3 R
1/6 SPAN TYP.
SPAN = 30'-0"
Figure 1.17
Problem 1.13 Truss Bridge
A
.66
1.14 See Figure 1.18. Construct the irregular polygon
shown in the figure, using the given dimensions, on
an A- or A4-size sheet. Do not dimension.
.625A
A
.35
A/3
4X
ø .375
4
120°
2.25"
ø 3.00
135°
5X
1.50"
3X
A/3
4"
Figure 1.18
Problem 1.14 Angle Polygon
ø .25
Figure 1.20
Problem 1.16 Centering Plate
www.elsolucionario.net
ber22643_ch01_001-016.qxd
3/6/08
10:24 PM
Page 13 ppg 206:MHDQ040:ber04%:ber04ch01%0:
13
CHAPTER 1 Introduction to Graphics Communications
1.17 See Figure 1.21. Construct the retaining ring
shown in the figure. Use an A-size sheet and triple
the size of all radii.
1.19 See Figure 1.23. Construct the pump gasket shown
in the figure, using a B-size sheet.
2X 75°
2X 21°
2X 60°
R 3.88
4X R .37
ø 6.00
2X 15°
3.992
R .330
2X R .060
37°
19°
R .390
R .410
Figure 1.21
16°
FILLETS & ROUNDS R .020 U.O.S.
.0625 THICK
26°
Problem 1.17 Retaining Ring
ø 6.54
R 3.54
8X ø .340
2X 29°
1.18 See Figure 1.22. A laser beam directed from source
A is reflected at a 45-degree angle from mirror B to
mirror C, then onto the horizontal machine surface.
Draw the mirrors, machine surface, and light path.
Determine angle X for mirror C. [Hint: Angle Y
must equal angle Z (angle of incidence equals
angle of reflection).] Use a scale of b′′ equals
1′–0′′ and draw on an A-size sheet.
R 3.88
Figure 1.23
FILLETS & ROUNDS R .13 U.O.S.
.0625 THICK
Problem 1.19 Pump Gasket
1.20 See Figure 1.24. Construct the chamber clip shown
in the figure, using a B-size sheet.
A
2.00
4X R .88
C
X
Z
75°
7.76
Y
10'-0"
7.38
.75
6.88
45°
.88
4X
.75
3.13
2.75
1.88
B
8'-0"
1.88
.38
D
3.25
Horizontal machine surface
3.61
Figure 1.22
ø .50
5.88
Problem 1.18 Reflector
Figure 1.24
www.elsolucionario.net
FILLETS & ROUNDS
R .38 U.O.S.
Problem 1.20 Chamber Clip
ber22643_ch01_001-016.qxd
14
3/6/08
10:24 PM
Page 14 ppg 206:MHDQ040:ber04%:ber04ch01%0:
Introduction to Graphics Communications for Engineers
Orthographic Sketch Paper
Sketch Number: __________________
Name:__________________________
Div/Sec: ________________________
Date:___________________________
www.elsolucionario.net
ber22643_ch01_001-016.qxd
3/6/08
10:24 PM
Page 15 ppg 206:MHDQ040:ber04%:ber04ch01%0:
CHAPTER 1 Introduction to Graphics Communications
15
Orthographic Sketch Paper
Sketch Number: __________________
Name:__________________________
Div/Sec: ________________________
Date:___________________________
www.elsolucionario.net
ber22643_ch01_001-016.qxd
16
3/6/08
10:24 PM
Page 16 ppg 206:MHDQ040:ber04%:ber04ch01%0:
Introduction to Graphics Communications for Engineers
Problem Worksheet
Sketch Number: __________________
Name:__________________________
Div/Sec: ________________________
Date:___________________________
www.elsolucionario.net
ber22643_ch02_017-079.qxd
03/19/2008
8:07 pm
Page 17 pinnacle 206:MHDQ040:ber04%:ber04ch02:
Chapter
2
Sketching and Text
OBJECTIVES
After completing this chapter, you will be able to:
1. Define technical sketching.
2. Understand how sketching integrates into the design
process.
3. Identify and define two types of sketches.
4. Create a design sketch using pencil or computer.
5. Identify and use sketching tools.
6. Use grid paper to create sketches.
7. Lay out a sketch using proportions.
8. Understand the difference between pictorial and
multiview projection.
9. Create a perspective sketch.
10. Create an isometric sketch.
11. Create an oblique sketch.
12. Create a multiview sketch.
13. Identify the types and precedence of lines.
14. Follow good hand-lettering practice.
15. Identify important practices when using CAD for
lettering.
2.1
TECHNICAL SKETCHING
Technical sketching is the process of producing a rough,
preliminary drawing representing the main features of a
product or structure. Such sketches have traditionally been
done freehand; today, CAD systems can also be used. A
technical sketch is generally less finished, less structured or
restricted, and it takes less time than other types of freehand
illustrations. Also, a technical sketch may communicate
only selected details of an object, using lines; whole parts
of an object may be ignored, or shown with less emphasis,
while other features may be shown in great detail.
Technical sketches can take many different forms,
depending on the clarity needed and the purpose of the
sketch, both of which depend on the audience for which the
17
www.elsolucionario.net
ber22643_ch02_017-079.qxd
18
03/06/2008
10:35 pm
Page 18 pinnacle 206:MHDQ040:ber04%:ber04ch02%0:
Introduction to Graphics Communications for Engineers
Figure 2.1 Technical Sketch
A rough technical sketch can be made to capture a design idea quickly. (© Copyright 1994 ZIBA Designs, Inc. All rights reserved. This
document contains proprietary information of ZIBA Design, Inc. and no one may use or disclose anything contained in this document, except as authorized in
writing by ZIBA Design, Inc.)
sketch is intended. For example, a sketch made quickly to
record a fleeting design idea may be very rough (Figure 2.1).
This type of sketch is for personal use and is not meant to be
understood by anyone but the individual who produced it. A
sketch may also use the format of a more formal, multiview
drawing intended to be used by someone who understands
technical drawings (Figure 2.2). However, this type of
sketch would not be appropriate for a nontechnical person.
Pictorial sketches would be used to further clarify the design
idea and to communicate that idea to nontechnical individuals (Figure 2.3). Shading can be used to further enhance and
clarify a technical sketch (Figure 2.4).
Technical sketches are used extensively in the first
(ideation) stage of the design process and are an informal tool used by everyone involved in the design and
Figure 2.2 Multiview Sketch of a Mechanical Part, Used
by the Engineer to Communicate Technical Information
about the Design to Others
www.elsolucionario.net