Tài liệu The E-book Of Technical Market Indicators Ver 1.1 (Wall Street Courier) (pdf) pdf
Bạn đang xem bản rút gọn của tài liệu. Xem và tải ngay bản đầy đủ của tài liệu tại đây (1.02 MB, 49 trang )
The E-Book of Technical Market Indicators www.wallstreetcourier.com
Page
The E-Book of
Technical Market
Indicators
by
Wall Street Courier
Version 1.1
www.wallstreetcourier.com
1
The E-Book of Technical Market Indicators www.wallstreetcourier.com
Preface
The transparency of the American markets offers an array of indicators and allows
deep insights of prevailing sentiment. You find the activities of NYSE members like
specialists and floor traders, public and odd lot short sales, the Short Interest Ratio as well
as the large block transactions of the institutional investors published every week. Other
tools for technical analysis include trend indicators, daily advances and declines, daily new
highs and lows, volume, indices, put/call ratios and other useful information like Stochastics,
RSI, MACD, TICK and more. The problem is only that all these indicators contradict each
other most of the time. Countless books have been written on this subject, and no matter
how many will be written in the future: always be aware that there is no such thing as the
Holy Grail of the stock market. But some people are more successful than others and the
answer is quite simple:
No indicator is right all the time and you don't have to be right all the time. Just be
right a higher percentage of the time than wrong. Choose some reliable indicators and stick
to them. Don't follow some indicators for a while and switch to some others if they fail. Don't
be a technician in the first half of the year and a fundamentalist the next half. Be consistent
and disciplined in your approach. Don't abandon a good indicator because you think this
time everything is different.
It takes of course a lot of guts because the opinions of the most widely quoted gurus
of Wall Street are usually contrary to your indicators at that time. This is much easier if you
don't use margin. You will sleep a lot better if you buy fifty shares of IBM with the money
you can spare than two hundred shares on credit.
Happy Trading
Wall Street Courier
www.wallstreetcourier.com
Page 2
The E-Book of Technical Market Indicators www.wallstreetcourier.com
Table of Content
Advance-Decline Indicators 5
Advance-Decline Line 5
Advance-Decline Ratio 7
Upside-Downside Volume Ratio 8
Upside-Downside Volume Line 9
Upside-Downside Volume Net Difference 11
Advance-Decline Net Difference 12
Global Futures Advance-Decline Index 13
Global Futures Upside-Downside Volume Index 13
Market Indicators 14
High-Low Differential Index 14
High-Low Ratio 15
Global Futures High-Low Index 16
Global Futures Bottom Indicator 16
Cycles 19
Large Block Index 19
Short Term Trading Index (ARMS Index or TRIN) 20
Trend Indicator 22
CBOE Volatility Index (VIX) 23
Index Options Put/Call Ratio 23
Call/Put Ratio 24
Global Futures Put/Volume Ratio 25
Smart Money Flow Index 26
Global Futures Timing Indicator 27
Global Futures Market Timer Index 28
Global Futures Fear Indicator 29
Wall Street Courier Index 29
Global Futures Trading Index 30
Global Futures Speculation Index 31
Program Trading 32
Calendar Spread 33
Odd-Lot Differential Index 34
Page 3
The E-Book of Technical Market Indicators www.wallstreetcourier.com
Short Sales Statistics 35
The NYSE Short Interest Ratio 35
Odd-Lot Short Sales Ratio 36
Floor Traders Short Sales Ratio 36
Specialist Short Sales Ratio 37
NYSE Member Short Sales Ratio 38
Public Short Sales Ratio 38
Odd-Lot Balance Index 39
Odd-Lot/Floor Trader Short Sales Ratio 40
Global Futures Odd-Lot/Specialist Short Sales Ratio 40
Global Futures Public/Member Short Sales Ratio 41
Public/Specialists Short Sales Ratio 42
High readings indicate heavy shorting by the public (the so called crowd) and therefore
bottoms, low readings indicate tops. 42
Global Futures NYSE Member Trading Indicator 43
Sentiment Indicators 44
Investor Sentiment 44
Commitments of Traders Report 46
Appendix 48
Dow Jones Industrial 48
S&P 500 48
Risk Statement 49
Page 4
The E-Book of Technical Market Indicators www.wallstreetcourier.com
Advance-Decline Indicators
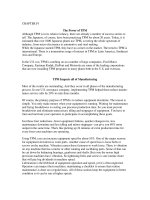
Advance-Decline Line
The Advance-Decline Line is a market breadth indicator and should be compared to
the other market indices like the Dow Jones or S&P 500. Daily or weekly NYSE data is
used in the calculation. Because the Advance-Decline Line reflects the action of the general
market, any divergences are watched closely by market technicians. As long as the Dow
and the Advance-Decline Line are moving in the same direction the trend will continue. If
the Dow makes a new high which is not confirmed by a high of the Advance-Decline Line,
caution is warranted. Vice versa, if the Dow makes a new low and the Advance-Decline
Line doesn't you should cover your short sales.
ADVANCE - DECLINE LINE WEEKLY
100000
120000
140000
160000
96-01-05
96-03-01
96-04-26
96-06-21
96-08-16
96-10-11
96-12-06
97-01-31
97-03-28
97-05-23
97-07-18
97-09-12
97-11-07
98-01-02
98-02-27
98-04-24
98-06-19
98-08-14
98-10-09
98-12-04
99-01-29
99-03-26
99-05-21
99-07-16
99-09-10
99-11-05
99-12-31
00-02-25
00-04-21
00-06-16
00-08-11
00-10-06
00-12-01
01-01-26
01-03-23
01-05-18
© WallStreetCourier.com
To calculate your own weekly Advance-Decline Line is very simple and you can
begin your calculations at any time. Just pick a large enough base number like 100000.
Then you calculate each week (or day) the difference between advances and declines by
adding the advances and subtracting the declines. If you have 1269 advances and 1457
declines on your first week, the reading of your newly created weekly Advance-Decline Line
would be 99812 (example below).
Page 5
The E-Book of Technical Market Indicators www.wallstreetcourier.com
Date Advances Declines A-D Line
100000
09.06.95 1269 1457 99812
16.06.95 1714 975 100551
23.06.95 1591 1148 100994
30.06.95 1346 1348 100992
07.07.95 2032 692 102332
14.07.95 1507 1191 102648
21.07.95 894 1875 101667
28.07.95 1891 845 102713
04.08.95 1404 1291 102826
11.08.95 1187 1489 102524
18.08.95 1624 1043 103105
25.08.95 1486 1176 103415
01.09.95 1656 1011 104060
08.09.95 1903 759 105204
The Advance-Decline Line gave a useful example in 1999. During the strong bull
market the advance was quite broad and the A/D Line moved in tandem with the Dow. But
when the Dow made new highs in the beginning of 1999 the A/D Line was already lagging
behind, indicating a weakening of the general market. Internet mania and technology craze
kept the market going for a while.
Page 6
The E-Book of Technical Market Indicators www.wallstreetcourier.com
Advance-Decline Ratio
The Advance-Decline Ratio is also market breadth indicator. It is calculated by
dividing the number of advancing issues by the number of declining issues using daily or
weekly NYSE data. It works very well as an overbought/oversold indicator and as a
momentum indicator. A moving average should be used to smooth out the swings.
Date Advances Declines A/D * 100 10-Week MA
09.06.95 1269 1457 87
16.06.95 1714 975 176
23.06.95 1591 1148 139
30.06.95 1346 1348 100
07.07.95 2032 692 294
14.07.95 1507 1191 127
21.07.95 894 1875 48
28.07.95 1891 845 224
04.08.95 1404 1291 109
11.08.95 1187 1489 80 138
18.08.95 1624 1043 156 145
25.08.95 1486 1176 126 140
01.09.95 1656 1011 164 143
08.09.95 1903 759 251 158
This chart shows you the weekly NYSE Advance-Decline Ratio on a 10-week moving
average. Readings below 90 indicate intermediate bottoms and readings above 170 tops.
ADVANCE-DECLINE RATIO
0,40
0,80
1,20
1,60
2,00
2,40
95-08-11
95-10-06
95-12-01
96-01-26
96-03-22
96-05-17
96-07-12
96-09-06
96-11-01
96-12-27
97-02-21
97-04-18
97-06-13
97-08-08
97-10-03
97-11-28
98-01-23
98-03-20
98-05-15
98-07-10
98-09-04
98-10-30
98-12-25
99-02-19
99-04-16
99-06-11
99-08-06
99-10-01
99-11-26
00-01-21
00-03-17
00-05-12
00-07-07
00-09-01
00-10-27
00-12-22
01-02-16
01-04-13
01-06-08
© WallStreetCourier.com
10-DAY MOVING AVERAGE
Page 7
The E-Book of Technical Market Indicators www.wallstreetcourier.com
Upside-Downside Volume Ratio
The Upside-Downside Volume Ratio is also market breadth indicator. It is calculated
by dividing the volume of advancing issues by the volume of declining issues, using daily or
weekly NYSE data. It works very well as an overbought/oversold indicator and as well as a
momentum indicator. A moving average should be used to smooth out the swings.
Date Adv. Volume Decl. Volume AV/DV*100 10-Week MA
09.06.95 673210 732827 92
16.06.95 943121 565840 167
23.06.95 964871 666807 145
30.06.95 674725 765076 88
07.07.95 867512 353025 246
14.07.95 945574 756197 125
21.07.95 755969 1027248 74
28.07.95 1008468 584579 173
04.08.95 733204 703285 104
11.08.95 565588 669580 84 130
18.08.95 796723 615752 129 133
25.08.95 629338 603130 104 127
01.09.95 727349 553140 131 126
08.09.95 746298 418632 178 135
UPSIDE/DOWNSIDE VOLUME RATIO
80
100
120
140
160
180
96-01-05
96-03-01
96-04-26
96-06-21
96-08-16
96-10-11
96-12-06
97-01-31
97-03-28
97-05-23
97-07-18
97-09-12
97-11-07
98-01-02
98-02-27
98-04-24
98-06-19
98-08-14
98-10-09
98-12-04
99-01-29
99-03-26
99-05-21
99-07-16
99-09-10
99-11-05
99-12-31
00-02-25
00-04-21
00-06-16
00-08-11
00-10-06
00-12-01
01-01-26
01-03-23
01-05-18
© WallStreetCourier.com
Page 8
The E-Book of Technical Market Indicators www.wallstreetcourier.com
Upside-Downside Volume Line
The Upside-Downside Volume Line is a market breadth indicator and should be
compared to the other market indices like the Dow Jones or S&P 500. Daily or weekly
NYSE data is used in the calculation. Because the Upside-Downside Volume Line reflects
the action of the general market, any divergences are watched closely by market
technicians. As long as the Dow and the Upside-Downside Volume Line are moving in the
same direction the trend will continue. If the Dow makes a new high which is not confirmed
by a high of the Upside-Downside Volume Line, caution is warranted. It is more affirmative
than the Advance-Decline Line and it gave a perfect sell signal in January 2000, when the
Dow made a new high and the Upside-Downside Volume Line lagged behind (charts
below). Vice versa, if the Dow makes a new low and the Upside-Downside Volume Line
doesn't, you should cover your short sales. To calculate your own weekly Upside-Downside
Volume Line is very simple and you can begin your calculations at any time. Just pick a
large enough base number like 1000000. Then you calculate each week (or day) the
difference between the upside volume and downside volume by adding the volume of
advancing issues and subtracting the volume of declining issues. If you have an upside
volume of 673210 and a downside volume of 732827 on your first week, the reading of your
newly created weekly Upside-Downside Volume Line would be 940383 (example below).
Date Upside Volume Downside Volume U-D Volume Line
1000000
09.06.95 673210 732827 940383
16.06.95 943121 565840 1317664
23.06.95 964871 666807 1615728
30.06.95 674725 765076 1525377
07.07.95 867512 353025 2039864
14.07.95 945574 756197 2229241
21.07.95 755969 1027248 1957962
28.07.95 1008468 584579 2381851
04.08.95 733204 703285 2411770
11.08.95 565588 669580 2307778
18.08.95 796723 615752 2488749
25.08.95 629338 603130 2514957
01.09.95 727349 553140 2689166
08.09.95 746298 418632 3016832
Page 9
The E-Book of Technical Market Indicators www.wallstreetcourier.com
Here is a beautiful example of the Upside-Downside Volume Line. Volume moves
the markets and this indicator gave a perfect sell signal in December 1999, when the Dow
made a new high and the Upside-Downside Volume Line didn't. It would have kept you also
on the right side of the market right to the top.
ADVANCE - DECLINE VOLUM E LINE
1000000
3000000
5000000
7000000
9000000
11000000
13000000
15000000
17000000
19000000
21000000
23000000
25000000
96-01-05
96-03-01
96-04-26
96-06-21
96-08-16
96-10-11
96-12-06
97-01-31
97-03-28
97-05-23
97-07-18
97-09-12
97-11-07
98-01-02
98-02-27
98-04-24
98-06-19
98-08-14
98-10-09
98-12-04
99-01-29
99-03-26
99-05-21
99-07-16
99-09-10
99-11-05
99-12-31
00-02-25
00-04-21
00-06-16
00-08-11
00-10-06
00-12-01
01-01-26
01-03-23
01-05-18
© WallStreetCourier.com
DIV ERGENCE
DOW JONES WEEKLY CLOSE
5000
6000
7000
8000
9000
10000
11000
12000
96-01-05
96-03-01
96-04-26
96-06-21
96-08-16
96-10-11
96-12-06
97-01-31
97-03-28
97-05-23
97-07-18
97-09-12
97-11-07
98-01-02
98-02-27
98-04-24
98-06-19
98-08-14
98-10-09
98-12-04
99-01-29
99-03-26
99-05-21
99-07-16
99-09-10
99-11-05
99-12-31
00-02-25
00-04-21
00-06-16
00-08-11
00-10-06
00-12-01
01-01-26
01-03-23
01-05-18
© WallStreetCourier.com
DIV ERGENCE
Page 10
The E-Book of Technical Market Indicators www.wallstreetcourier.com
Upside-Downside Volume Net Difference
Another method used by market technicians is to calculate the net difference
between the upside- and downside volume. Daily or weekly data can be used. The net
difference between upside- and downside volume is calculated weekly and the result is
added. To smooth out the swings, a 10-week moving average should be applied. Below
there is an example for weekly calculations:
Date Adv. Volume Decl. Volume Net Difference Cumulative
0
09.06.95 673210 732827 -59617 -59617
16.06.95 943121 565840 377281 317664
23.06.95 964871 666807 298064 615728
30.06.95 674725 765076 -90351 525377
07.07.95 867512 353025 514487 1039864
14.07.95 945574 756197 189377 1229241
21.07.95 755969 1027248 -271279 957962
28.07.95 1008468 584579 423889 1381851
04.08.95 733204 703285 29919 1411770
11.08.95 565588 669580 -103992 1307778
18.08.95 796723 615752 180971 1488749
25.08.95 629338 603130 26208 1514957
01.09.95 727349 553140 174209 1689166
08.09.95 746298 418632 327666 2016832
UP - DOWNVOLUME NET DIFFERENCE
-1000000
-500000
0
500000
1000000
96-01-05
96-03-01
96-04-26
96-06-21
96-08-16
96-10-11
96-12-06
97-01-31
97-03-28
97-05-23
97-07-18
97-09-12
97-11-07
98-01-02
98-02-27
98-04-24
98-06-19
98-08-14
98-10-09
98-12-04
99-01-29
99-03-26
99-05-21
99-07-16
99-09-10
99-11-05
99-12-31
00-02-25
00-04-21
00-06-16
00-08-11
00-10-06
00-12-01
01-01-26
01-03-23
01-05-18
© WallStreetCourier.com
Page 11
The E-Book of Technical Market Indicators www.wallstreetcourier.com
Advance-Decline Net Difference
Another method used by market technicians is to calculate the net difference
between advances and declines. Daily or weekly data can be used. The net difference
between advances and declines is calculated weekly and the result is added. To smooth
out the swings, a 10-week moving average is applied. Below there is an example for weekly
calculations:
Date Advances Declines Net Differ. Cumulative 10-Week MA
09.06.95 1269 1457 -188 -188
16.06.95 1714 975 739 551
23.06.95 1591 1148 443 1182
30.06.95 1346 1348 -2 441
07.07.95 2032 692 1340 1338
14.07.95 1507 1191 316 1656
21.07.95 894 1875 -981 -665
28.07.95 1891 845 1046 65
04.08.95 1404 1291 113 1159
11.08.95 1187 1489 -302 -189 535,0
18.08.95 1624 1043 581 279 581,7
25.08.95 1486 1176 310 891 615,7
01.09.95 1656 1011 645 955 593,0
08.09.95 1903 759 1144 1789 727,8
The chart went from extremely overbought in July 1997 to heavily oversold in September
1998:
ADVANCE - DECLINE NET DIFFERENCE
-1500
-1000
-500
0
500
1000
1500
2000
96-01-05
96-03-01
96-04-26
96-06-21
96-08-16
96-10-11
96-12-06
97-01-31
97-03-28
97-05-23
97-07-18
97-09-12
97-11-07
98-01-02
98-02-27
98-04-24
98-06-19
98-08-14
98-10-09
98-12-04
99-01-29
99-03-26
99-05-21
99-07-16
99-09-10
99-11-05
99-12-31
00-02-25
00-04-21
00-06-16
00-08-11
00-10-06
00-12-01
01-01-26
01-03-23
01-05-18
©
Page 12
The E-Book of Technical Market Indicators www.wallstreetcourier.com
Global Futures Advance-Decline Index
This indicator is calculated by dividing the weekly number of advances and declines by the
number of total issues traded. A 10-week moving average is applied to smooth out the
swings.
ADVANCE - DECLINE INDEX WEEKLY
0,30
0,35
0,40
0,45
0,50
0,55
0,60
96-01-05
96-03-01
96-04-26
96-06-21
96-08-16
96-10-11
96-12-06
97-01-31
97-03-28
97-05-23
97-07-18
97-09-12
97-11-07
98-01-02
98-02-27
98-04-24
98-06-19
98-08-14
98-10-09
98-12-04
99-01-29
99-03-26
99-05-21
99-07-16
99-09-10
99-11-05
99-12-31
00-02-25
00-04-21
00-06-16
00-08-11
00-10-06
00-12-01
01-01-26
01-03-23
01-05-18
© WallStreetCourier.com
ADVANCES
DECLINES
Global Futures Upside-Downside Volume Index
This indicator is calculated by dividing the weekly upside and downside volumes by the
weekly total volume. A 10-week moving average is applied to smooth out the swings.
UPSIDE - DOWNSIDE VOLUME INDEX WEEKLY
0,36
0,38
0,40
0,42
0,44
0,46
0,48
0,50
0,52
0,54
0,56
96-01-05
96-03-01
96-04-26
96-06-21
96-08-16
96-10-11
96-12-06
97-01-31
97-03-28
97-05-23
97-07-18
97-09-12
97-11-07
98-01-02
98-02-27
98-04-24
98-06-19
98-08-14
98-10-09
98-12-04
99-01-29
99-03-26
99-05-21
99-07-16
99-09-10
99-11-05
99-12-31
00-02-25
00-04-21
00-06-16
00-08-11
00-10-06
00-12-01
01-01-26
01-03-23
01-05-18
© WallStreetCourier.com
UPSIDE V OLUME
DOWNSIDE V OLUME
y
Page 13
The E-Book of Technical Market Indicators www.wallstreetcourier.com
Market Indicators
High-Low Differential Index
Like the advance-decline line, the high-low indicators produce signals when they
diverge from the action of the indices like the Dow Jones or the S&P 500. It is considered
unhealthy for the market climate if the indices make new highs without many stocks
reaching new highs at the same time. Chart technicians use various methods to spot
divergences from the major market indices.
The High-Low Differential Index produces good longer term signals when it diverges
from the action of the Dow over a prolonged period of time. Daily or weekly data may be
used and the calculation of this indicator is very simple; just subtract the daily or weekly
new lows from the new highs to get the differential and apply a moving average to smooth
out the swings. If you have 479 new highs and 31 new lows on your first week, the reading
of your newly created weekly High-Low Differential Index would be 448 (example below).
Date Highs Lows Differential 10-week MA
09.06.95 479 31 448
16.06.95 371 42 329
23.06.95 491 56 435
30.06.95 292 42 250
07.07.95 485 29 456
14.07.95 635 36 599
21.07.95 331 50 281
28.07.95 464 43 421
04.08.95 402 42 360
11.08.95 337 47 290 387
18.08.95 338 53 285 371
25.08.95 336 46 290 367
01.09.95 397 50 347 358
08.09.95 530 31 499 383
15.09.95 664 43 621 399
Page 14
The E-Book of Technical Market Indicators www.wallstreetcourier.com
HIGH-LOW DIFFERENTIAL INDEX
-1500
-1000
-500
0
500
1000
1500
96-01-05
96-03-01
96-04-26
96-06-21
96-08-16
96-10-11
96-12-06
97-01-31
97-03-28
97-05-23
97-07-18
97-09-12
97-11-07
98-01-02
98-02-27
98-04-24
98-06-19
98-08-14
98-10-09
98-12-04
99-01-29
99-03-26
99-05-21
99-07-16
99-09-10
99-11-05
99-12-31
00-02-25
00-04-21
00-06-16
00-08-11
00-10-06
00-12-01
01-01-26
01-03-23
01-05-18
© WallStreetCourier.com
High-Low Ratio
The High-Low Ratio is the number of new highs divided by the numbers of new lows. Daily
or weekly data may be used in the calculation. Readings do get sometimes very distorted if
there are for instance about 600 new highs and 5 new lows or vice versa. A long-period
moving average should therefore be applied.
HIGH-LOW RATIO WEEKLY
0
2
4
6
8
10
12
14
16
18
20
96-01-05
96-03-01
96-04-26
96-06-21
96-08-16
96-10-11
96-12-06
97-01-31
97-03-28
97-05-23
97-07-18
97-09-12
97-11-07
98-01-02
98-02-27
98-04-24
98-06-19
98-08-14
98-10-09
98-12-04
99-01-29
99-03-26
99-05-21
99-07-16
99-09-10
99-11-05
99-12-31
00-02-25
00-04-21
00-06-16
00-08-11
00-10-06
00-12-01
01-01-26
01-03-23
01-05-18
© WallStreetCourier.com
Page 15
The E-Book of Technical Market Indicators www.wallstreetcourier.com
Global Futures High-Low Index
This indicator is calculated by dividing the weekly number of highs and lows by the
number of total issues traded. A 10-week moving average is applied to smooth out the
swings. Like the advance-decline line, this indicator produces signals when it diverges from
the action of the indices like the Dow Jones or the S&P 500. It is considered unhealthy for
the market climate if the indices make new highs without many stocks reaching new highs
at the same time.
HIGH -LOW INDEX
0,01
0,03
0,05
0,07
0,09
0,11
0,13
0,15
0,17
0,19
0,21
0,23
0,25
96-01-05
96-03-01
96-04-26
96-06-21
96-08-16
96-10-11
96-12-06
97-01-31
97-03-28
97-05-23
97-07-18
97-09-12
97-11-07
98-01-02
98-02-27
98-04-24
98-06-19
98-08-14
98-10-09
98-12-04
99-01-29
99-03-26
99-05-21
99-07-16
99-09-10
99-11-05
99-12-31
00-02-25
00-04-21
00-06-16
00-08-11
00-10-06
00-12-01
01-01-26
01-03-23
01-05-18
© WallStreetCourier.com
LOWSHIGHS
10- WEEK MOVING AVERAGE
Global Futures Bottom Indicator
The Global Futures Bottom Indicator was developed by R. Koch of Wall Street
Courier. To our knowledge there is no previous mentioning of this indicator in any financial
publication. It does not appear very often but it is extremely reliable when the market is at a
turning point. It prevents long-term investors from buying at the wrong time and works
especially well for option traders because of its incredibly perfect timing. Unfortunately this
indicator does not tell you when to sell. Set yourself a limit if you trade options, or use
trailing stop-loss orders if you are a long-term investor.
Page 16
The E-Book of Technical Market Indicators www.wallstreetcourier.com
Check BARRON`S every Monday for the weekly:
• CALLS ADVANCES
• CALLS DECLINES
• PUTS ADVANCES
• PUTS DECLINES
• (CBOE MARKET REPORT)
It takes you only five minutes every week to calculate the Global Futures Bottom Indicator:
• Divide the number of calls advancing by the number of calls declining
• Divide the number of puts declining by the number of puts advancing
• Subtract the result of calls adv./decl. from the result of puts decl./adv.
• Plot the difference on a chart and ignore the decimal.
Example Calls Adv. Calls Decl. Unch. Puts Adv. Puts Decl. Unch.
Prev.Week 23000 11000 8000 7000 25000 10000
This Week 9000 26000 6000 24000 8000 7000
You calculate as follows:
23000 : 11000 = 2,09 25000 : 7000 = 3,57 Difference = 148 (357 minus 209)
9000 : 26000 = 0,34 8000 : 24000 = 0,33 Difference = - 1 ( 33 minus 34)
Date Calls
Adv.
Calls
Decl.
Calls A/D Puts
Adv.
Puts
Decl.
Puts D/A Bottom
Indicator
09.06.95 12656 14215 0,89 9590 13879 1,45 56
16.06.95 17696 9818 1,80 5647 18431 3,26 146
23.06.95 14390 8550 1,68 6014 13839 2,30 62
30.06.95 10933 17902 0,61 12571 11735 0,93 32
07.07.95 21611 7779 2,78 4894 20146 4,12 134
14.07.95 17819 12190 1,46 8627 15531 1,80 34
21.07.95 9071 22844 0,40 15943 9405 0,59 19
28.07.95 18152 7554 2,40 4748 17237 3,63 123
04.08.95 11159 21092 0,53 14649 11905 0,81 28
11.08.95 13081 19336 0,68 12100 14522 1,20 52
18.08.95 19594 12741 1,54 6930 20184 2,91 137
25.08.95 9760 16547 0,59 10368 11238 1,08 49
Page 17
The E-Book of Technical Market Indicators www.wallstreetcourier.com
THE GLOBAL FUTURES BOTTOM INDICATOR
-25
25
75
125
175
225
275
325
375
425
475
96-01-05
96-03-01
96-04-26
96-06-21
96-08-16
96-10-11
96-12-06
97-01-31
97-03-28
97-05-23
97-07-18
97-09-12
97-11-07
98-01-02
98-02-27
98-04-24
98-06-19
98-08-14
98-10-09
98-12-04
99-01-29
99-03-26
99-05-21
99-07-16
99-09-10
99-11-05
99-12-31
00-02-25
00-04-21
00-06-16
00-08-11
00-10-06
00-12-01
01-01-26
01-03-23
01-05-18
© WallStreetCourier.com
THE GLOBAL FUTURES BOTTOM INDICATOR
-20,00
-10,00
0,00
10,00
20,00
30,00
40,00
50,00
96-01-05
96-03-01
96-04-26
96-06-21
96-08-16
96-10-11
96-12-06
97-01-31
97-03-28
97-05-23
97-07-18
97-09-12
97-11-07
98-01-02
98-02-27
98-04-24
98-06-19
98-08-14
98-10-09
98-12-04
99-01-29
99-03-26
99-05-21
99-07-16
99-09-10
99-11-05
99-12-31
00-02-25
00-04-21
00-06-16
00-08-11
00-10-06
00-12-01
01-01-26
01-03-23
01-05-18
© WallStreetCourier.com
BUY
BOTTOM
Any zero or minus reading indicates a bottom. Since this indicator was invented and
developed it only failed twice on a minus reading if compared to the Dow Jones. This was
due to panic selling on August 3rd and August 24th 1990 when Saddam invaded Kuwait.
• Readings between 1 and 5 are also very reliable and indicate intermediate bottoms
in bull markets.
• Readings up to 25 may work but should be counterchecked with other indicators
such as the Global Futures Market Timing Indicator.
• Readings above 600 are good breadth indicators and show you that a powerful
market move on the upside is to be expected.
• Ignore all other readings.
Page 18
The E-Book of Technical Market Indicators www.wallstreetcourier.com
For your convenience there is a track record attached (377 kb) back to 1985 for you
to check the value of this indicator. Plot the numbers on a chart and compare it with
previous market action. Feel free to make use of our indicator if you find it useful. Feel also
free to publish it as long as you mention the source and call it the Global Futures Bottom
Indicator. Download the track record at />indicators/track-record.htm
Cycles
Cycle analysis has a long history and is also part of technical analysis. All markets
appear to be subject to cyclical patterns and forces caused by economic influences and
countless other factors. Stock market movements seem to take place with cyclical regularity
and timing your trades to coincide with anticipated cyclical movements can be very
rewarding. Wall Street Courier offers some very reliable cycles for subscribers.
Large Block Index
The Large Block Index is calculated from the number of upticks and downticks in
large block transactions of single trades of 10 000 shares and over. An uptick is at a price
higher than the last previous trade and initiated by a buyer. A downtick is at a price lower
than the previous trade and initiated by a seller. The rationale behind the Large Block Index
is quite simple. It measures activities and extremes in institutional sentiment and behavior.
When the ratio of upticks rises to very high levels, it indicates that the institutions are buying
heavily, reaching a fully invested position and therefore lowering their cash reserves.
Conversely, when the ratio of downticks rises to high levels, it indicates that the
institutions are selling and are raising cash. When the institutional behaviour reaches
extremes, the market will turn in a contrary direction. This indicator has often signaled major
reversals and has also prevented investors from plunging into the market at the wrong time.
The chart below shows you this indicator on a 10-day moving average.
Page 19
The E-Book of Technical Market Indicators www.wallstreetcourier.com
THE GLOBAL FUTURES LARGE BLOCK INDEX
0,80
0,85
0,90
0,95
1,00
1,05
1,10
1,15
1,20
1,25
1,30
1,35
1,40
1,45
1,50
98-08-14
98-09-11
98-10-09
98-11-06
98-12-04
99-01-01
99-01-29
99-02-26
99-03-26
99-04-23
99-05-21
99-06-18
99-07-16
99-08-13
99-09-10
99-10-08
99-11-05
99-12-03
99-12-31
00-01-28
00-02-25
00-03-24
00-04-21
00-05-19
00-06-16
00-07-14
00-08-11
00-09-08
00-10-06
00-11-03
00-12-01
00-12-29
01-01-26
01-02-23
01-03-23
01-04-20
01-05-18
01-06-15
© WallStreetCourier.com
BUY
SELL
10-DAY MOVING AVERAGE
Short Term Trading Index (ARMS Index or TRIN)
The Short Term Trading Index was invented over 30 years ago by Richard Arms and
is also known as ARMS Index. It is calculated by dividing advancing issues by declining
issues and advancing volume by declining volume. The first result is then divided by the
latter and the result is the TRIN. If the index is above one, the average volume of stocks
that fell on the NYSE was greater than the average volume of stocks that rose and vice
versa. But it is most confirmative when it reaches extremes. This indicator rises sharply
when the market is most depressed and selling is climaxing, and falls to very low levels
during buying frenzies.
Date Adv. Decl. A/D Upvol. Downvol. U/D Vol. TRIN 10- MA
13.06.01 1521 1561 0,97 384035 657357 0,58 1,67
14.06.01 927 2150 0,43 218634 997425 0,22 1,97
15.06.01 1437 1588 0,90 649006 904083 0,72 1,26
18.06.01 1309 1776 0,74 408501 682268 0,60 1,23
19.06.01 1498 1541 0,97 543321 615409 0,88 1,10
20.06.01 1823 1269 1,44 716273 610436 1,17 1,22
21.06.01 1738 1352 1,29 905813 547728 1,65 0,78
22.06.01 1243 1814 0,69 439011 722679 0,61 1,13
25.06.01 1301 1777 0,73 332607 682239 0,49 1,50
26.06.01 1778 1294 1,37 577414 605567 0,95 1,44 1,33
27.06.01 1811 1268 1,43 462680 657256 0,70 2,03 1,37
Page 20
The E-Book of Technical Market Indicators www.wallstreetcourier.com
28.06.01 1882 1211 1,55 877241 423609 2,07 0,75 1,24
29.06.01 1938 1141 1,70 964950 759013 1,27 1,34 1,25
02.07.01 1598 1468 1,09 694667 399965 1,74 0,63 1,19
03.07.01 1592 1349 1,18 307258 304648 1,01 1,17 1,20
SHORT TERM TRADING INDEX WEEKLY (TRIN)
0,70
0,90
1,10
1,30
96-01-05
96-03-01
96-04-26
96-06-21
96-08-16
96-10-11
96-12-06
97-01-31
97-03-28
97-05-23
97-07-18
97-09-12
97-11-07
98-01-02
98-02-27
98-04-24
98-06-19
98-08-14
98-10-09
98-12-04
99-01-29
99-03-26
99-05-21
99-07-16
99-09-10
99-11-05
99-12-31
00-02-25
00-04-21
00-06-16
00-08-11
00-10-06
00-12-01
01-01-26
01-03-23
01-05-18
© WallStreetCourier.com
BUY
SELL
4-WEEK MOVING AVERAGE
TRIN DAILY
0,70
0,95
1,20
1,45
1,70
96-01-02
96-02-27
96-04-23
96-06-18
96-08-13
96-10-08
96-12-03
97-01-28
97-03-25
97-05-20
97-07-15
97-09-09
97-11-04
97-12-30
98-02-24
98-04-21
98-06-16
98-08-11
98-10-06
98-12-01
99-01-26
99-03-23
99-05-18
99-07-13
99-09-07
99-11-02
99-12-28
00-02-22
00-04-18
00-06-13
00-08-08
00-10-03
00-11-28
01-01-23
01-03-20
01-05-15
© WallStreetCourier.com
10-DAY MOVING AVERAGE
BUY
SELL
Page 21
The E-Book of Technical Market Indicators www.wallstreetcourier.com
Trend Indicator
Why are some traders more successful than others? There are probably as many
answers as there are traders out there. But you will undoubtedly agree that most of the
money is being made in a trend, especially as far as options and futures are concerned. In
options trading your biggest enemy by far is time. You need to have the patience and
discipline to wait for a trend in the market in order to succeed on the long run. The same
rule applies to any short-term oriented trader. The Global Futures Trend Index shows you
clearly when to enter the market. This index is computed by dividing the daily highs by the
sum of the daily highs and lows. A 10-week moving average is applied to smooth out the
swings. As long as the readings of this index stay above the 80%-level there is a solid
bullish trend in progress. Any weakness should be used to go long or to buy call options,
preferably of stocks which are in a clear uptrend, or stock index options. Readings below 20
indicate a bearish trend. Strong days should be used to short stocks which are already
weak, or to buy put options. As long as this indicator is in neutral territory don't do anything
unless you are a savvy stockpicker, insider or a long-term value investor.
THE GLOBAL FUTURES TREND INDEX
0,00
0,10
0,20
0,30
0,40
0,50
0,60
0,70
0,80
0,90
1,00
96-01-02
96-02-27
96-04-23
96-06-18
96-08-13
96-10-08
96-12-03
97-01-28
97-03-25
97-05-20
97-07-15
97-09-09
97-11-04
97-12-30
98-02-24
98-04-21
98-06-16
98-08-11
98-10-06
98-12-01
99-01-26
99-03-23
99-05-18
99-07-13
99-09-07
99-11-02
99-12-28
00-02-22
00-04-18
00-06-13
00-08-08
00-10-03
00-11-28
01-01-23
01-03-20
01-05-15
© WallStreetCourier.com
BULLISH TREND
TRA DING RA NGE MA RKET
BEARISH TREND
Page 22
The E-Book of Technical Market Indicators www.wallstreetcourier.com
CBOE Volatility Index (VIX)
VIX computes volatility of four OEX contracts in two nearby months and is published
daily by the CBOE. Options selected for this index are one call and one put just out of the
money, and one call and one put just in the money, for each of the two front months of the
OEX (S&P 100). Extremely high readings of VIX indicate bottoms and low readings tops.
VOLATILITY INDEX (VIX) WEEKLY
0
10
20
30
40
50
96-01-05
96-03-01
96-04-26
96-06-21
96-08-16
96-10-11
96-12-06
97-01-31
97-03-28
97-05-23
97-07-18
97-09-12
97-11-07
98-01-02
98-02-27
98-04-24
98-06-19
98-08-14
98-10-09
98-12-04
99-01-29
99-03-26
99-05-21
99-07-16
99-09-10
99-11-05
99-12-31
00-02-25
00-04-21
00-06-16
00-08-11
00-10-06
00-12-01
01-01-26
01-03-23
01-05-18
©
Index Options Put/Call Ratio
This indicator is calculated by dividing the weekly volume of S&P 100 call options by
the weekly volume of S&P 100 put options. Big call volume appears at market tops and big
put volume at bottoms. But call/put ratios of the indices like OEX and SPX are distorted and
clouded by arbitrage and hedging and do therefore not always reflect true investor
sentiment.
Page 23
The E-Book of Technical Market Indicators www.wallstreetcourier.com
CALL/PUT RATIO OEX
0,35
0,55
0,75
0,95
1,15
96-01-05
96-03-01
96-04-26
96-06-21
96-08-16
96-10-11
96-12-06
97-01-31
97-03-28
97-05-23
97-07-18
97-09-12
97-11-07
98-01-02
98-02-27
98-04-24
98-06-19
98-08-14
98-10-09
98-12-04
99-01-29
99-03-26
99-05-21
99-07-16
99-09-10
99-11-05
99-12-31
00-02-25
00-04-21
00-06-16
00-08-11
00-10-06
00-12-01
01-01-26
01-03-23
01-05-18
© WallStreetCourier.com
4-WEEK MOVING AVERAGE
BUY
SELL
Call/Put Ratio
This indicator is calculated by dividing the daily or weekly volume of call options by
the daily or weekly volume of put options. Big call volume appears at market tops and big
put volume at bottoms. Only CBOE equity options or all CBOE options should be used for
this indicator. Call/put ratios of the indices like OEX and SPX are distorted and clouded by
arbitrage and hedging and do therefore not always reflect true investor sentiment. The chart
below shows you the weekly call/put ratio on a 4-week moving average to smooth out the
swings.
CALL/PUT RATIO ALL CBOE OPTIONS
1,00
1,25
1,50
1,75
2,00
2,25
2,50
96-01-05
96-03-01
96-04-26
96-06-21
96-08-16
96-10-11
96-12-06
97-01-31
97-03-28
97-05-23
97-07-18
97-09-12
97-11-07
98-01-02
98-02-27
98-04-24
98-06-19
98-08-14
98-10-09
98-12-04
99-01-29
99-03-26
99-05-21
99-07-16
99-09-10
99-11-05
99-12-31
00-02-25
00-04-21
00-06-16
00-08-11
00-10-06
00-12-01
01-01-26
01-03-23
01-05-18
© WallStreetCourier.com
SELL
BUY
4-WEEK MOVING AVERAGE
Page 24
The E-Book of Technical Market Indicators www.wallstreetcourier.com
CALL/PUT RATIO EQUITY OPTIONS
1,50
2,00
2,50
3,00
96-01-05
96-03-01
96-04-26
96-06-21
96-08-16
96-10-11
96-12-06
97-01-31
97-03-28
97-05-23
97-07-18
97-09-12
97-11-07
98-01-02
98-02-27
98-04-24
98-06-19
98-08-14
98-10-09
98-12-04
99-01-29
99-03-26
99-05-21
99-07-16
99-09-10
99-11-05
99-12-31
00-02-25
00-04-21
00-06-16
00-08-11
00-10-06
00-12-01
01-01-26
01-03-23
01-05-18
© WallStreetCourier.com
BUY
SELL
4-WEEK MOVING AVERAGE
Global Futures Put/Volume Ratio
The Global Futures Put/Volume Ratio is a market sentiment indicator. It is calculated
by dividing the volume of CBOE equity put options by the NYSE volume on a weekly basis
and is interpreted in a contrary fashion. High readings signify extreme pessimism and fear,
sometimes outright panic and indicate very often bottoms. Low readings of this indicator
result from the anticipation of higher prices ahead and are therefore considered bearish. It
is in our opinion more affirmative than the widely used put/call ratio which has gained
widespread notice.
THE GLOBAL FUTURES PUT/VOLUM E RATIO
15
20
25
30
35
40
45
96-01-05
96-03-01
96-04-26
96-06-21
96-08-16
96-10-11
96-12-06
97-01-31
97-03-28
97-05-23
97-07-18
97-09-12
97-11-07
98-01-02
98-02-27
98-04-24
98-06-19
98-08-14
98-10-09
98-12-04
99-01-29
99-03-26
99-05-21
99-07-16
99-09-10
99-11-05
99-12-31
00-02-25
00-04-21
00-06-16
00-08-11
00-10-06
00-12-01
01-01-26
01-03-23
01-05-18
© WallStreetCourier.com
Page 25