Financial analysis of VIETNAM DAIRY joint stock company (VINAMILK)
Bạn đang xem bản rút gọn của tài liệu. Xem và tải ngay bản đầy đủ của tài liệu tại đây (487.18 KB, 29 trang )
FACULTY OF
FINANCE AND COMMERCE
Topic: Financial analysis of VIETNAM DAIRY Joint Stock Company (VINAMILK)
from 2016 to 2020
HCM City, 21/06/2021.
1
I.
INTRODUCTION
1.1 About the company
Table 01- General information of Vinamilk
VINAMILK
Full name
VIETNAM DAIRY Joint Stock Company ( VINAMILK )
Address
Tan Xuan Street, Tan Phu Ward, District 7, Ho Chi Minh City
Phone, Fax
8.54155555
Website
www.vinamilk.com.vn
Email
Slogan
"International Quality - Vinamilk Quality"
Established
On August 20, 1976.
Vinamilk has now become the leading company in Vietnam in processing and supplying dairy products,
ranked in the Top 10 strong brands in Vietnam. Vinamilk not only dominates the domestic dairy market but
also exports its products to many countries around the world such as the US, Australia, Canada,...
1.2 About the product:
Vinamilk has a lot of products made from milk, such as:
- Organic Nutritional Products
- Vinamilk Water Milk
- Vinamilk Yogurt
- Vinamilk Powdered Milk for Pregnant
Mothers and Children
- Mileage powder
- Adult Nutrition Products
- Condensed milk
- Soft Drinks
- Ice Cream
- Cheese
- Soy Milk
- Vietsugar Road
-
2
-
1.3 About the market:
-
1.3.1. Domestic market
- According to Nielsen, Vinamilk 100% fresh milk product of Vietnam Dairy Products Joint Stock Company
(Vinamilk) is the leading product in terms of both quality sold by enterprises in the fresh milk segment
from 2015 to present. For many years, Vinamilk has always led the market with fresh milk products and
many nutritional products of international quality. With efforts to improve technology and pioneer, list of
"terrible" products, diverse and new continuously, developing dairy herds in both quantity and quality,
wide distribution system and diverse platform: 12 global gap standard farms, nearly 150 herds of dairy
cows, 13 manufacturing plants milk production, 6 subsidiaries, link domestic; 5 subsidiaries, link foreign
- Vinamilk continues to consolidate and affirm its position as the No. 1 dairy company in Vietnam.
1.3.2. Overseas markets
- In general, Vinamilk is still asserting its strength with stable business results. According to recently
published statistics, this enterprise has risen six places in the list of top 50 dairy companies in the world,
rising to 36th position. This shows that the internal strengths are being properly promoted by Vinamilk. At
the right time and in the right way, in choosing a sure direction in the domestic market to create the
impetus for reaching out to international markets.
- Up to now, Vinamilk has exported to 56 countries and territories with a total turnover of more than 2.4
billion USD. in which there are countries with very high requirements for nutritional quality such as
Japan, Canada, USA, Australia, Thailand...
- 1.4. Opponents
- 1.4.1. Direct opponent
-
The competition of dairy companies in the battle over pasteurized fresh milk, pasteurized fresh
milk, and raw milk (milk powder).
-
With the characteristics of the industry, the dairy market is increasingly competitive. There are more
than 50 dairy companies in Vietnam, most of which are small and medium-sized companies.
-
However, the dairy market is mainly focused on the two manufacturers with the largest market share,
Vinamilk, accounting for more than 50% of the dairy industry, followed by Friesland Campina Vietnam.
Followed by products with the same market share of imported milk from firms like Mead. Johnson,
Abbott, Nestle…TH true Milk, Nutifood,
-
Powdered milk is the most fiercely competitive segment today.
-
In the Vietnamese market, powdered milk and imported dairy products account for a large market
share, of which Vinamilk is still being trusted by Vietnamese users and is on the rise, holding 40% of the
domestic market share. However, on the other hand, Vinamilk's representative also said that "will face
many challenges from the opportunities that are opening up" when Russia and EAEU countries are
countries with a very developed dairy industry for a long time.
-
Before the strategies of competitors, for Vinamilk to operate in strongly competitive dairy industry, it
requires the company to constantly invest in R&D, and at the same time strengthen marketing campaigns,
promote images, create pressures. Force for the company in many aspects such as cost, revenue, profit ...
but it is also a positive factor contributing to increasing competitiveness and creating momentum for
Vinamilk to develop.
1.4.2 Potential opponent
-
The dairy industry in general and the market for pasteurized milk products in particular in Vietnam is
an attractive industry with high profit margins. On the other hand, the market potential in Vietnam is still
quite large, so it can be said that this is an industry that attracts many domestic and foreign companies to
participate in the future. Barriers to entering the industry:
- Technology techniques: quality management technologies ( KCS ), complex formulations as well as
high requirements on packaging to ensure milk quality.
- Capital: to enter the industry, a large amount of initial investment is required for factories and
machinery…
- Commercial factors are difficult in creating a brand: customers are increasingly finding it difficult to
accumulate and create. There is no small pressure from the system of difficult customers in the
distribution area...
- Specific resources: such as input materials, especially raw materials must be imported from abroad,
human resources for production require high expertise…
Although this is a very attractive industry, Barriers to market entry are also not lacking in difficulties.
It can be said that in the future, milk products 100% pure pasteurized fresh milk products will face
many new domestic and foreign competitors.
- 1.5. Company development orientation
-
- Vision: Vinamilk will focus all resources to become a healthy dairy and food company with the
fastest and most sustainable growth in the Vietnamese market with a strategy to build product lines with
long-term competitive advantages.
-
- Mission: Vinamilk constantly diversification of product lines, expanding distribution territory to
maintain a sustainable oil leading position in the domestic market, and maximize the profitability of the
Company's shareholders.
The company's objectives and pursuit of a business development strategy are based on the following
key factors:
- Become 1 in 30 milk company the world's largest
- Leading in the first creative innovation nature high application
- Strengthening the leading position of Viet Nam dairy industry
- Become a dairy company that creates the most value in southeast ASIA
II.
SUSTAINABLE DEVELOPMENT
II.1 Define and explain sustainable development
II.1.1 Define sustainable development
-
Sustainable development is a development that meets the needs of the current generation without
damaging the ability of future generations to meet those needs based on a close and harmonious
combination of economic growth, solving social problems, and protecting the environment.
- 2.1.2 Explain the three economic: social, environmental and factors
-
Factors Sustainable Development in a business: a sustainable development enterprise needs 03
important and inseparable factors, including stable economic growth, solving social problems and
protecting the environment.
- Economic factors: is the process of achieving stable and steady economic growth; highly productive;
use science and technology in production without negatively affecting society and the environment.
Ensure the sustainability of the economy not only develops an increasingly healthy economy but also
avoids future economic recessions or stagnation.
- Social factor: is developed to ensure fairness in society, zero hunger and reduce poverty, create jobs,
increase incomes for workers, and ensure that people have the opportunity to have full access to basic
services such as health and education but don't cause adverse economic and environmental impacts.
Ensure social sustainability to create opportunities for everyone in society to be equal; reduce the risk of
social conflict or war.
- Environmental factor: is the rational use of natural resources, avoiding over-exploitation of available
resources; maintaining biodiversity, atmospheric stability; limiting the problem of environmental
pollution; mitigating the impacts of climate change and natural disasters;...Ensure environmental
sustainability to satisfy the natural and environmental needs of present and future generations.
II.2 Sustainable development at Vinamilk
-
Vinamilk has conducted the Sustainable Development Report since 2012 and is separate from the
Company's Annual Reports. This enterprise is always appreciated for its consistency with sustainable
development goals, maintaining growth in production and business activities in parallel with focusing on
human development, social responsibility activities, community-oriented and environmental protection.
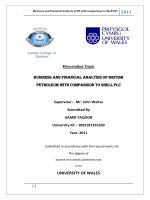
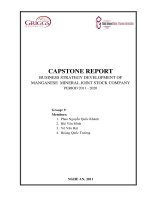
- Economic factor: Based on Vinamilk's financial report data from 2016-2020, the team drew a chart to
see the difference between profit after tax and corporate income tax.
Chart 01- Net income after Tax and Tax of Vinamilk in 2016- 2020 (Unit: billion)
-
In general, the company's profit after tax in 2017 increased compared to 2016. However, this number
decreased in 2018. The reason is that Vinamilk has paid a large amount for selling expenses such as
increasing promotions, displaying, introducing products, and supporting sales. Because of the purposeful
investment, Vinamilk's profit after tax quickly recovered and increased sharply in 2019 and 2020. It can be
said that investing in selling and marketing expenses has helped this company increase sales revenue as
well as gain more market share, in both old and new segments, old products, and new products. From the
above data, it can be concluded that: Vinamilk always maintains its No.1 position in Vietnam's dairy
industry because diversifying products to meet the nutritional needs of consumers; applying modern
equipment to cow raising and milking to improve milk yield and quality….
-
Vinamilk pays taxes at the District 7 Tax Department, Ho Chi Minh City- where this business is
headquartered. As well as profit after tax, the tax payable to the government of this company in 2017
increased compared to 2016; in 2018: decreased; 2019 and 2020: strong increase. Vinamilk has
contributed to promoting local economic development in dairy farms and factories; buying cow's milk
from farmers;... Despite all the fluctuations of Covid-19, Vinamilk has always actively contributed to
economic growth in Vietnam.
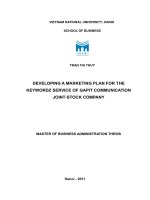
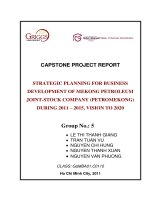
- Social factors: Based on Vinamilk's Sustainable Development Report, the team drew chart 02 to see the
increase in Vinamilk's employees over the years 2016-2020.
-
Chart 02: Number of employees at Vinamilk in 2016-2020 (Unit: people)
Through the chart above, it can be seen that the number of employees of Vinamilk increases year by
year. The company has contributed to creating jobs for thousands of people, buying milk from farmers,
and improving the material and spiritual life of its employees. Therefore, Vinamilk is always rated as one
of the best places to work in Vietnam. The Company has deducted 10% of profit after tax into the Bonus
and Welfare Fund to reward employees according to performance evaluation; implement the agreed
benefits under the Collective Labor Agreement and spend on social, charity and community activities...
Some benefits that this company's employees receive such as human resource training courses tablets;
routine health care; work-life balance (giving gifts to employees, giving gifts to employees' children,
vacations, sports-art activities...); regimes for female employees (maternity allowance, child care
allowance, gifts...); allowances and rewards (lunch allowance, right to buy and own shares, etc.).
-
In addition to the benefits for the company's employees, Vinamilk also actively organizes volunteer
programs for the community: community support activities (Mid-Autumn Festival, voluntary blood
donation, flood support,..); Vietnam Rising Milk Fund - for children in difficult circumstances, without
sufficient nutrients; The Vinamilk Scholarship Fund - Nurturing Vietnamese young talents - encourages
primary school students across the country to have good academic achievements and a spirit of excellence
in learning and training. Vinamilk is a company that implements social factors well; meets the target of 17
sustainable development goals of the United Nations as zero hunger, reduce poverty, healthy life, and
reduce inequalities.
- Environmental factors: As a company highly appreciated for sustainable development, Vinamilk
always seeks solutions to minimize adverse impacts on the environment; find ways to effectively use
inputs (materials, energy, water), and control outputs to minimize impacts on the environment. The
company has built the "Fund of one million trees for Vietnam" to propagate environmental awareness to
the community and contribute to a clean living environment. In addition, the company also organizes
internal programs such as: "Living green with Vinamilk", the "Green Project" collective contest for units,
the festival of exchanging boxes - for trees,…
-
Through the analysis of 3 factors of sustainable development, we determine that: Vinamilk’s a
sustainable development company with good economic growth and ensuring social and environmental
factors. Vinamilk will grow stronger and develop in the long term with the direction associated with
sustainable development as in the past years. This is good news for the company.
III.
STAKEHOLDER:
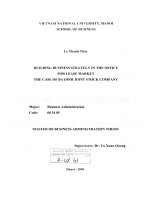
Internal Stakeholders
-
External Stakeholders
-
Employees: over 9,000
officials and employees
-
Manager: CEO – Mrs.
Mai Kiều Liên
-
Society: has performed
many charitable programs
for the community
Creditors: banks,
individuals
-
Suppliers: dairy
farms are important
strategic partners
Owners: Mrs. Lê Thị Băng
Tâm- President of the Board
of Management of Vinamilk
Shareholders:
-Large domestic shareholders
-Other shareholders in the
country
-Foreign shareholders
-Foreign shareholders own
more than 5% of the shares
Government: tax
code- 03005869
Customer:
-Communication channel retail point:
240,000
-Supermarket retail point: 5,400
-Convenience store channel retail point:
2,400
-Individuals, households
- Picture 01: Internal Stakeholders and External Stakeholders
3.1
Internal Stakeholders
- Employees: Vinamilk has over 9,000 staff and employees working in 40 units comprising branches,
factories, dairy farms, warehouses and subsidiaries, both domestic and overseas.
- Manager:
•
Mrs. Mai Kiều Liên: General Director
•
Mr. Mai Hồi Anh: International Business Executive Director and run a domestic business (Holding
512,511 shares of VNM at 0.02%).
•
Mr. Trịnh Quốc Dũng: The CEO of Development of Raw Materials Area (Holding 241,950 shares
of VNM at 0.01%).
•
Mrs. Nguyễn Thị Thanh Hịa: Supply Chain Executive (Holding 1,108,184 shares of VNM at
0.05%).
•
Mrs. Bùi Thị Hương: Executive Director of Personnel – Administration & Foreign Affairs (Holding
134,176 shares of VNM at 0.01%).
•
Mr. Nguyễn Quốc Khánh: Chief Executive Officer for Research and Development (Holding 29,755
shares of VNM at 0.00%).
•
Mr. Lê Thành Liêm: Chief Financial Officer and Chief Accountant (Holding 493,381 shares of
VNM at 0.02%).
•
Mr. Phan Minh Tiên: The CEO of Marketing (Holding 115,716 shares of VNM at 0.01%).
•
Mr. Trần Minh Văn: Executive Producer (Holding 887,236 shares of VNM at 0.04%).
- Owners:
•
Mrs. Lê Thị Băng Tâm: The Chairwomen of the Board of Directors, the head of the Personal
•
section, members of the Reward Subcommittee, Independent Board of Directors.
Mrs. Mai Kiều Liên: Member of the Managing Board, member of the Personnel Subcommittee,
member of the Strategic Subcommittee, general Director (Holding 6,400,444 shares of VNM at
00.31% until the date 31/12/2020 and 30,079 shares of the Vietnam Milk cow limited liability
•
Company until the date 30/06/2020).
Mrs. Đặng Thị Thu Hà: The Board of Directors does not run, member of the Auditing
•
•
Subcommittee, member of the Reward Subcommittee.
Mr. Đỗ Lê Hùng: The Board of Directors does not run, the Head of the Audit Committee.
Mr. Lê Thành Liêm: Member of the Board of Management, member of the Subcommittee of
Auditors, financial Executive director and chief accountant.
•
Mr. Lee Meng Tat: Member of the Board of Management does not run, member of the Strategic
•
Subcommittee, member of the Personnel Subcommittee.
Mr. Michael Chye Hin Fah: Member of the Board of Management does not run, member of the
Subcommittee of Audit, member of the Reward subcommittee.
3.2 External Stakeholders:
- Suppliers: Dairy farms are very important strategic partners of Vinamilk in providing consumers with
leading premium products.
- Society: Vinamilk has carried out many charity programs for the community.
• For example: Vietnam during fund; “For the health and safety of children – join hands to fight against
Covid-19”; A million tree fund for Vietnam; To finish the one million green trees milestone; A school
milk program; Pioneering brings optimal nutritional benefits to school age development; Covid-19
precention and control activities
- Government: Tax code: 03005869- pays taxes at the District 7 Tax Department, Ho Chi Minh City.
- Creditors:
• Short - term loan: 7,316,497,078,307 VND (31/12/2020).
- Table 02: Terms and conditions of current short-term loans with balances as follows:
- PRESEN - CURRENC
- LENDERS
T
Y
- 31/12/2020 VND
- Sumitomo Mitsui Banking
Corporation, Ho Chi Minh City
- (i)
- USD
- 2,130,220,000,000
- (i)
- VND
- 2,071,058,149,400
- (i)
- USD
- 1,670,816,000,000
- (i)
- USD
- 1,159,500,000,000
branch
- Joint Stock Commercial Bank for
Foreign Trade of Vietnam, Ho Chi
Minh City branch
- MUFJ Bank, Ho Chi Minh City
branch
- The Development Bank of Singapore
Limited
- HSBC Bank Vietnam Limited, Ho
- (i)
- VND
- 241,183,928,907
Chi Minh City branch
- HSBC Bank USA
- (ii)
- USD
- 23,010,000,000
(i)
These loans are not secured.
(ii)
This loan is secured by assets with a recorded value of 819,579 million VND on December
31st,2020 (January 1st,2020: 750,071 million VND)
•
Long-term loans: 167,421,748,884 VND (31/12/2020).
- Table 03: Terms and conditions of long-term loans currently have balances as follows:
- LENDERS
- HSBC Bank USA
- HSBC Bank USA
- Individual
-
- PRESEN - CURRENC - MATURIT
T
- (i)
- (ii)
- (ii)
Y
- USD
- USD
- VND
Y YEAR
- 2022
- 2022
- 2039
- 31/12/2020 VND
- 117,351,000,000
- 70,735,156,050
- 44,592,834
(i)
This loan is secured by assets with a carrying amount of 819.579 million VND on December
(ii)
31st,2020 (January 1st,2020: 750.071 million VND)
These loans are unsecured.
- Shareholders:
-
Table 04: Shareholder structure
- Major shareholder (>=5%)
- Domestic
- Foreign
- Treasury shares
- Other shareholders (<5%)
- Domestic
- Foreign
- Total
- Including
- Domestic
-
Foreign
-
OWNERSHIP RATE (%)
- 67.01%
- 36.00%
- 31.01%
- 0.01%
- 32.97%
- 6.23%
- 26.74%
- 100%
- 42.25%
- 57.75%
Shareholders: Such as a large list of
-
State Capital Investment and Trading Corporation–Limited Company: ownership 36.00%.
F&N Dairy Investments Pte Ltd (1): Owns 17.69%.
F&Nbev Manufacturing Pte, Ltd (1): ownership 2.70%.
Platinum Victory Pte, Ltd: Owns 10.62%.
Notes: (1) F&NBev Manufacturing Pte, Ltd is a wholly-owned subsidiary of F&N Dairy Investments
Pte, Ltd.
- Customers:
•
•
•
•
Media channel retail point: 240,000 VND
Supermarket retail point: 5,400
Convenience store channel retail point: 2,400
Individuals, households
IV. Evolution of the financial reports
- 4.1. Horizontal and vertical analysis
-
a) Balance sheet:
-
Table 05: Cash, Short – term receivables, Current liabilities, Fixed assets (Unit: Billion VND)
- TI
- 2016
- 2017
- 2018
- 2019
- 2020
- Cash
- 600
- 834
- 1,073
- 2,379
- 864
- Short–term receivables
- 2,867
- 4,592
- 4,639
- 4,503 - 5,187
- Current liabilities
- 6,973
- 10,196
- 10,640
- 14,443 - 14,213
- Fixed assets
- 8,321
- 10,609
- 13,365
- 14,894 - 13,854
Cash: Increase through the years 2016-2019, but fall sharply from 2019 to 2020.
-
-
Chart 03: The chart shows Vinamilk’s cash.
•
•
•
2016 – 2019: Raising 1,779 billion VND
2019 – 2020: Lost 1,515 billion VND
Businesses use money ineffectively use more efficiently.
Cash: Financial investment, paying part of the debt, advertising products for businesses, sending
banks
- Short-term receivables: Increase over the years from 2016 to 2020, an increase of 2,320 billion
VND
- Chart 04: The chart shows Vinamilk’s Short-term receivables.
•
The enterprise has not managed the receivables effectively Businesses should collect money faster.
Example: Negotiate and extend the payment term, renegotiate the discount (0.1% - 0.5%).
Short–term receivables: Negotiate and renew the payment term for old and new agents, renegotiate
the discount (0.1% - 0.5%).
- Current liabilities: Increase over the years from 2016 to 2020, 7,230 billion VND.
- Chart 05: The chart shows Vinamilk's current liabilities.
•
Lots of current liabilities, lots of risks for businesses collect receivables to pay debts,
push inventory (2020: 4,905 billion VND) to collect interest on debt repayment.
Current liabilities: collect receivables to pay debts, push inventory to collect interest to pay part of
short-term debts
- Fixed assets: Increase from 2016 - 2019 (6,573 billion VND), decrease slightly from
2019 - 2020
(1,040 billion VND)
- Chart 06: The chart shows Vinamilk’s Fixed assets.
•
This asset is used inefficiently, tangible fixed assets account for the highest proportion leased to
other businesses.
Fixed assets: increase in the period 2016 - 2019, this shows that the business is expanding its
market size, slightly decreasing 2019 - 2020 due to the increase in asset depreciation costs.
-
b) Statement of results of business activities:
-
Table 06: Revenues of sales and services, financial income, financial expenses, net income after tax
- Unit: Billion VND
- YEAR
- REVENUES OF SALES
AND SERVICES
- FINANCIAL INCOME
- FINANCIAL EXPENSES
- NET INCOME AFTER TAX
- 2016
- 2017
- 2018
- 2019
- 2020
- 46,965
- 51,135
- 52,629
- 56,400
- 59,723
- 723
- 102
- 9,364
- 816
- 87
- 10,278
- 760
- 118
- 10,206
- 807
- 187
- 10,554
- 1,581
- 309
- 11,236
-
Chart 07: The chart shows Vinamilk’s Revenues Of Sales And Services & Net Income After Tax
- Revenues of sales & services: Increase over the years from 2016 to 2020 (1,872 billion VND).
- Profit after corporate income tax: Increase over the years from 2016 to 2020 (12,758 billion VND)
- Reduce costs as low as possible such as discounts, financial expenses, selling and administrative
expenses renegotiating discounts with agents; for financial expenses, enterprises should more closely
manage financial activities, cut down if such activities are high risk; for selling expenses, enterprises
should cut unnecessary selling expenses; for corporate management costs, businesses should rebuild
KPIs for employees to achieve higher productivity and revenue
- Financial income: Slightly fluctuating from 2016 to 2018, increasing from 2018 to 2020 (821 billion
VND)
- Chart 08: The chart shows Vinamilk’s Financial income
• Expenses of large enterprises, increasing over the years Keep costs as low as possible.
- Financial expenses: Slightly changed from 2016 to 2018, increased from 2018 to 2020 (191
billion VND)
- Chart 09: The chart shows Vinamilk’s Financial expenses
• The enterprise has not managed this account effectively Use cash to pay down, push inventory to
•
collect interest to pay down debt.
Profits or investment returns of large enterprises Businesses should use it more efficiently.
Example: Pay off part of the debt, use the money to advertise, P.R products of the business.
4.2 Analyzing the ratios
4.2.1 Liabilities ratios
Liquidity ratios are an important group of financial ratios used to determine a business's ability to pay
its debts in the short term without the need to raise external capital. It includes the current ratio and the
quick ratio.
- 4.2.1.1 The current ratio is a financial ratio that measures a company's ability to pay its short-term debt
obligations. It’s calculated using the formula below:
-
- The current ratio =
-
- Calculate and draw line chart: Table 01 and chart 01 show the current ratio of Vinamilk
Company from 2016-2020.
-
Table 07: Current Asset, Current Liabilities, The Current Ratio, Industry Average
- Year
- 2016
- 2017
- 2018
- 2019
- 2020
- CURRENT ASSET (billion)
- 18,674
- 20,307
- 20,560
- 24,722
- 29,666
- CURRENT LIABILITIES (billion)
- 6,457
- 10,196
- 10,640
- 14,443
- 14,213
- THE CURRENT RATIO
- INDUSTRY AVERAGE
- 2.89
- 2.39
- 1.99
- 2.39
- 1.93
- 2.39
- 1.71
- 2.39
- 2.09
- 2.39
-
Chart 10: The chart shows Vinamilk’s current ratio in 2019-2020
- Explain: The company's current assets were 2,89 times the current liabilities in 2016; 1,99 times in
2017; 1,93 times in 2018; 1,71 times in 2019 and 2,09 times in 2020. Vinamilk's current assets are
sufficient to pay its short-term liabilities when they come due.
- Trending: Through chart 01, we can conclude that: the current ratio decreased from 2016 to 2019: not
good for the company; and increased sharply from 2019 to 2020 (because current assets increase and
current liabilities decrease in 2020): so good for the company.
- Comparing: Through chart 01, we can see that: the current ratio of 2016 is larger than the industry
average: good for the company. However, from 2017-2020 these ratios have decreased and are lower
than the industry average: not good for the company; but the current ratio in 2020 increased slightlythat's great news for Vinamilk.
- Recommendation: Current ratio is increasing and is close to the industry average --> good for the
company, needs to be promoted. The company's short-term debt is a lot, it needs to repay the seller by:
• Selling inventory: pr, marketing and advertising for the products and company; provide promotional
policies to consumers; increase discounts for distributors and agents;…
• Collecting debt from customers: offer discounts and discounts if buyers pay early; agree
with the customer on the payment time in the contract;…
-
4.2.1.2 The quick ratio: measures a company's ability to meet its short-term debt obligations with
its most liquid assets. This ratio is calculated by the formula:
- - The quick ratio =
- - Calculate and draw line chart: Vinamilk's quick ratio in 2016- 2020
- Table 08: Current Assets, Inventory, Current Liabilities, The quick ratio, Industry Average
- Year
- 2016
- 2017
- 2018
- 2019
- 2020
- Current Assets
- 18,674
- 20,307
- 20,560
- 24,722
- 29,666
- Inventory
- Current Liabilities
- The quick ratio
- Industry Average
--
- 4,522
- 6,457
- 2.19
- 1.65
- 4,021
- 10,196
- 1.6
- 1.65
- 5,526
- 10,640
- 1.41
- 1.65
- 4,983
- 14,443
- 1.37
- 1.65
- 4,905
- 14,213
- 1.74
- 1.65
- Chart 11: The chart shows Vinamilk’s Vinamilk's quick ratio in 2016- 2020
- Explain: Current assets minus inventory is 2.19 times the current liabilities in 2016; 1.6 times in 2017;
1.41 times in 2018; 1.37 times in 2019 and 1.74 times in 2020. Vinamilk's short-term assets, after
deducting inventory, are still sufficient to pay short-term debts when they come due.
- Trending: Looking at chart 02, we see that the quick ratio decreased sharply from 2016-2019: it's not
good for the company, and this ratio increased a lot in 2020: it's great news for Vinamilk.
- Comparing: The quick ratio of 2016 is larger than the industry average: good for the company. From
2017-2019, the quick ratios have decreased and are lower than the industry average: not good for the
company; but this ratio in 2020 increased more than the industry average: it’s so good.
- Recommendation
• Continue to promote and maintain a higher ratio of 1.65 as done in 2020.
• Lots of inventory -> handling inventory by:
Pr for the Company, marketing and advertising for the products to be known by many people.
Vinamilk is a company that has been known to Vietnamese consumers for a long time; so it should
refresh Marketing messages, change the way its products are marketed,...so that it becomes more
popular and different from what consumers know about it.
Provide promotional policies to consumers when they buy products in combos; give gifts to
customers when they buy goods on the 2nd, 3rd time; flash sale;...
Sell inventory on e-commerce sites like Shopee, Lazada, Sendo,...
Increase discounts for distributors and agents to make them buy more products.
4.2.2 The activity ratios
-
The activity ratio measures a company's performance measuring the different accounts that can
convert into revenues or cash flows. Measures the effectiveness of managing accounts: receivable,
inventory, payable, fixed assets, and total assets.
-
4.2.2.1 Inventory Turnover: Measure performance or liquidity of inventories.
-
- Inventory Turnover =
- 2016
- 2017
- 2018
- 2019
- Cost of goods sold
- 24,458
- 26,806
- 27,950
- 29,745
(billion)
- Inventory (billion)
- 4,521
- 4,021
- 5,525
- 4,983
- Inventory Turnover - 5.4
- 6.67
- 5.06
- 5.97
- Industry Average
- 6.43
- 6.43
- 6.43
- 6.43
- Table 09: Cost of goods sold, Inventory, Inventory Turnover, Industry Average
-
- 2020
- 31,967
- 4,905
- 6.52
- 6.43
Chart 12: The chart shows Vinamilk’s Inventory turnover of Vinamilk from 2016 to 2020
-
Explain: Inventory turnover (2016) is 5.4 which means that inventory converted into revenue 5.4
-
times in 2016; 6.67 times in 2017; 5.06 times in 2018; 5.97 times in 2019; 6.52 times in 2020.
Trending: Vinamilk's inventory turnover for 2016-2020 in a zigzag pattern. It increased in 2017: it's
good for the company; decreased sharply in 2018: it's not good for the company; gradually increase
-
in 2019 and 2020: it's great news
Comparing: This ratio is lower than i.a in 2016: not good; greater 0.24 time than i.a in 2017- larger
than the industry average slightly: good. But in 2018 and 2019, inventory turnover is lower than i.a:
-
not good. And in 2020, it increased slightly than i.a: good
Recommendation: Push inventory as fast as possible
Promote Marketing.
Discount on inventory items, use flash sale strategy and give attached gifts.
Market expansion, product refresh, or remarketing.
-
4.2.2.2 Average payment period: The average days required to pay for sellers.
-
- Average payment period =
- Payables (Billion)
- 2016
- 2,562
- 2017
- 3,965
- 2018
- 3,991
- 2019
- 3,648
- 2020
- 3,199
- Cost of goods sold (Billion)
- Average payment period (day)
- 24,458
- 39
- 26,806
- 54
- 27,950
- 53
- 29,745
- 45
- 31,967
- 37
T
a
ble 10: Payables, Cost of goods sold, Average payment period
-
Chart 13: The chart shows Vinamilk’s Average payment period
-
Explain: in 2016, an average of 39 days for enterprises to pay debts to suppliers, loans from credit
-
institutions and banks; 54 days in 2017; 53 days in 2018; 45 days in 2019 and 37 days in 2020.
Trending: the average payment period from 2016 to 2017 sharply increased from 39 to 54 days not
-
goof for the company. But it gradually decreased from 2017-2020 it's great news.
Recommendation: Enterprises are effectively managing this ratio, need to promote it by
For suppliers of old materials: need to renegotiate the repayment period after 30 days.
For suppliers of New Materials: payment agreement after 30 days
These agreements should be clearly stated in the contract.
-
4.2.2.3 Average collection period: The average days to collect receivables, evaluate the fast or slow
payments to make decisions for the debt collection policy.
-
- Average colletion period =
- Table 11: Receivables, Net Revenues, Average collection period, Industry Average.
- Receivables (billion)
- Net Revenues (billion)
- Average collection period (day)
- Industry Average (day)
- 2016
- 2,888
- 46,794
- 23
- 17.20
- 2017
- 4,645
- 51,041
- 34
- 17.20
- 2018
- 4,727
- 52,561
- 33
- 17.20
- 2019
- 4,524
- 56,318
- 30
- 17.20
- 2020
- 5,207
- 59,636
- 32
- 17.20
--
Chart 14: The chart shows Vinamilk’s Average collection period from 2016 to 2020
-
Explain: in 2016, on average of 21 days, businesses collect the debt once from customers; 34 times
-
in 2017; 33 times in 2018; 30 times in 2019 and 32 times in 2020.
Trending: average collection period from 2016 to 2017 increased strongly and maintained a
-
relatively high level until 2020 not good for the company
Comparing: the average collection period over the years is larger than the industry average the
-
company does not manage its receivables well, is misappropriated capital by partners.
Recommendation: the company should have a better policy to overcome this situation.
The company needs to have a clear payment policy to limit the problems that arise: requiring
customers to sign an agreement, stipulating that payment must be made on time and specifying
the penalty that customers must bear if payment is late.
For new customers (new agents, distributors): specify payment term within 15 days.
For old customers, need to renegotiate the payment term of 15 days or less.
-
4.2.2.4 Total asset turnover: Show effectiveness in using the assets to create revenues.
-
- Total asset turnover =
-
Table 12: Net Revenues, Total assets, Total asset turnover, Industry Average
- Net Revenues (Billion)
- Total assets (Billion
- total asset turnover
- Industry Average
- 2016
- 46,794
- 29,378
- 1.59
- 1.27
- 2017
- 51,041
- 34,667
- 1.47
- 1.27
-
- 2018
- 52,561
- 37,368
- 1.41
- 1.27
- 2019
- 56,318
- 44,699
- 1.26
- 1.27
- 2020
- 59,636
- 48,432
- 1.23
- 1.27
-
Chart 15: The chart shows Vinamilk’s Total asset turnover from 2016 to 2020
-
Explain: For every 1 VND of total assets, it generates 1.59 VND in net revenue in 2016; 1.47 in 2017;
-
1.41 in 2018; 1.27 in 2019 and 1.23 in 2020.
Trending: is decreased => it's not good for the company Indexes in 2019 and 2020 are lower than the
-
industry average.
Comparing: Vinamilk’s Total asset turnover from 2016 to 2018 are larger than i.a: good for company.
But this ratio in 2019 and 2020: are lower than the industry average- not good.
Using total assets to generate the net revenues of the company is not efficient.
Recommendation:
Increase revenue by pushing inventory.
Accelerate products to compete and expand the market.
Reduce reseller discounts as low as possible to increase demand.
Strengthen fixed asset management and effective use.
-
-
4.2.2.5 Total equity turnover: Show how much amount of equity to create how much amount of
revenues.
-
- Total equity turnover =
-
Table 13: Net revenues, Equity, Total equity turnover, Industry Average
- Net revenues (Billion)
- Equity (Billion)
- 2016
- 46,794
- 22,405
- 2017
- 51,041
- 23,873
- 2018
- 52,561
- 26,271
- 2019
- 56,318
- 29,731
- 2020
- 59,636
- 33,647
- Total equity turnover
- Industry Average
-
- 2.1
- 2.84
- 2.14
- 2.84
-2
- 2.84
- 1.89
- 2.84
- 1.77
- 2.84
-
Chart 16: The chart shows Vinamilk’s Total equity turnover from 2016 to 2020
-
Explain: For every 1 VND of equity, it generates 2.1 VND in net revenue in 2016; 2.14 in 2017; 2 in
-
2018; 1.89 in 2019 and 1.77 in 2020.
Trending: From 2016 to 2017, the ratio increased slightly but from 2017 to 2020 it tends to decrease.
-
It’s not good for the company.
Comparing: The Vinamilk’s Total equity turnover of all 5 years is lower than the industry average.
-
The company uses owner's Equity inefficiently.
Recommendation: Use equity more efficiently by use part to pay off long-term debt. Increase net
revenues by:
Increase revenue by pushing inventory.
Accelerate products to compete and expand the market.
Reduce reseller discounts as low as possible to increase demand.
4.2.3 The debt ratios
-
4.2.3.1 Debt ratio: Measuring the total assets that are supported by the company’s creditors.
This ratio is high, which means using the finance of creditors to create the profits will higher
- Debt ratio =
- Table 14: Total debts, Total assets, Debt ratio, Industry Average
- Total debts (Billion)
- Total assets (Billion)
- Debt ratio (%)
- 2016
- 6,972
- 29,378
- 24
- 2017
- 10,792
- 34,667
- 31
- 2018
- 11,094
- 37,366
- 29
- 2019
- 14,968
- 44,699
- 33
- 2020
- 14,785
- 48,432
- 30
- Industry Average (%)
- 85
- 85
- 85
- 85
- 85
-
Chart 17: The chart shows Vinamilk’s Debt ratio from 2016 to 2020
•
Explain: total debt accounted for 24% of total assets in 2016; 31% in 2017; 29% in 2018; 33% in
•
2019 and 30% in 2020.
The trending: increased sharply in 2016-2017 and 2018-2019 => Not good for the company.
•
•
Decreased in 2017-2018 and 2019-2020: good for company.
Comparing: this ratio is much lower than the industry average => This is great for the company
Recommendation: Through the balance sheet, we know that Vinamilk's structure of capital invested
and mobilized in the production and business process has low financial initiative. Vinamilk need to
reduce debt and prioritize long-term debt using a portion of equity or inventory turnover.
-
4.2.3.2 Debt on equity: Measure the level of using the equity in business activities.
-
- Debt on equity =
-
Table 15: Total debts, Total owner’s equity, Debt on equity, Industry Average
- 2016
- 2017
- 2018
- 2019
- 2020
- Total debts (Billion)
- 6,972
- 10,792 - 11,094 - 14,968 - 14,785
- Total owner’s equity (Billion)
- 22,405 - 23,873 - 26,271 - 29,731 - 33,647
- Debt on equity
- 0.31
- 0.45
- 0.42
- 0.50
- 0.44
- Industry Average
- 1.02
- 1.02
- 1.02
- 1.02
- 1.02
Chart 18: The chart shows Vinamilk’s Debt on equity from 2016 to 2020
•
Explain: Vinamilk's total debt accounted for 31% of its total equity in 2016; 45% in 2017; 42% in
•
2018; 50% in 2019 and 44% in 2020.
Trending: The ratio tends to increase sharply in 2016-2017 and 2018-2019 => not good for the
company. But it's decreased in 2017-2018: good for company. much lower than the industry average
•
=> Should continue to maintain this level.
Comparing: Vinamilk’s Debt on equity from 2016 to 2020 are much lower than the industry average
•
=> Good for company, should continue to maintain this level.
Recommendation: Debt on equity ratio is more stable than i.a. The company's financial balance is
very good. But Vinamilk needs reduce total debt to a minimum.
-
4.2.3.3 Interest coverage ratio: Measuring the enterprise’s ability to pay interest from profit.
The high ratio shows that the company can pay interest when it’s due.
-
- Interest coverage ratio =
-
Table 16: EBIT, Interest amount, Interest coverage ratio, Industry Average
-
- 2016
- 2017
- 2018
- 2019
- 2020
- EBIT (Billion)
- 11,340
- 12,315
- 12,169
- 12,982
- 13,827
- Interest amount (Billion)
- Interest coverage ratio
-
- 46.5
- 243.87
- 29
- 418.36
- 51
- 236.9
- 108.8
- 119.3
- 143.8
- 96.14
-
Chart 19: The chart shows Vinamilk’s interest coverage ratio from 2016 to 2020
-
Explain: EBIT is 234.87 times the company's interest expense in 2016; 418.36 in 2017; 236.9 in 2018;
119.3 in 2019; 96.14 in 2020. Over the years, earnings before interest and taxes were enough to pay off
loan interest when it came due.
Trending: In 2017, the index nearly doubled compared to 2016. But it gradually decreased and went
-
very low until 2020 only 95 times. In 2017, the company operated very efficiently. Revenue increased
slightly, but interest expense decreased by half. In the following years to 2020, although revenue
increased, interest expenses increased too quickly. A part of the company has more long-term loans,
causing the solvency ratio to decrease.
Recommendation: Continue to maintain because although many businesses have debts, they are still
-
able to pay interest because most debts do not generate interest such as: payables to sellers, taxes,
payable to employees. Pay down long-term debt because long-term debt has a higher interest rate
- 4.2.4 The profitability ratios
-
4.2.4.1 Gross profit margin: Evaluating the profit level after minus the cost of goods sold.
-
The higher ratio is better.
- Gross profit margin =
- Calculate and draw line chart: The Table 17 and chart 20 below give information about the Gross
profit margin of Vinamilk Company and the industry average from 2016 to 2020:
- Table 17: Gross Profit, Net Revenues, Gross Profit Margin, Industry Average
- Years
- 2016
- 2017
- 2018
- 2019
- 2020
- Gross Profit (billion)
- 22,336
- 24,234
- 24,611
- 26,572
- 27,669
- Net Revenues (billion)
- 46,794
- 51,041
- 52,562
- 56,318
- 59,636
- Gross Profit Margin
- 47.73% - 47.48%
- 46.82%
- 47.18%
- 46.4%
- Industry Average
- 34.34% - 34.34%
- 34.34%
- 34.34%
- 34.34%
-
-
Chart 20: The chart shows Vinamilk’s Gross profit margin from 2016 to 2020
- Explain: The gross profit of Vinamilk accounted for 47.73% of the net revenues in 2016; 47.48% in
2017; 46.82% in 2018; 47.18% in 2019 and 46.4% in 2020.
- Trending: Through the chart, we can conclude that the trend of this ratio from 2016 to 2018 decreases
so it is not good for the firm. But from 2018 to 2019, the trend increases from 46.82% to 47.18%, which
is good for the firm. The trend from 2019 to 2020 declines from 47.18% to 46.4%.
- Comparing: Although there are fluctuations in annual the ratio of 5 years is higher than the industry
average too much.
- Recommendation: Through chart 20, we see that the net profit margin of the business tends to decrease
but not significantly => The enterprise maintains a good stability while continuing to expand both
domestic and foreign markets. Businesses should keep this form and develop more in the coming years especially the years still affected by the Covid-19 pandemic such as:
• PR, advertising for products – especially products such as liquid milk, yogurt, cheese,..=> boosting
•
•
-
inventory.
Stock up on input materials such as whole milk powder, find suppliers of materials with better
prices => limit input price hikes due to the pandemic.
Continue to expand foreign markets (be careful in exporting, PR for products, ..)
4.2.4.2 Operating profit margin: Measure the percentage of sales earned after expenses are
subtracted. Showing one VND of net revenues can create how much profit.
- - EBIT = Financial expenses (interest) + Net income before Tax
- - Operating profit margin =
-
- Calculate and draw line chart: The Table and chart below give information about the Operating
profit margin of Vietnam Dairy Products Joint Stock Company and the industry average from 2016 to
2020
-
Table 18: Financial expenses (interest), Net income before Tax, EBIT, Net revenue, Operating profit
margin, Industry Average
- Years
- 2016
- 2017
- 2018
- 2019
- 2020
- Financial expenses (interest) (billion) - 47
- 29
- 51
- 109
- 144
- Net income before Tax (billion)
- 11,238
- 12,229
- 12,052
- 12,796
- 13,519
- EBIT (billion)
- 11,285
- 12,258
- 12,103
- 12,905
- 13,663
- Net revenue
- 46,794
- 51,041
- 52,562
- 56,318
- 59,636
- Operating profit margin
- 24.12% - 24.02%
- 23.03%
- 22.91%
- 22.91%
- Chart 21: The chart shows Vinamilk's Operating profit margin from 2016 to 2020.
- Explain: The earning before interest and Tax (EBIT) accounted for 24.12% of the net revenue in 2016;
24.02% in 2017; 23.03% in 2018; 22.91% in 2019 and 2020.
- Trending: Through the chart, it is clear that we can conclude that the trend of ratio from 2016 to 2019
decreases, especially, the trending declines significantly from 2017 to 2018, which is not good for the
firm. The trend from 2019 to 2020 has not changed, is 22.91%.
- Comparing: Although the annual rate decreases. However, this ratio of 5 years is higher than the
industry average. The operating profit margin accounts for a high proportion compared to the industry
average.
-
- Recommendation: Operating profit margin accounting for a relatively high proportion, although it
tends to decrease over the years, but it is still higher than the industry average, showing that the enterprise
is operating efficiently keep investing but has tight control in the future.
-
4.2.4.3 Net profit margin: the percentage of profit that the company can create when compared
with net revenue. Net profit margin =
- - Calculate and draw line chart: The Table 19 and chart 22 below give information about the Net profit
margin of Vietnam Dairy Products Joint Stock Company and the industry average from 2016 to 2020:
- Table 19: Net income after Tax, Net revenue, Net profit margin, Industry Average
- Years
- 2016
- 2017
- 2018
- 2019
- 2020
- Net income after Tax (billion)
- 9,364
- 10,278
- 10,206
- 10,554
- 11,236
- Net revenue (billion)
- 46,794
- 51,041
- 52,562
- 56,318
- 59,636
- Net profit margin
- 20.01%
- 20.14%
- 19.42%
- 18.74%
- 18.84%
- Industry Average
- 17.54%
- 17.54%
- 17.54%
- 17.54%
- 17.54%
- Chart 22: The chart shows Vinamilk’s Net profit margin from 2016 to 2020.
- Explain: The net income after Tax accounted for 20.01% of the net revenue in 2016; 20.14% in
-
2017; 19.42% in 2018; 18.74% in 2019; 18.84% in 2020.
-
- Trending: Through the chart, it is clear that we can conclude that the trend of ratio from 2016 to
2017 is rise marginally, which is good for the firm. However, the trending declines substantially from 2017
to 2019, which is not good for the firm. But from 2019 to 2020, the trend of ratio is rise minimally
- Comparing: Although there are fluctuations in annual the ratio of 5 years is higher than the
-
industry average too much. The Net income after Tax of Vinamilk company during 5 years accounted for a
very high proportion compared to the industry average.
-
- Recommendation of 3 indexes: Vinamilk has fluctuated up and down over the years, but in
general, from 2016-2020, the business is not operating efficiently and tends to decrease in the industry
average. This shows that the business is lagging behind other businesses. Make recommendations such as:
•
•
Discount: stop discounting for inefficient dealers - renegotiate discount rates for old agents
Reduce the cost of goods sold: negotiate material discounts for old suppliers, find new suppliers of
•
materials with better prices.
Cost of sales: effectively building a set of KPIs for employees - dismissing inefficient employees -
•
opening training courses to improve quality
Financial activities: continue to invest but have tight control
-
4.2.4.4 Earning per share (EPS): EPS represents the amount earned during the period that is based
on the common stock. EPS =
-
- Calculate and draw line chart: The Table 20 below give information about the EPS of Vietnam
Dairy Products Joint Stock Company from 2016 to 2020
- Years
Table 20: Net income after Tax, Number of common stocks, EPS
- 2016
- 2017
- 2018
- 2019
- 2020
- Net income after
Tax (billion)
- Number of
common stocks
- 9,364
- 10,278
- 10,206
- 10,554
- 11,236
- 1,451,426,32 - 1,451,278,52 - 1,741,411,583 - 1,741,377,69 - 2,089,676,34
9
0
4
6
- EPS (VNĐ)
- 6,452
- 7,082
-
- 5,861
- 6,061
- 5,377
- Explain: One share can earn 6,452 VNĐ in 2016; 7,028 VNĐ in 2017; 5,861 VNĐ in 2018; 6,061 VNĐ
in 2019 and 5,377 VNĐ in 2020.
- Trending: The trending of this ratio fluctuates unevenly from 2016 to 2020:
• The trend of ratio from 2016 to 2017 and from 2018 to 2019 increases.
• The trend of ratio from 2017 to 2018 and from 2019 to 2020 decreases.
- - Recommendation
• The number of shares issued by Vinamilk increases year by year:
- One share can earn 7,082 VNĐ in 2017 that get the highest than 2016-2020.
- In 2020 one share get the lowest from 2016-2020 can earn 5,377 VNĐ.
• Number of shares increased sharply over 5 years and income after tax increased slightly after 5
years.
-
4.2.4.5 Return on total assets (ROA): Measure the overall efficiency of using existing assets to
make profits. The higher ratio is better. ROA =
- - Calculate and draw line chart: The Table 21 and chart 23 below give information about the ROA of
Vietnam Dairy Products Joint Stock Company and the Industry Average from 2016 to 2020.
- Table 21: Net income after Tax, Total assets, ROA, Industry Average
- Years
- 2016
- 2017
- 2018
- 2019
- 2020
- Net income after Tax
- 9,364
- 10,278
- 10,206
- 10,554
- 11,236
- Total assets
- 29,379
- 34,667
- 37,366
- 44,700
- 48,432
- ROA
- 31.87%
- 29.65%
- 27.31%
- 23.61%
- 23.2%
- Industry Average
- 22.47%
- 22.47%
- 22.47%
- 22.47%
- 22.47%
- Chart 23: The chart shows Vinamilk’s ROA from 2016 to 2020.
- Explain: The net income after Tax accounted for 31.87% of the total assets in 2016; 29.65% in 2017;
27.31% in 2018; 23.61% in 2019; 23.20% in 2020.
- Trending: Through the chart, it is clear that we can conclude that the trend of ratio from 2016 to 2018
dropped significantly from 31.87% to 23.2%, and slow down rate slowly from 2018 to 2019.
- Comparing: Although the annual rate decreases. However, this ratio of 5 years is higher than the
industry average.
-
- Recommendation:
The net income after tax is effective.
ROA over the years tends to decrease due to a strong increase in total assets and a slight increase in
•
•
profit after the position. This shows: Vinamilk is continuing to expand the market, but profits only
increase slightly -> not making the most of resources: not good for business
-
4.2.4.6 Return on common equity (ROE): Measuring the ability of creating profit on the equity.
-
- ROE =
- - Calculate and draw line chart: The Table 22 and chart 24 below give information about the ROE of
Vietnam Dairy Products Joint Stock Company and the Industry Average from 2016 to 2020:
-
Table 22: Net income after Tax, Owner’s equity, ROE, Industry Average
- Years
- 2016
- 2017
- 2018
- 2019
- 2020
- Net income after Tax
- 9,364
- 10,278
- 10,206
- 10,554
- 11,236
- Owner’s equity
- 22,406
- 23,873
- 26,271
- 29,731
- 33,647
- ROE
- 41.79%
- 43.05%
- 38.85%
- 35.5%
- 33.4%
- Industry Average
- 28.88%
- 28.88%
- 28.88%
- 28.88%
- 28.88%
-
-
Chart 24: The chart shows Vinamilk’s ROE from 2016 to 2020.
- Explain: The net income after Tax accounted for 41.79% of owner’s equity in 2016; 43.05% in 2017;
38.85% in 2018; 35.5% in 2019; 33.4% in 2020.
- Trending: Through the chart, it is clear that we can conclude that the trend of ratio from 2016 to
2017 increases slightly. However, the trending decreases dramatically from 43.05% to 33.4% in 2017 to
2020.
- Comparing: Although there are fluctuations in annual the ratio of 5 years is higher than the industry
average too much
- Recommend: Owner's equity increased over the years and profit after tax only increased slightly,
making ROE decreased => Not good for investors.
4.2.5 The market ratios
-
4.2.5.1 Price/ Earning ratio (P/E): to create the measure the number of investors are willing to pay
for each earnings. The higher the P/E ratio makes the greater confidence for investors.
-
- P/E =
- - Calculate and draw line chart: The Table 23 below give information about the P/E of Vietnam Dairy
Products Joint Stock Company from 2016 to 2020:
- Table 23:
- Years
- 2016
- 2017
- 2018
- 2019
- 2020
- The market price (VNĐ)
- 128,600
- 203,500
- 124,000
- 116,500
- 108,800
- EPS (VNĐ)
- 6,452
- 7,082
- 5,861
- 6,061
- 5,377
- P/E
- 19.93
- 28.73
- 21.16
- 19.22
- 20.23
- Explain: The market price is bigger than earning per share 20 times in 2016; 29 times in 2017; 21 times
in 2018; 19 times in 2019; 20 times in 2020.
- Trending: Through the table, it is clear that we can conclude that the trend rises dramatically from 2016
to 2017 after that declines in 2018. From 2019 to 2020, the trending is increased slightly.
-
- Recommendation: Increases income after tax by: push inventory and faster debt collection
-
4.2.5.2 Market/ Book ratio (M/B): It evaluates the company’s performance.
-
- Book value per share of common stock =
-
- Book value = Total assets - Invisible assets - Total debts
-
Table 24: Total assets, Invisible assets, Total debts, Book value
- Years
- 2016
- 2017
- 2018
- 2019
- 2020
- Total assets (billion)
- 29,379
- 34,667
- 37,366
- 44,700
- 48,432
- Invisible assets (billion)
- 405
- 319
- 318
- 1 150
- 1 137
- Total debts (billion)
- 6,973
- 10,794
- 11,095
- 14,969
- 14,785
- Book value (billion)
- 22,001
- 23,554
- 25,953
- 28,581
- 32,510
- Table 25: Book value, Number of common stock, Book value per share of common stock
- Years
- 2016
- 2017
- 2018
- 25,953
- 22,001
- Number of common
- 1,451,426,32 - 1,451,278,520 - 1,741,411,58 - 1,741,377,694 - 2,089,676,34
9
- 28,581
- 2020
- Book value (billion)
stock
- 23,554
- 2019
3
- Book value per share - 15,158
- 16,230
- 32,510
6
- 14,903
- 16,413
- 15,557
of common stock
(VNĐ)
IV.3.
Ratios’ table:
- Table 26: The ratio’s table of Vinamilk from 2016 to 2020
- NO
-I
-1
-2
- II
- THE
RATIOS
- 2017
- 2018
- 2019
- 2020
- INDUSTRY
- EVALUATE
AVERAGE
- The liquidity
ratios
- The current
ratio
- The quick
ratio
-
-
-
-
-
-
-
- 2.89
- 1.99
- 1.93
- 1.71
- 2.09
- 2.19
- Slow
- 2.19
- 1.60
- 1.41
- 1.37
- 1.74
- 1.65
- High
- The activity
ratios
-
-
-
-
-
-
-
- 5.4
- 6.67
- 5.06
- 5.97
- 6.52
- 6.43
- High
- 39
- 54
- 53
- 45
- 37
-/
-
- 23
- 34
- 33
- 30
- 32
- 17.20
- Good
- 1.59
- 1.47
- 1.41
- 1.26
- 1.23
- 1.27
- Slow
- 2.1
- 2.14
-2
- 1.89
- 1.77
- 2.84
- Slow
-
-
-
-
-
-
-
- 24
- 31
- 29
- 33
- 30
- 85
- Good
- Inventory
turnover
- Average
-2
payment
period
- Average
-3
collection
period
- Total asset
-4
turnover
- Total equity
-5
turnover
- The debt
- III
ratios
- Debt on asset
-1
(%)
-1
- 2016