diagram lecture arch pres meth 22 oct 2018
Bạn đang xem bản rút gọn của tài liệu. Xem và tải ngay bản đầy đủ của tài liệu tại đây (5.99 MB, 9 trang )
this is not a diagram, but, to diagram, you need to take apart, to put together, to
explain, to yourself and to others, and so you may need this kind of information as
you take steps along the way . . .
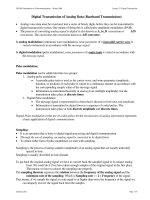
Adolf Loos: Rufer and Scheu Houses, Vienna
Rufer exploded axon (student work by Jonathan Bell)
and begin to separate out the parts . . .
The origin of the word analysis comes from an
older word meaning to loosen. Here the purposeful
Ghost Car - 1939 Plexiglas Pontiac Deluxe Six posted by Nefeli Aggellou
/>
a
diagram
Oxnard House by
Steven Holl from Holl,
S. (1991). Anchoring.
New York: Princeton
Architectural Press, pp.
126-127.
can be used to explain a building,
using abstraction to graphically represent
a concept,
idea, or relationship.
exploding of the drawing has been used to take the ‘loosened’
parts of a building and separate them outwards, so each can be
seen more clearly, while maintaining their orientation of
connection. We can mentally put them together.
introducing the
diagram
and some of the many issues
diagrams can work with, articulate and describe
Hanoi Architectural University: Architectural Presentation Methods: Fall 2014
(there are many potential Issues to work with in) Architectural Analysis
Concept / Inspiration/ Research Base / Parti
Time, Culture and Climate
Figure / Ground
Site / Orientation in Plan, Section and Massing
Spatial Hierarchy / Plan to Section
Movement / Thresholds for Site and Building
Functions for Site and Building
Private / Public
Structure
Enclosure and the Building Skin as a Filter
Materiality
Composition, Geometry and Proportion
Transparency / Translucency / Views
Light, Heat
Ventilation
Acoustical Character
Additive / Subtractive
Repetitive / Unique
the
diagram
can bridge
between
taking
something
apart
p. 110, Hertzberger, Herman (1998),
Notations of Herman Hertzberger.
Rotterdam: NAi Publishers.
(analysis) and
Adolf Loos: exploded axon (above:
student work, Jonathan Bell)
Rufer and Scheu houses
putting
something
together
(synthesis),
forming a common
language for both.
1
structure
2-dimensional coded
diagramming can clarify
diagrams
--------------------------------------------
organization of the elements of
a design
-----------------------------------------------------------
lower level plan
movement
simplify the subject,
-----------------------------------------------------------
enclosure
representing it selectively in
purposeful ways – selecting
and simplifying are two ways
we ‘abstract’
pp. 13, 73 in Frederick, Matthew (2007), 101 Things I Learned in
Architecture School, Cambridge, MA: MIT Press.
Images: pp. 28-29, Meier, Richard (1984), Richard Meier Architect. New York: Rizzoli.
This perspectival sketch might
be thought of as a diagram
capturing the sense of
movement the architect was
pursuing in the design –
diagrams can express many
things
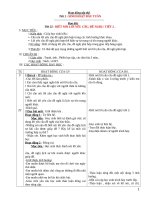
Medieval city figure-ground plan
The terms ‘figure’ and ‘ground’ are sometimes used
in diagramming the relationships between space and form.
Reversing black and white in such a drawing can sometimes be
instructive, helping us re-see relationships between figure and
ground
Einstein Tower by Erich Mendelsohn; view from the west, from
Mendelsohn, E. (1930 / 1992), Erich Mendelsohn, the Complete Works.
New York: Princeton Architectural Press, p. 45, 46.
p. 7 in Frederick, Matthew (2007), 101 Things I Learned in Architecture School, Cambridge, MA: MIT Press.
pp. 4, 6 in Frederick, Matthew (2007),
101 Things I Learned in Architecture
School, Cambridge, MA: MIT Press.
The terms ‘positive’
and
‘negative’ space are
sometimes used in
diagramming the relationships
between space and form.
Reversing black and white in
such a drawing can also help us
understand space and form.
Contemporary suburb figure-ground plan
In the example,
above, a conceptual
drawing of human
hands is translated
into a spatial diagram
of a building and a
conceptual diagram
of building use over
time
Oxnard House by Steven Holl from Holl, S. (1991).
Anchoring. New York: Princeton Architectural Press,
pp. 126-127.
2
analysis can be a
process of selecting and
‘loosening’
elements or ‘chunks’ of
a building. Here program
masses are selected,
‘loosened’ and
‘exploded’ in an
explanatory way
Structural diagram of the plan
diagrams can help
us
deduce the form of
Images: p.20, Fenton, Joseph (1985), Hybrid
Buildings. New York: Princeton Architectural
Press.
Plan to section diagram
many elements
of architecture
deduce
an idea
Plan
pp. 33, 107, 216, 220, Clark, Roger and Pause, Michael (1979),
Analysis of Precedent, Raleigh, NC: NC State University
Plan
/>
Analyses are often developed
through an exploratory process
Moller House by Adolf Loos
plan to section analysis of view, light
and circulation
Bill Hubbard diagram sketch of movement
and enclosure
of sketching
diagrammatically to
identify or clarify ideas – this
method is key
Da Vinci plan diagram
and 3-d sketch
p. 69, Vezzosi, A. (1997), Leonardo da Vinci, the Mind of the Renaissance, New York: Harry Abrams.
p. 184, Cullen, Gordon (1961, 1980), The
Concise Townscape, New York: Van
Nostrand Reinhold.
this sketch
diagrammatically
isolates
specific,
spatial
sectional
conditions,
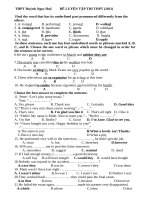
A diagram can make
visible
something that is invisible – in
this case an imaginary geometry
The geometrical information can be overlaid on the
original, in this case a face, or it can be separated out as a
diagram of the geometry of the face that stands alone
leaving out
everything else
p. 183-184, Evans, Robin, (1997), Translations from Drawing to Building and Other
Essays. Cambridge, MA: The MIT Press.
3
Jean-Léon Gérôme. The Duel after the Masquerade. 1857-1859..Lauer, David A.; Pentak, Stephen
(2011-01-01). Design Basics, 8th Edition (Kindle Locations 2377-2379). Cengage Learning. Kindle Edition.
Sol Lewitt. Wall Drawing 51. All architectural points connected by straight lines (detail).
June 1970. Blue snap lines. LeWitt Collection, Chester, Connecticut.Lauer, David A.; Pentak, Stephen (2011-01-01). Design Basics,
8th Edition (Kindle Locations 2399-2400). Cengage Learning. Kindle Edition.
hidden geometries . . .
making
proportional
relationships
visible
/>colnContest&utm_medium=email
/>
Villa LaRoche analytic model (top right: student project, Jonathan Bell)
simplifying circulation
by ‘unfolding’ it, or
p. 59, illustrations from Architettura Civile (1737 ed.) in Perez-Gomez, Alberto and Parcell, Stephen, editors (1999), Chora Three.
Montreal: McGill-Queens University Press.
the intersections of geometric forms made visible
p. 85, Evans, Robin, (1997), Translations from Drawing to
Building and Other Essays. Cambridge, MA: The MIT Press.
comparing plans according
straightening it, in order to
understand sequence more
clearly
to their circulatory simplicity
4
Adolf Loos: Rufer and Scheu Houses, Vienna
Rufer exploded axon (above: student work, Jonathan Bell)
Rufer and Scheu volume study axondiagram (below)
Faỗade diagram (left)
deducing (and explaining) ideas
through analytical diagrams in section,
elevation and exploded axonometric
urban analytical studies develop
a diagrammatic
language to describe the elements of a city
pp. 145-147, Lynch, Kevin (1960/1975), The Image of the City. Cambridge, MA: The MIT Press.
inducing an idea within a field of
plan, section and volume diagrams
induce
an idea
In the inducing of an idea, we
may speculate, play and
dream. Through drawing,
thinking and modeling, we
reflect on the outcomes of
these activities
Because the drawings are so close to one
another they can, in a way, ‘talk’ to one another
p. 110, Hertzberger, Herman (1998), Notations of Herman Hertzberger.
Rotterdam: NAi Publishers.
You can induce ideas through
speculating, asking “what
if” through a process of
diagraming possibilities and
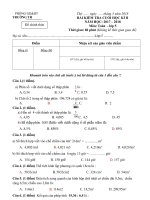
Rokko Housing, plan and section sketch plus aerial view in (1990)Tadao Ando:
Architectural Monographs 14, New York: St. Martin’s Press, pp. 70-71.
then exploring
above, plan and section diagrams,
correlated with one another, help the
and potential of those
possibilities
architect visualize a speculation
that corresponds in its essentials with the
completed project seen at left. This is
similar to what the Ecole de Beaux Arts
called a “parti” – a term we still use
and
reflecting about the value
p. 180, Hertzberger, Herman (1998), Notations of Herman
Hertzberger. Rotterdam: NAi Publishers.
5
a spatial diagram (left) based on
material investigations of a
sponge, used to invent and
synthesize a building’s spaces
p.55, Mitchell, William (2007), Imagining MIT,
Cambridge, MA: MIT Press.
pp. 17, 18, 21, 22, 62 in
(2005), FOBA / Buildings.
New York: Princeton
Architectural Press.
pp. 52, 58 in Holl, Steven (2004), Steven Holl: Simmons Hall.
New York: Princeton Architectural Press.
inducing ideas through
diagrammatic studies in plan,
section, elevation and
perspective
inducing ideas
through iterative
axonometric
diagrams of
architectural form
p. 30, Eisenman, Peter (1987)
PETEREISENMANHOUSESOFCARDS.
New York: Oxford University Press.
Peter Eisenman, House 11a Project
Model of design (above)
Axonometric Diagrams (right)
p. 65, 80, Eisenman, Peter (1999), Diagram Diaries. New York: Universe Publishing.
3-dimensional
coded
diagramming can make volumetric relationships clear
“House VI became a kaleidoscope of
diagrams rather than the result of a
generative sequence.”
Vuoksenniska Church, Imatra
joining
analysis and
synthesis
diagrams, in
their
abstraction
and radical
simplification,
can be used
as a common
language that
joins analysis
and synthesis
Vuoksenniska Church, Imatra
Alvar Aalto joining analytic studies of
sound in space with synthetic studies
of the form of a space
Finlandia Hall, Helsinki
pp. 110-111, Ruusuvuori, Aarno, Pallasmaa, Juhani, editors (1978), Alvar
Aalto: 1898-1976. Helsinki: Museum of Finnish Architecture.
Viipuri City Library
6
Le Corbusier’s analytical diagram
of an Egyptian low relief (above)
Le Corbusier’s synthetic diagram
of a system of humanly based
proportions (below)
p. 189, Francesco di Giorgio Martini studies in PerezGomez, Alberto and Parcell, Stephen, editors (1999),
Chora Three. Montreal: McGill-Queens University Press.
analytical diagrams of the
human figure (above)
become the basis for
synthesizing a plan and an
pp. 193, 67, Le Corbusier (1954,1958 / 1986), The Modular. Cambridge, MA: Harvard University Press.
elevation
photographing, drawing, and modeling, collaged diagrammatically,
join analysis of a barn with synthesis of a house
p. 141, Blackwell, Marlon (2005), An Architecture of the
Ozarks. New York: Princeton Architectural Press.
Zaha Hadid: Cincinnati Contemporary Arts Center
Photo (above)
Model Diagrams (right)
a mix of 3dimensional
analytic / synthetic
diagrams of
circulation and
volume
explaining
an idea:
spatial stories told through
diagramming
synthesizing form through
diagrams applying the analysis
of solar orientation
Le Corbusier’s sun diagrams
diagrammatic
narratives may be of
interest to the
architectural storyteller. The stories may
be spatial, conceptual,
technical, cultural.
They may form
arguments for a point
of view . . .
p. 65, 80, Eisenman, Peter (1999), Diagram
Diaries. New York: Universe Publishing.
explaining a
series of
architectural
steps and
operations
through
volumetric
diagrams
and text
De Rietlanden Sports Hall by Slangen + Koenis Architects Project size: 2.500 sqm
accessed 05 May 2013
p. 651, 689, MVRDV (2005), KM3:
Excursions on Capacities. Rotterdam:
Berlage Institute.
7
Peter Eisenman, Project for Carnegie Mellon Research Institute
Model of design (above)
Diagrammatic model (above right)
Diagrammatic Drawings (below right)
/>pg&Caption=Geometric%20comparative%20diagrams%20of%2020%20buildings%20and%20projects
%20by%20Harry%20Seidler.&Credit=Harry%20Seidler%20%26%20Associates accessed 06 oct 2012
diagrams
(right) that
take apart
the image
(above) to
reveal the
project’s
systems and
subsystems
3-dimensional
diagramming,
modeling, testing
Le Corbusier: 4 Elements
Diagrams (above) analyze
his own work in a story
about his ideas regarding
his notions of important
categories of form.
pp. 45-46, Tschumi, Bernard, edited by Damiani, Giovanni
(2003), Bernard Tschumi, New York: Rizzoli.
Le Corbusier: House Diagrams
explaining ideas through diagrams, text, plan and section
Bolles + Wilson, New Luxor Theatre, Rotterdam, Netherlands
Photograph (above)
Model Diagram of spiral (right)
a conceptual
model can explain a key idea behind a
building’s design
pp. 128-129 (1987), chapel + shelter by Jose Oubrerie with Kirkor Kalaycayian in New York Architects. Cefalu, Italy:
Mediterranea Editrice In Architettura.
8
diagram + text can explain and clarify the
functional requirements for the threshold to a house . . .
pp. 166-167, Chermayeff, Serge and Alexander, Christopher (1963 / 1965), Community and Privacy: Towards a New Architecture
of Humanism. New York: Anchor Books.
9