Tài liệu Forensic Engineering Investigation P2 docx
Bạn đang xem bản rút gọn của tài liệu. Xem và tải ngay bản đầy đủ của tài liệu tại đây (283.39 KB, 20 trang )
neers who may testify on behalf of the other side of the issue. Bystanders
might presume that the spectacle of strong disagreement among practitioners
of such a hard science indicates that one side or the other has been bought
off, is incompetent, or is just outright lying.
While the engineering profession is certainly not immune from the same
dishonesty that plagues other professions and mankind in general, the basis
for disagreement is often not due to corruption or malfeasance. Rather, it is
a highly visible demonstration of the subjective aspects of engineering.
Nowhere else is the subjectivity in engineering so naked as in a courtroom.
To some engineers and lay persons, it is embarrassing to discover, perhaps
for the first time, that engineering does indeed share some of the same
attributes and uncertainties as the soft sciences.
Because of the adversarial role, no attorney will allow another party to
present evidence hurtful to his client’s interests without challenging and probing
its validity. If the conclusions of a forensic engineer witness cause his client to
lose $10 million, it is a sure bet that the attorney will not let those conclusions
stand unchallenged! This point should be well considered by the forensic engi-
neer in all aspects of an investigation. It is unreasonable to expect otherwise.
It is not the duty of the attorney to judge his client; that is the prerogative
of the judge and jury. However, it is the attorney’s duty to be his client’s advocate.
In one sense, the attorney is his client: the attorney is supposed to do for his
client what the client would do for himself had he had the same training and
expertise. When all attorneys in a dispute present their cases as well as possible,
the judge and jury can make the most informed decision possible.
An engineer cannot accept a cut of the winnings or a bonus for a favorable
outcome. He can only be paid for his time and expenses. If it is found that
he has accepted remuneration on some kind of contingency basis, it is
grounds for having his professional engineer’s license suspended or revoked.
The premise of this policy is that if a forensic engineer has a stake in the
outcome of a trial, he cannot be relied upon to give honest answers in court.
Attorneys, on the other hand, can and do accept cases on a contingency
basis. It is not uncommon for an attorney to accept an assignment on the
promise of 30–40% of the take plus expenses if the suit is successful. This is
allowed so that poor people who have meritorious cases can still obtain legal
representation.
However, this situation can create friction between the attorney and the
forensic engineer. First, the attorney may try to delay paying the engineer’s
bill until after the case. This is a version of “when I get paid, you get paid”
and may be a de facto type of contingency fee arrangement. For this reason,
it is best to agree beforehand on a schedule of payments from the attorney
for service rendered. Follow the rule: “would it sound bad in court if the
other side brought it up?”
©2001 CRC Press LLC
Secondly, since the lawyer is the advocate for the case and may have a
financial stake in the outcome, he may pressure the engineer to manufacture
some theory to better position his client. If the engineer caves in to this
temptation, he is actually doing the attorney a disservice.
A forensic engineer does his job best when he informs the attorney of
all aspects of the case he has uncovered. The “other side” may also have the
benefit of an excellent engineer who will certainly point out the “bad stuff”
in court. Thus, if the attorney is not properly informed of the “bad stuff,” he
cannot properly prepare the case for presentation in court.
1.10 Reporting the Results of a Forensic Engineering
Investigation
There are several formats used to report the results of a forensic engineering
investigation. The easiest is a simple narrative, where the engineer simply
describes all his investigative endeavors in chronological order. He starts from
when he received the telephone call from the client, and continues until the
last item in the investigation is complete. The report can be composed daily
or piecewise when something important occurs as the investigation
progresses, like a diary or journal. Insurance adjusters, fire investigators, and
detectives often keep such chronological journals in their case files.
A narrative report works well when the investigation involves only a few
matters and the evidence is straightforward. However, it becomes difficult
for the reader to imagine the reconstruction when a lot of evidence and facts
must be considered, along with test results, eyewitness accounts, and the
application of scientific principles. Often the connections among the various
items are not readily apparent, and the chronology of the investigation often
does not logically develop the chronology of the accident itself.
Alternately, the report could be prepared like an academic paper, replete
with technical jargon, equations, graphs, and reference footnotes. While this
type of report might impress colleagues or the editors of technical journals,
it is usually unsatisfactory for this application. It does not readily convey the
findings and assessment of the investigation to the people who need to read
it to make decisions. They are usually not professional scholars.
To determine what kind of format to use, it is often best to first consider
who will be reading the forensic investigation report. In general, the audience
includes the following.
1. Claims adjuster: The adjuster will use the report to determine whether
a claim should be paid under the terms and conditions of the insurance
policy. If he suspects there is subrogation potential, he will forward
©2001 CRC Press LLC
the report to the company’s attorney for evaluation. In some insurance
companies, such reports are automatically evaluated for subrogation
potential. Subrogation is a type of lawsuit filed by an insurance com-
pany to get back the money they paid out for a claim by suing a third
party that might have something to do with causing the loss. For
example, if a wind storm blows the roof off a house, the insurance
company will pay the claim to the homeowner, but may then sue the
original contractor because the roof was supposed to withstand such
storms without being damaged.
2. Attorneys: This includes attorneys for both the plaintiff and the defen-
dant. The attorneys will scrutinize every line and every word used in
the report. Often, they will inculcate meaning into a word or phrase
that the engineer-author never intended. Sometimes the engineer-
author will unadvisedly use a word in an engineering context that also
has a specific legal meaning. The legal meaning may be different from
the engineering meaning. Lawyers are wordsmiths by trade. Engineers
as a group are renown for being poor writers. This disparity in language
skill often provides the attorneys for either side plenty of sport in
reinterpreting the engineer’s report to mean what they need it to mean.
3. Technical experts: The report will also be read by the various technical
experts working for the attorneys. They will want to know on what
facts and observations the engineer relied, which regulations and stan-
dards he consulted and applied, and what scientific principles or meth-
odologies were used to reach the conclusions about the cause of the
loss or failure. The experts for the other side, of course, will challenge
each and every facet of the report that is detrimental to their client
and will attempt to prove that the report is a worthless sham. Whatever
standard the engineer used in his report will, of course, be shown to
be incorrect, incorrectly applied, or not as good as the one used by the
other side’s technical expert. One common technique that is used to
discredit a report is to segment the report into minute component
parts, none of which, when examined individually, are detrimental to
their side. This technique is designed to disconnect the interrelation-
ships of the various components and destroy the overall meaning and
context. It is akin to examining individual heart cells in a person’s body
to determine if the person is in love.
4. The author: Several years after the report has been turned in to the
client and the matter has been completely forgotten about, the forensic
engineer who originally authored the report may have to deal with it
again. Court cases can routinely take several years for the investigating
engineer to be involved. Thus, several years after the original investi-
gation, the engineer may be called upon to testify in deposition or
©2001 CRC Press LLC
court about his findings, methodologies, and analytical processes.
Since so much has happened in the meantime, the engineer may have
to rely on his own report to recall the particulars of the case and what
he did.
5. Judge and jury: If the matter does end up in trial, the judge will decide
if the report can be admitted into evidence, which means that the jury
will be allowed to read it. Since this is done in a closed jury room, the
report must be understandable and convey the author’s reasoning and
conclusions solely within the four corners of each page. Bear in mind
that the members of an average jury have less than a 12th grade
educational level. Most jurors are uncomfortable with equations and
statistical data. Some jurors may believe there is something valid in
astrology and alien visitations, will be distrustful of intellectual
authorities from out of town, and since high school, their main source
of new scientific knowledge has consisted of television shows and
tabloids.
In order to satisfy the various audiences, the following report format is
often used, which is consistent with the pyramid method of investigation
noted previously. The format is based on the classical style of argument used
in the Roman Senate almost 2000 years ago to present bills. As it did then,
the format successfully conveys information about the case to a varied audi-
ence, who can chose the level of detail they wish to obtain from the report
by reading the appropriate sections.
1. Report identifiers: This includes the title and date of the report, the
names and addresses of the author and client, and any identifying
information such as case number, file number, date of loss, etc. The
identifying information can be easily incorporated into the inside
address section if the report is written as a business letter. Alternately,
the identifying information is sometimes listed on a separate page pre-
ceding the main body of the report. This allows the report to be separate
from other correspondence. A cover letter is then usually attached.
2. Purpose: This is a succinct statement of what the investigator seeks
to accomplish. It is usually a single statement or a very short para-
graph. For example, “to determine the nature and cause of the fire
that damaged the Smith home, 1313 Bluebird Lane, on January 22,
1999.” From this point on, all the parts of the report should directly
relate to this “mission statement.” If any sentence, paragraph, or sec-
tion of the report does not advance the report toward satisfying the
stated purpose, those parts should be edited out. The conclusions at
the end of the report should explicitly answer the question inferred
©2001 CRC Press LLC
in the purpose statement. For example, “the fire at the Smith house
was caused by an electrical short in the kitchen ventilation fan.”
3. Background Information: This part of the report sets the stage for the
rest of the report. It contains general information as to what happened
so that the reader understands what is being discussed. A thumbnail
outline of the basic events and the various parties involved in the matter
are included. It may also contain a brief chronological outline of the
work done by the investigator. It differs from an abstract or summary
in that it contains no analysis, conclusions, or anything persuasive.
4. Findings and Observations: This is a list of all the factual findings
and observations made related to the investigation. No opinions or
analysis is included: “just the facts, ma’m.” However, the arrangement
of the facts is important. A useful technique is to list the more general
observations and findings first, and the more detailed items later on.
As a rule, going from the “big picture” to the details is easier for the
reader to follow than randomly jumping from minute detail to big
picture item and then back to a detail item again. It is sometimes useful
to organize the data into related sections, again, listing generalized data
first, and then more detailed items. Movie directors often use the same
technique to quickly convey detailed information to the viewer. An
overview scene of where the action takes place is first shown, and then
the camera begins to move closer to where things are going on.
5. Analysis: This is the section wherein the investigating engineer gets
to explain how the various facts relate to one another. The facts are
analyzed and their significance is explained to the reader. Highly tech-
nical calculations or extensive data are normally listed in an appendix,
but the salient points are summarized and explained here for the
reader’s consideration.
6. Conclusions: In a few sentences, perhaps even one, the findings are
summarized and the conclusion stated. The conclusion should be stated
clearly, with no equivocation, using the indicative mode. For example,
a conclusion stated like, “the fire could have been caused by the hot
water tank,” is simply a guess, not a conclusion. It suggests that it also
could have been caused by something other than the hot water tank.
Anyone can make a guess. Professional forensic engineers offer conclu-
sions. As noted before, the conclusions should answer the inferred
question posed in the purpose section of the report. If the report has
been written cohesively up to this point, the conclusion should be
already obvious to the reader because it should rest securely on the
pyramid of facts, observations, and analysis already firmly established.
7. Remarks: This is a cleanup, administrative section that sometimes is
required to take care of case details, e.g., “the evidence has been moved
©2001 CRC Press LLC
and is now being stored at the Acme garage,” or, “it is advisable to put
guards on that machine before any more poodles are sucked in.”
Sometimes during the course of the investigation, insight is developed
into related matters that may affect safety and general welfare. In the
nuclear industry, the term used to describe this is “extent of condition.”
Most states require a licensed engineer to promptly warn the appro-
priate officials and persons of conditions adverse to safety and general
welfare to prevent loss of life, loss of property, or environmental dam-
age. This is usually required even if the discovery is detrimental to his
own client.
8. Appendix: If there are detailed calculations or extensive data relevant
to the report, they go here. The results of the calculations or analysis
of data is described and summarized in the analysis section of the
report. By putting the calculations and data here, the general reading
flow of the report is not disrupted for those readers who cannot follow
the detailed calculations, or are simply not interested in them. And,
for those who wish to plunge into the details, they are readily available
for examination.
9. Attachments: This is the place to put photographs and photograph
descriptions, excerpts of regulations and codes, lab reports, and other
related items that are too big or inconvenient to directly insert into
the body of the report, but are nonetheless relevant. Often, in the
findings and observations portion of the report, reference is made to
“photograph 1” or “diagram 2B, which is included in the attachments.”
In many states, a report detailing the findings and conclusions of a
forensic engineering investigation are required to be signed and sealed by a
licensed professional engineer. This is because by state law, engineering inves-
tigations are the sole prerogative of licensed, professional engineers. Thus,
on the last page in the main body of the report, usually just after the con-
clusions section, the report is often signed, dated, and sealed by the respon-
sible licensed professional engineer(s) who performed the investigation.
Often, the other technical professionals who worked under the direction of
the responsible professional engineer(s) are also listed, if they have not been
noted previously in the report.
Some consulting companies purport to provide investigative technical
services, investigative consulting services, or scientific consulting services.
Their reports may be signed by persons with various initials or titles after
their names. These designations have varying degrees of legal status or legit-
imacy vis-à-vis engineering investigations depending upon the particular
state or jurisdiction. Thus, it is important to know the professional status of
the person who signs the report. A forensic engineering report signed by a
©2001 CRC Press LLC
person without the requisite professional or legally required credentials in the
particular jurisdiction may lack credibility and perhaps even legal legitimacy.
In cases where the report is long and complex, an executive summary
may be added to the front of the report as well as perhaps a table of contents.
The executive summary, which is generally a few paragraphs and no more
than a page, notes the highlights of the investigation, including the conclu-
sions. A table of contents indicates the organization of the report and allows
the reader to rapidly find sections and items he wishes to review.
Further Information and References
“Chemist in the Courtroom,” by Robert Athey, Jr., American Scientist, 87(5), Sep-
tember-October 1999, pp. 390–391, Sigma Xi. For more detailed information
please see Further Information and References in the back of the book.
The Columbia History of the World, Garraty and Gay, Eds., Harper and Row, New
York, 1981. For more detailed information please see Further Information and
References in the back of the book.
“Daubert and Kumho,” by Henry Petroski, American Scientist, 87(5), September-
October 1999, pp. 402–406, Sigma Xi. For more detailed information please see
Further Information and References in the back of the book.
The Engineering Handbook, Richard Dorf, Ed., CRC Press, Boca Raton, FL, 1995. For
more detailed information please see Further Information and References in the
back of the book.
Forensic Engineering, Kenneth Carper, Ed., Elsevier, New York, 1989. For more
detailed information please see Further Information and References in the back
of the book.
Galileo’s Revenge, by Peter Huber, Basic Books, New York, 1991. For more detailed
information please see Further Information and References in the back of the
book.
General Chemistry, by Linus Pauling, Dover Publications, New York, 1970. For more
detailed information please see Further Information and References in the back
of the book.
Introduction to Mathematical Statistics, by Paul Hoel, John Wiley & Sons, New York,
1971. For more detailed information please see Further Information and Refer-
ences in the back of the book.
On Man in the Universe, Introduction by Louside Loomis, Walter Black, Inc., Roslyn,
NY, 1943. For more detailed information please see Further Information and
References in the back of the book.
Procedures for Performing a Failure Mode, Effects and Criticality Analysis (FMECA),
MIL-STD-1629A, November 24, 1980. For more detailed information please see
Further Information and References in the back of the book.
©2001 CRC Press LLC
Reporting Technical Information, by Houp and Pearsall, Glencoe Press, Beverly Hills,
California, 1968. For more detailed information please see Further Information
and References in the back of the book.
Reason and Responsibility, Joel Feinburg, Ed., Dickenson Publishing, Encino, CA,
1971. For more detailed information please see Further Information and Refer-
ences in the back of the book.
To Engineer is Human, by Henry Petroski, Vintage Books, 1992. For more detailed
information please see Further Information and References in the back of the
book.
“Trial and Error,” by Saunders and Genser, The Sciences, September/October 1999,
39(5), 18–23, the New York Academy of Sciences. For more detailed information
please see Further Information and References in the back of the book.
“When is Seeing Believing?” by William Mitchell, Scientific American, Feb. 1994,
270(2), pp. 68–75. For more detailed information please see Further Information
and References in the back of the book.
©2001 CRC Press LLC
Wind Damage to
Residential Structures
You know how to whistle don’t you? Just put your lips together and blow.
— Lauren Bacall to Humphrey Bogart, in To Have and Have Not
Warner Bros. Pictures, 1945
2.1 Code Requirements for Wind Resistance
Most nationally recognized U.S. building codes, such as the Unified Building
Code (UBC) and the Building Officials and Code Administrators (BOCA)
code require that buildings be able to withstand certain minimum wind
speeds without damage occurring to the roof or structure. In the Midwest,
around Kansas City for example, the minimum wind speed threshold
required by most codes is 80 mph. For comparison, hurricane level winds
are considered to begin at 75 mph.
According to the National Oceanic and Atmospheric Administration
(NOAA) weather records, the record wind speed to date measured at the
weather recording station at Kansas City International Airport is 75 mph.
This occurred in July 1992. Considering together the Kansas City building
code requirements and the Kansas City weather records, it would appear that
if a building is properly “built to code” in the Kansas City area, it should
endure all winds except record-breaking winds, or winds associated with a
direct hit by a tornado.
Unfortunately, many buildings do not comply with building code stan-
dards for wind resistance. Some communities have not legally adopted formal
building codes, and therefore have no minimum wind resistance standard.
This allows contractors, more or less, to do as they please with respect to
wind resistance design. This is especially true in single-family residential
structures because most states do not require that they be designed by
licensed architects or engineers. Essentially, anyone can design and build a
house. Further, in some states, anyone can be a contractor.
It is also likely that many older buildings in a community were con-
structed well before the current building code was adopted. The fact that
they have survived this long suggests that they have withstood at least some
2
©2001 CRC Press LLC
severe wind conditions in the past. Their weaker contemporaries have per-
haps already been thinned out by previous storms. Most codes allow build-
ings that were constructed before the current code was adopted and that
appear to be safe to be “grandfathered.” In essence, if the building adheres
to construction practices that were in good standing at the time it was built,
the code does not require it to be rebuilt to meet the new code’s requirements.
Of course, while some buildings are in areas where there is indeed a
legally adopted code, the code may not be enforced due to a number of
reasons, including graft, inspector malfeasance, poorly trained inspectors, or
a lack of enforcement resources. Due to poor training, not all contractors
know how to properly comply with a building code. Sometimes, contractors
who know how to comply, simply ignore the code requirements to save
money. In the latter case, Hurricane Andrew is a prime example of what
occurs when some contractors ignore or subvert the wind standards con-
tained in the code.
Hurricane Andrew struck the Florida coast in August 1992. Damages in
south Florida alone were estimated at $20.6 billion in 1992 dollars, with an
estimated $7.3 billion in private insurance claims. This made it the most
costly U.S. hurricane to date. Several insurance companies in Florida went
bankrupt because of this, and several simply pulled out of the state altogether.
Notably, this record level of insurance damage claims occurred despite the
fact that Andrew was a less powerful storm than Hugo, which struck the
Carolinas in September 1989.
Plate 2.1
Severe wind damage to structure.
©2001 CRC Press LLC
Andrew caused widespread damage to residential and light commercial
structures in Florida, even in areas that had experienced measurable wind
speeds less than the minimum threshold required by local codes. This is
notable because Florida building codes are some of the strictest in the U.S.
concerning wind resistance. Additionally, Florida is one of the few states that
also requires contractors to pass an examination to certify the fact that they
are familiar with the building code. Despite all these paper qualifications,
however, in examining the debris of buildings that were damaged, it was
found that noncompliance with the code contributed greatly to the severity
and extent of wind damage insurance claims.
The plains and prairie regions west of Kansas City are famous for wind,
even to the point of having a “tall tale” written about it, the Legend of
Windwagon Smith. According to the story, Windwagon Smith was a sailor
turned pioneer who attached a ship’s sail to a Conestoga wagon. Instead of
oxen, he harnessed the wind to roam the Great Plains, navigating his wind-
driven wagon like a sloop.
An old squatters’ yarn about how windy it is in Western Kansas says that
wind speed is measured by tying a log chain to a fence post. If the log chain
is blowing straight out, it’s just an average day. If the links snap off, its a
windy day. In fact, even the state’s name, “Kansas,” is a Sioux word that means
people of the south wind.
According to a publication from Sandia Laboratories (see references),
Kansas ranks third in windy states for overall wind power, 176.6 watts per
Plate 2.2 Relatively moderate wind caused collapse of tank during construction
due to insufficient bracing.
©2001 CRC Press LLC
square meter. The other most windy states with respect to overall wind power
are North Dakota (1), Nebraska (2), South Dakota (4), Oklahoma (5), and
Iowa (6). Because of Kansas’ windy reputation, it is hard to imagine any
contractor based in Kansas, or any of the other windy Midwestern or sea-
board states for that matter, who is not aware of the wind and its effects on
structures, windows, roofs, or unbraced works in progress.
2.2Some Basics about Wind
Air has two types of energy, potential and kinetic. The potential energy
associated with air comes from its pressure, which at sea level is about 14.7
pounds per square inch or 1013.3 millibars. At sea level, the air is squashed
down by all the weight of the air that lies above it, sort of like the guy at the
bottom of a football pile-up. Like a compressed spring, compressed air stores
energy that can be released later.
The kinetic energy associated with air comes from its motion. When air
is still, it has no kinetic energy. When it is in motion, it has kinetic energy
that is proportional to its mass and the square of its velocity. When the
velocity of air is doubled, the kinetic energy is quadrupled. This is why an
80-mph wind packs four times the punch of a 40-mph wind.
The relationship between the potential and kinetic energies of air was
first formalized by Daniel Bernoulli, in what is now called Bernoulli’s equa-
tion. In essence, Bernoulli’s equation states that because the total amount of
energy remains the same, when air speeds up and increases its kinetic energy,
it does so at the expense of its potential energy. Thus, when air moves, its
pressure decreases. The faster it moves, the lower its pressure becomes. Like-
wise, when air slows down, its pressure increases. When it is dead still, its
pressure is greatest.
The equation developed by Daniel Bernoulli that describes this “sloshing”
of energy between kinetic and potential when air is flowing more or less
horizontally is given in Equation (i), which follows.
total energy = potential + kinetic
[P
atmos
/!] = [P/ !] + v
2
/2g
c
(i)
where P
atmos
= local pressure of air when still, ! = density of air, about 0.076
lbf/ft
3
, P = pressure of air in motion, v = velocity of air in motion, and g
c
=
gravitational constant for units conversion, 32.17 ft/(lbf-sec
2
).
It should be noted that Equation (i), assumes that gas compressibility
effects are negligible, which considerably simplifies the mathematics. For
wind speeds associated with storms near the surface of the earth and where
©2001 CRC Press LLC
air pressure changes are relatively small, the incompressibility assumption
implicit in Equation (i) is reasonable and introduces no significant error.
Wading through the algebra and the English engineering units conver-
sions, it is seen that a 30-mph wind has a kinetic energy of 30 lbf-ft. Since
the total potential energy of still air at 14.7 lbf/in
2
is 27,852 lbf-ft, then the
reduction in air pressure when air has a velocity of 30 mph is 0.0158 lbf/in
2
or 2.27 lbf/ft
2
. Similarly at 60 mph, the reduction in air pressure is 0.0635
lbf/in
2
or 9.15 lbf/ft
2
.
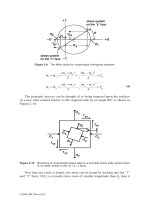
What these figures mean becomes more clear when a simplified situation
is considered. Figure 2.1, shows the side view of a house with wind blowing
over it. As the wind approaches the house, several things occur.
First, some of the wind impinges directly against the vertical side wall of
the house and comes more or less to a stop. The change in momentum
associated with air coming to a complete stop against a vertical wall results
in a pressure being exerted on the wall. The basic flow momentum equation
that describes this situation is given below.
P = k !(v
2
) (ii)
where P = average pressure on vertical wall, k = units conversion factor, ! =
mass density of air, about 0.0023 slugs/ft
3
, and v = velocity of air in motion.
Working through the English engineering units, Equation (ii) reduces to
the following.
P = (0.00233)v
2
(iii)
where P = pressure in lbf/square feet, v = wind velocity in ft/sec.
Figure 2.1Side view of wind going over house.
wind streamlines
stagnant air
stagnant air against house
©2001 CRC Press LLC
By solving Equation (iii) for a number of wind speeds, Table 2.1 is
generated. The table shows the relationship between a wind impinging per-
pendicularly on a flat surface and coming to a complete stop, and the resulting
average pressure on that surface.
In practice, the pressure numbers generated by Equation (iii) and listed
in Table 2.1 are higher than that actually encountered. This is because the
wind does not fully impact the wall and then bounce off at a negligible speed,
as was assumed. What actually occurs is that a portion of the wind “parts”
or diverts from the flow and smoothly flows over and away from the wall
without actually slamming into it, as is depicted in Figure 2.1. Therefore, to
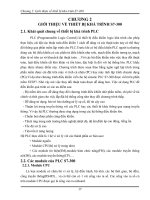
be more accurate, Equation (ii) can be modified as follows.
P = k
!(v
1
2
– v
2
2
) or = C !(v
1
2
)(iv)
where P = average pressure on vertical wall, k = units conversion factor, ! =
density of air, about 0.0023 slugs/ft
3
, v
1
= average velocity of air flow as it
approaches wall, v
2
= average velocity of air flow as it departs wall, and C =
overall factor which accounts for the velocity of the departing flow and the
fraction of the flow that diverts.
In general, the actual average pressure on a vertical wall when the wind
is steady is about 60–70% of that generated by Equation (iii) or listed in
Table 2.1. However, in consideration of the momentary pressure increases
caused by gusting and other factors, using the figures generated by Equation
(iii) is conservative and similar to those used in actual design.
This is because most codes introduce a multiplier factor in the wall
pressure calculations to account for pressure increases due to gusting, build-
Table 2.1Perpendicular Wind Speed
Versus Average Pressure on Surface
Wind Speed
ft/sec
Resulting Pressure
lbf/sq ft
10 0.23
20 0.93
30 2.10
40 3.73
50 5.83
60 8.39
70 11.4
80 14.9
90 18.9
100 23.3
120 33.6
150 52.4
©2001 CRC Press LLC
ing geometry, and aerodynamic drag. Often, the end result of using this
multiplier is a vertical wall design pressure criteria similar, if not the same,
as that generated by Equation (iii). In a sense, the very simplified model
equation ends up producing nearly the same results as that of the complicated
model equation, with all the individual components factored in. This is,
perhaps, an example of the fuzzy central limit theorem of statistics at work.
Getting back to the second thing that wind does when it approaches a
house, some of the wind flows up and over the house and gains speed as it
becomes constricted between the rising roof and the air flowing straight over
the house along an undiverted streamline. Again, assuming that the air is
relatively incompressible in this range, as the cross-sectional area through
which the air flows decrease, the air speed must increase proportionally in
order to keep the mass flow rate the same, as per Equation (v).
"m/ "t = !Av (v)
where "m/ "t = mass flow rate per unit time, A = area perpendicular to flow
through which the air is moving (an imaginary “window,” if you please), !
= average density of air, and v = velocity of air.
Constriction of air flow over the house is often greatest at the roof ridge.
Because of the increase in flow speed as the wind goes over the top of the
roof, the air pressure drops in accordance with Bernoulli’s equation, Equation
(i). Where the air speed is greatest, the pressure drop is greatest.
Thirdly, air also flows around the house, in a fashion similar to the way
the air flows over the house.
Lastly, on the leeward side of the house, there is a stagnant air pocket
next to the house where there is no significant air flow at all. Sometimes this
is called the wind shadow. A low pressure zone occurs next to this leeward
air pocket because of the Bernoulli effect of the moving air going over and
around the house.
A similar effect occurs when a person is smoking in a closed car, and
then opens the window just a crack. The air inside the car is not moving
much, so it is at high pressure. However, the fast moving air flowing across
the slightly opened window is at a lower pressure. This difference in relative
pressures causes air to flow from the higher pressure area inside the car to
the low pressure area outside the car. The result is that smoke from the
cigarette flows toward and exits the slightly opened window.
If a wind is blowing at 30 mph and impinges against the vertical side
wall of a house like that shown in Figure 2.1, from the simplified momentum
flow considerations noted in Equation (iii), an average pressure of 4.5 lbf/ft
2
will be exerted on the windward side vertical wall.
©2001 CRC Press LLC
If the same 30-mph wind increases in speed to 40 mph as it goes over
the roof, which is typical, the air pressure is reduced by 4.0 lbf/ft
2
. Because
the air under the roof deck and even under the shingles is not moving, the
air pressure under those items is the same as that of still air, 14.7 lbf/in
2
or
2116.8 lbf/ft
2
. The air pressure under the roof and under the shingles then
pushes upward against the slightly lower air pressure of the moving air going
over the roof. This pressure difference causes the same kind of lift that occurs
in an airplane wing. This lifting force tries to lift up the roof itself, and also
the individual shingles.
While 4.0 lbf/ft
2
of lift may not seem like much, averaged over a roof
area of perhaps 25 × 50 ft, this amounts to a total force of 5000 lbf trying to
lift the roof. At a wind speed of 80 mph, the usual threshold for code com-
pliance in the Midwest, the pressure difference is 16 lbf/ft
2
and the total lifting
force for the same roof is 20,000 lbf.
If the roof in question does not weigh at least 20,000 lbf, or is not held
down such that the combined total weight and holding force exceed 20,000
lbf in upward resistance, the roof will lift. This is why in Florida, where the
code threshold is 90 mph, extra hurricane brackets are required to hold down
the roof. The usual weight of the roof along with typical nailed connections
is not usually enough to withstand the lift generated by 90 mph winds.
It is notable that the total force trying to push the side wall inward, as
in our example, is usually less than the total lift force on the roof and the
shingles. This is a consequence of the fact that the area of the roof is usually
significantly larger than the area of the windward side wall (total force = ave.
pressure
× area). Additionally, a side wall will usually offer more structural
resistance to inward pressure than a roof will provide against lift. For these
reasons, it is typical that in high winds a roof will lift off a house before a
side wall will cave in.
Lift is also the reason why shingles on a house usually come off before
any structural wind damages occur. Individual asphalt shingles, for example,
are much easier to pull up than roof decking nailed to trusses. Shingles tend
to lift first at roof corners, ridges, valleys, and edges. This is because wind
speeds are higher in locations where there is a sharp change in slope. Even
if the workmanship related to shingle installation is consistent, shingles will
lift in some places but not in others due to the variations in wind speed
over them.
Most good quality windows will not break until a pressure difference of
about 0.5 lbf/sq in, or 72 lbf/sq ft occurs. However, poorly fitted, single pane
glass may break at pressures as low as 0.1 lbf/sq in, or about 14 lbf/sq ft. This
means that loosely fitted single pane glass will not normally break out until
wind gusts are at least over 53 mph, and most glass windows will not break
out until the minimum wind design speed is exceeded.
©2001 CRC Press LLC
Assuming the wind approaches the house from the side, as depicted in
Figure 2.1, as the wind goes around the house, the wind will speed up at the
corners. Because of the sharpness of the corners with respect to the wind
flow, the prevalent 30-mph wind may speed up to 40 mph or perhaps even
50 mph at the corners, and then slow down as it flows away from the corners
and toward the middle of the wall. It may then speed up again in the same
manner as it approaches the rear corner of the house.
Because of this effect, where wind blows parallel across the vertical side
walls of a house, the pressure just behind the lead corner will decrease. As
the wind flows from this corner across the wall, the pressure will increase
again as the distance from the corner increases. However, the pressure will
then drop again as the wind approaches the next corner and speeds up. This
speed-up–slow-down–speed-up effect due to house geometry causes a vari-
ation in pressure, both on the roof and on the side walls.
These effects can actually be seen when there is small-sized snow in the
air when a strong wind is blowing. The snow will be driven more or less
horizontal in the areas where wind speed is high, but will roil, swirl, and
appear cloud-like in the areas where the wind speed significantly slows down.
Snow will generally drift and pile up in the zones around the house where
the air speed significantly slows down, that is, the stagnation areas. The air
speed in those areas is not sufficient to keep the snow flakes suspended.
During a blizzard when there is not much else to do anyway, a person can
at least entertain himself by watching snow blow around a neighbor’s house
and mapping out the high and low air flow speed areas.
Plate 2.3 Roof over boat docks loaded with ice and snow, collapsed in moderate
wind.
©2001 CRC Press LLC
Because a blowing wind is not steady, the distribution of low pressure
and high pressure areas on the roof and side walls can shift position and vary
from moment to moment. As a consequence of this, a house will typically
shake and vibrate in a high wind. The effect is similar to that observed when
a flag flaps in the wind, or the flutter that occurs in airplane wings. It is the
flutter or vibration caused by unsteady wind that usually causes poorly fitted
windows to break out.
Because of all the foregoing reasons, when wind damages a residential
or light commercial structure, the order of damage is usually as follows:
1. lifting of shingles.
2. damage to single pane, loose-fitting glass windows.
3. lifting of awnings and roof deck.
4. damage to side walls.
Depending upon the installation quality of the contractor, of course,
sometimes items 1 and 2 will reverse.
Unless there are special circumstances, the wind does not cause structural
damage to a house without first having caused extensive damage to the
shingles, windows, or roof. In other words, the small stuff gets damaged
before the stronger stuff gets damaged. There is an order in the way wind
causes damage to a structure. When damages are claimed that appear to not
follow such a logical order, it is well worth investigating why.
2.3 Variation of Wind Speed with Height
Wind blows slower near the surface of the ground than it does higher up.
This is because the wind is slowed down by friction with the ground and
other features attached to the ground, like trees, bushes, dunes, tall grass,
and buildings. Because of this, wind speeds measured at, say 50 feet from
the ground, are usually higher than wind speeds measured at only 20 feet
from the ground. In fact, the wind speed measured at 50 feet will usually be
14% higher than the speed at 20 feet, assuming clear, level ground, and even
wind flow. As a general rule, the wind speed over clear ground will vary with
1/7th the power of the height from the ground. This is called the “1/7th power
rule.”
v = k[h]
1/7
(vi)
where v = wind speed measurement, h = height from ground, and k = units
conversion and proportionality constant.
©2001 CRC Press LLC
For this reason, when wind data from a local weather station is being
compared to a specific site, it is well to note that most standard wind mea-
surements are made at a height of 10 meters or 32.8 feet. If, for example, it
is necessary to know what the wind speed was at a height of 15 feet, then by
applying the 1/7th power rule, it is found that the wind speed at 15 feet would
have been about 11% less than that measured at 32.8 feet, all other things
being the same.
If a wind speed is measured to be 81 mph at a standard weather reporting
station, that does not automatically mean that a nearby building was also
subject to winds that exceeded the code threshold. If the building was only 10
feet high, then the wind at that height would likely have been about 16% less
or 68 mph, which is well below the code threshold. If there were also nearby
windbreaks or other wind-obstructing barriers, it could have been even less.
Local geography can significantly influence wind speed. Some geographic
features, such as long gradual inclines, can speed up the wind. This is why
wind turbines are usually sited at the crests of hills that have long inclines
on the windward side. The arrangement of buildings in a downtown area
can also increase or decrease wind speed at various locations by either block-
ing the wind or funneling it. Thus, the wind speed recorded at a weather
station does not automatically mean that it was the same at another location,
even if the two sites are relatively close. The relative elevations, the placement
of wind obstructing or funneling structures, and the local geography have to
be considered.
2.4 Estimating Wind Speed from Localized Damages
One of the problems in dealing with wind damages is the estimation of wind
speed when the subject building is located far from a weather reporting
station, or is in an area that obviously experienced wind conditions different
from that of the nearest weather station. In such cases, wind speed can
actually be estimated from nearby collateral damage by the application of
the Beaufort wind scale.
The Beaufort wind scale is a recognized system introduced in 1806 by
Admiral Beaufort to estimate wind speed from its effects. Originally it was
used to estimate wind speeds at sea. The methodology, however, has been
extended to estimating wind speeds over land as well. The Beaufort wind
scale is divided into 12 levels, where each level corresponds to a range of
wind speeds and their observable effects. A brief version of the currently
accepted Beaufort wind scale is provided below.
In reviewing the Beaufort scale, it is notable that tree damage begins to
occur at level 8 and uprooting begins at level 10. However, most building
©2001 CRC Press LLC
codes require a residential structure and roof to withstand wind levels up to
12. This means that the mere presence of wind damage in nearby trees does
not automatically indicate that there should be structural or roof wind dam-
age to a building located near the trees. Because kinetic energy increases with
the square of velocity, a level 9 wind has only about half the “punch” of a
level 12 wind.
2.5 Additional Remarks
Most of the major building codes do not simply use a single wind speed of
80 mph for design purposes. Within the codes there are usually multipliers
that account for many factors, including the height and shape of the building,
gusting, and the building class. For example, in the UBC a factor of 1.15 is
to be applied to the pressure exerted by the wind when “important” buildings
are being designed, such as schools, hospitals, and government buildings.
Generally, most codes require that public buildings, such as schools and
hospitals, be built stronger than other buildings, in the hope that they will
survive storms and calamities when others will not. Thus, when this factor
is figured in and the calculations are backtracked, it is found that the actual
wind speed being presumed is much greater than the design base speed of
80 mph, or whatever the speed.
Table 2.2 Beaufort Wind Scale
Scale Value Wind Range Effects Noted
0, calm 0–1 mph Smoke rises vertically, smooth water, no perceptible
movement
1, light air 1–3 mph Smoke shows the direction of the wind, barely moves
leaves
2, light breeze 4–7 mph Wind is felt on the face, rustles trees, small twigs move
3, gentle breeze 8–12 mph Wind extends a light flag, leaves, and small twigs in
motion
4, moderate breeze 13–18 mph Loose paper blows around, whitecaps appear, moves
small branches
5, fresh breeze 19–24 mph Small trees sway, whitecaps form on inland water
6, strong breeze 25–31 mph Telephone wires whistle, large branches in motion
7, moderate gale 32–38 mph Large trees sway
8, fresh gale 39–46 mph Twigs break from trees, difficult to walk
9, strong gale 47–54 mph Branches break from trees, litters ground with broken
branches
10, whole gale 55–63 mph Trees are uprooted
11, storm 64–75 mph Widespread damage
12, hurricane 75 mph + Structural damage occurs
©2001 CRC Press LLC