Tài liệu Mobile Wireless and Sensor Networks P2 docx
Bạn đang xem bản rút gọn của tài liệu. Xem và tải ngay bản đầy đủ của tài liệu tại đây (132.45 KB, 10 trang )
to develop an algorithm to predict the next AP that a user will visit; this was capable
of predicting the correct AP 87% of the time over the trace.
Schwab and Bunt measured the WLAN at the University of Saskatchewan in
2003 [20]. They used a network sniffer and Cisco LEAP authentication logs to trace
18 APs over a one-week period. Unlike most other measurement studies, this study
did not use the tcpdump sniffer, but an alternative program called EtherPeek [7].
The Saskatchewan study examined user behavior, mobility, and traffic. This is a
nonresidential WLAN, and so again the diurnal patterns mirrored the workday. Web
traffic accounted for 30% of the traffic, but there was little ssh or telnet usage,
which may be due to most WLAN users being law students, as opposed to computer
scientists. Users were nonmobile, and the APs in the law school saw significantly
more use than did other APs. This led the authors to conclude that APs should be
deployed with a view to providing network access in a specific location, rather than
providing ubiquitous mobile access.
McNett and Voelker [16] used a client-side tool to measure mobility on the
University of California San Diego WLAN. A tool was installed on 272 PDAs,
which were equipped with a 802.11b CompactFlash adapter. The tool periodically
recorded the client’s signal strength for each visible AP, the AP at which the client
was associated, the device type, and whether the PDA was using AC or battery
power. As the PDAs lacked large storage capabilities, the PDAs would contact a
central server to upload collected data.
This PDA study looked at user session behavior and mobility. There were regular
diurnal patterns, and less usage at the weekends. Usage was bursty, which may be
due to the difficulty of using a PDA for long periods of time. Interestingly, there was
a steady decline in the number of user s over the trace period. This may be due to the
user population (students) becoming bored with the devices. They defined two types
of session: (1) the AP session, the amount of time that a given PDA spends asso-
ciated with an AP, and (2) the user session, the contiguo us time period in which a
PDA is switched on and connected to the WLAN. AP sessions were significantly
shorter than user sessions, indicating that roaming was taking place while the PDA
is in use. Despite the difficulty of using a PDA, there were some long sessions, with
20% of user sessions over 41 min long. Over the course of the trace, 50% of the
users visited more than 21 APs. As in the Saskatchewan study, AP load was uneven,
and 50% of the APs only saw 5 users or less, and 10% of the APs saw 84 users or
more. The mobility traces were used to develop a campus waypoint mobility model,
which incorporated knowledge of specific geographic locations on campus. Com-
paring the trace-based mobility model to traditional synthetic mobility models indi-
cated three significant differences. In the trace-based model (1) only a small number
of users (11%) were actually mobile at any given time, compared to most nodes in a
synthetic model; (2) users were walking at lower speeds (1 m/s) than synthetic mod-
els (0–20 m/s); and (3) users appeared and disappeared from the network, which is
not considered in most synthetic models.
At Dartmouth College, we have conducted the largest studies of an academic
WLAN. We have collected syslog messages from most of the APs on campus since
their installation in 2001. We have also used SNMP and tcpdump wired sniffers for
18 MEASURING WIRELESS LANs
two extensive studies covering 476 APs for 11 weeks in 2001/02 [13] and 566 APs
for 17 weeks in 2003/04 [9].
In our 2001/02 study we examined user behavior and traffic patterns. The
Dartmouth campus differs from those in other studies as it covers a wide range
of locations: academic areas, sporting grounds including a ski slope, residential
dormitories and houses, communal eating and social areas, and parts of the town
in which the college is based, including some shopping areas, a hotel, and restau-
rants. In terms of the amount of traffic, the residential areas dominated all other
areas. The diurnal usage patterns observed elsewhere were also present at
Dartmouth, although the residential nature of the campus meant that usage did
not stop at the end of the workday, with many students using the WLAN late at
night. User sessions were short, with a median of 16.6 minutes, and 71% of sessions
were shorter than one hour. As in other studies, WWW traffic was the most popular
application, although some clients also used backup progr ams over the WLAN,
which contributed to a large proportion of the overall traffic.
In our 2003/04 study, we chose to examine changes in user behavior on the
WLAN. After 3 years of deployment, the WLAN could be considered a mature net-
work, and an integral part of college life. The college had also begun to replace the
analog telephone system with a Voice over IP (VoIP) telephone system, and some
students were issued with VoIP clients, which could be used over the WLAN. We
found that the types of application used on the WLAN changed dramatically
between 2001/02 and 2003/04; while HTTP was still the most popular application
in terms of the amount of traffic, peer-to-peer file sharing and streaming media saw
significant increases in usage. Wireless VoIP did not appear to be a popular appli-
cation, with most VoIP calls being made on the wired network. As a result of the
increase in file-sharing, local (on-campus) traffic exceeded off-campus traffic, a
reversal of the 2001/02 situation. Residences still continued to generate the most
traffic, and usage remained diurnal, between our two studies.
Our 2003/04 study also examined mobility. The syslog data indicated that many
users ‘‘ping-ponged’’ between APs in range, and so when examining the mobility of
a session, we considered the session diameter, that is, the maximum distance
between any two APs visited in a session. Sessions with a diameter below 50 m
were considered to be nonmobile, as they were assumed to consist of ping-ponging
clients. From the tcpdump logs, we used a tool for analy zing TCP flows to estimate
the operating system being used by a device (by looking for differences in window
sizes, ACK values and so on). We used this information to classify the device by
type: Mac or Windows laptop, VoIP phone, PDA, and so forth. This information
was used to characterize mobility among different device types. Devices such as
VoIP phones, which are always switched on, were found to visit significantly higher
numbers of APs and have longer session durations than laptops, which are typically
powered down before a user moves between locations. Overall, users were found to
be nonmobile, with 50% of users spending 98% of their time in a home location,
that is, a group of one or more APs within a 50 m
2
area with which a user is most
often associated. In separate work, we have also used the association and disasso-
ciation times in our 3 years of syslog traces to create a mobility history for each
MEASUREMENT STUDIES 19
user, which were then used to develop and evaluate mobility prediction models [21].
For user histories containing less than 1000 movements, most predictors performed
badly. For histories longer than this, however, the best predictors had accuracies of
around 65–72% for the median user; that is, they were able to correctly predict the
next AP with which a user would associate 65–72% of the time. Interestingly, sim-
ple Markov-based predictors performed just as well as more complex compressio n-
based predictors. In particular, an order 2 Markov predictor, with a ‘‘fallback’’ to a
shorter order 1 predictor when encountering a new context not seen in the user’s
history, performed the best overall.
1.3.2 Nonacademic WLANs
One of the few WLAN measurement studies to take place outside an academic
campus setting was conducted at a corporate research facility by Balazinska and
Castro in 2002 [4]. They used one method, SNMP with a polling interval of
5 min, to query 117 APs over 4 weeks.
This corporate study concentrated on AP loads and user mobility. As seen in
other studies, some APs were little used, with 10% of the APs seeing less than
10 simultaneous users. The most highly utilized APs in terms of the number of
simultaneous users were in communal locations such as cafeterias and auditoriums.
In terms of traffic levels, however, the most highly utilized APs were in laboratories
and conference rooms.
Users were found to be predominantly nonmobile, with 50% of the users visiting
less than three APs in a given day. Two metrics were introduced to characterize
mobility: prevalence, the amount of time that a user spends at a given AP over
the course of a user’s trace; and persistence which measures the amount of time
that a user stays associated with a given AP before moving to the next AP. Using
the prevalence data, users were categorized by varying degrees of mobility, from
‘‘stationary’’ to ‘‘highly mobile.’’ Stationary users had a high maximum prevalence,
as they spent most of their time associated to a single AP, while highly mobile users
had low maximum and median prevalences, spending their time at different APs.
The persistence metric complements prevalence by accou nting for the amount of
time spent at each AP, and unsurprisingly, persistence was lower at guest locations.
Also outside the academic setting, Balachandran et al. [3] used SNMP and snif-
fers to analyze 195 wireless users at the 2001 ACM SIGCOMM conference. They
chose a polling interval of one minute. Such a short polling interval was possible
because of the small number of APs involved in the study—there were only four
APs used at the conference.
This study examined user behavior, traffic patterns, and AP loads. Given the con-
ference setting, usage closely followed the conference schedule, and the number of
users rose when sessions were taking place, and fell during meals and breaks. Arri-
val times were modeled using a Markov modulated Poisson process, where arrivals
vary randomly during an
ON period (the conference sessions). Session durations
were Pareto distributed, with most sessions under 5 minutes in length, and many
of the longest sessions idle and transferring little data. The most popular application
20 MEASURING WIRELESS LANs
was again WWW browsing, and since SIGCOMM participants are predominantly
computer scientists, ssh was the second most popular application. Unlike most stu-
dies, the majority of users (over 80%) were seen at more than one AP in a day,
although this may be conference-specific, where an attendee does not have a desig-
nated seat, and so they would associate with a different AP depending on where
they are sitting in a given conference session. AP loads were found to vary not
with the number of users, but rather with the applications that individual users
are using.
1.3.3 Wireless-Side Measurement Studies
As we have described in Section 1.2, wireless sniffing is complicated, and as such,
there have been few large measurement studies of the wireless side of a WLAN.
In two studies, Yeo et al. [26,27] looked at the difficulties of conducting
wireless-side measurement. To estimate the amount of loss incurred in wireless
measurement, three wireless sniffers were compared to a wired sniffer and SNMP
polls with an interval of one minute. A packet generator was used to send UDP
packets, marked with sequence numbers, between hosts, all on the same channel.
The thr ee sniffers were found to have different viewpoints of the wireless medium.
All the sniffers were more successful at capturing traffic from the AP, rather than
from the clients, as APs tend to have larger and more powerful antennas, and clients
may move around and end up out of sight of a sniffer. On average, the sniffers saw
99.4% of the packets from the AP, but only 80.1% of the packets from clients. By
merging the traces from the three wireless sniffers, this capture rate was improved,
to 99.34% of the traffic that the wired sniffer observed. One recommendation from
this study is that one sniffer should be placed near to the AP being monitored, with
any other sniffers placed as near as possible to the predicted location of clients.
In a subsequent experiment, Yeo et al. considered seven APs in the University of
Maryland’s Computer Science department. Three wirel ess sniffers were used,
equipped with Orinoco 802.11b NICs placed into monitor mode, locked to one
channel (6), and configured to capture 802.11 frames using the Prism2 file format.
This enabled the monitoring of the three APs that were using channel 6. The study
took place over 2 weeks, although there was one hole because the sniffers ran out of
disk space.
This study concentrated on the PHY/MAC layer, as this can be examined only
using wireless sniffers. The maximum throughput seen on a single AP was only
1.5 Mbps, due to contention on the channel that was shared between the three
APs. The level of transmission errors, that is, the number of retransmitted frames
divided by the total number of frames, varied by day, but there were more transmis-
sion errors in the data being sent to an AP, rather than from an AP. Examining the
types of fra mes, they found that dataframes made up 50.7% of the frames sniffed,
and beacon frames made up 46.5%. Association and reassociation response frames
tended to be sent at the highest data rate, 11 Mbps, whereas the corresponding
request frames were sent at 1 Mbps. The 802.11 standard does not specify a behavior
for response frames, and b y sending responses at a high data rate, many response
MEASUREMENT STUDIES 21
frames did not reach the client and needed to be retransmitted. Other management
frames, including probe response and power-save polls, were also often retrans-
mitted. For data frames, multiple data rates were common, and the average data
rate was 5.1 Mbps.
Mishra et al. [17] used wireless sniffing to look solely at the 802.11 MAC layer
handoff process. Eight machines were used as wireless sniffers, with a total of 14
802.11b NICs instal led across the machines. Each NIC was set in monitor mode
and locked to one individual channel, which allowed the monitoring of all 11
2.4 GHz channels. One user with a laptop then walked around the University of
Maryland Computer Science department, which had three WLANs comprising
some 60 APs using Cisco, Lucent, and Prism2 chipsets. As this study concentrated
on handoffs, the only frames that the sniffer recorded were probe requests and
probe responses, reassociations, and authentication frames. To examine variations
in handoffs between device drivers, three different 802.11b NICs were used in the
client laptop: Lucent Orinoco, Cisco 340, and a ZoomAir Prism2 .5.
Across all the devices, probe delay (probe request and probe response frames)
was found to account for over 90% of the overall handoff latency. There was a large
variation in the handoff latency between devices, with a Lucent client and Cisco AP
taking an average of 53.3 ms, and a Cisco client and Cisco AP taking 420.8 ms.
With the same device and AP configuration, there was a large variation in handoff
latency, and the higher the latency, the higher the standard deviation. Some of the
differences in latency between devices could be explained by the different beha-
viors between devices. The Lucent and Prism NICs would send a reassociate
request prior to authenticating with a new AP, and a second reassociate request after
authentication. There were also large differences between each device’s probe wait
time (the amount of time that a scanning client waits before moving on to scanning
the next channel). The Cisco client sent 11 probes on each channel, and spent 17 ms
on channels with traffic, and 38 ms on channels with no traffic; the Lucent sent three
probes on channels 1, 6, and 11, and spent almost the same amount of time on
channels irrespective of traffic; the ZoomAir sent only three probes on channels
1, 6, and 11, and spent an additional 10 ms after the three probes on selecting
the AP with which to associate. Using the empirical data from the sniffer logs,
the authors suggest that device manufacturers could choose to lower these probe
wait times.
1.3.4 Discussion
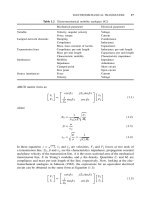
Table 1.1 lists the methods used in the studies that we have discussed above.
In summary, Table 1.1 shows that there have been several studies of academic
campus WLANs, and fewer studies of nonacademic WLANs. Common methods
include syslog, SNMP, and sniffing. The results of these studies show that the
most common applications used on a WLAN are not neces sarily mobile applica-
tions, with HTTP accounting for most traffic, and telnet and ssh used in computer
science environments. Short flows and sessions are common, and this should be
kept in mind when choosing poll intervals for a measurement study. Users tend
22 MEASURING WIRELESS LANs
TABLE 1.1 Wireless Studies and Methods Used
Methods Used
————————————————————————————————————
SNMP Authentication Client Wireless
Study Location Duration APs Syslog [Poll Interval (min)] Sniffers Logs Tools Sniffing
Balachandran et al. [3] Conference 52 hours 4 1 3
Balazinska and Castro [4] Corporate 4 weeks 117 5
Chinchilla et al. [5] Academic 11 weeks 222 33
Henderson et al. [9] Academic 17 weeks 566 3 5 3
Hutchins and Zegura [10] Academic 2 months 109 15 33
Kotz and Essien [13] Academic 11 weeks 476 3 5 3
McNett and Voelker [16] Academic 11 weeks >400 3
Mishra et al. [17] Lab 30 min 60 3
Schwab and Bunt [20] Academic 1 week 18 33
Tang and Baker [23] Academic 12 weeks 12 2 33
Yeo et al. [26,27] Lab 2 weeks 3 1 33
23
to be nonmobile, although the introduction of new always-on devices is leading to
increased mobility. APs tend to be unevenly used across a WLAN, with certain
locations accounting for high levels of traffic. Trace-based mobility models and pre-
dictors have been developed, and it will be interesting to see how these perform
with traces of newer, more mobile, clients.
Wireless sniffing is still a new area, and one that presents many challenges. The
studies that have used wireless sniffing are much smaller than those that have used
wired sniffing, syslog and SNMP, and have concentrated on specific channels in
specific locations. Although small, these studies have yielded insights into 802.11
MAC behavior, and highlighted the differences between chipsets and devices. For
instance, 46.5% of the frames observed in one study were 802.11 beacons, which
indicates the large amount of data that can be missed in a wired sniffing study.
Larger-scale wireless sniffing, with a variety of chipsets and device types, could
prove useful for future wireless protocol development.
1.4 CONCLUSIONS
Wireless LANs are becoming increasing popular, and it is useful to be able to mea-
sure various characteristics of these WLANs. In this chapter we have discussed the
tools available for measurement, and the studies that have already been conducted
using these tools. To conclude, we present a checklist that we hope will be useful
for those intending to carry out a wireless measurement study.
1.4.1 Wireless Measurement Checklist
Determine which tools are most appropriate for the purposes of the study.
Syslog is useful for mobility, while SNMP is an easy method for extracting
traffic statistics. Client tools and wireless sniffing provide the most detail, but
incur the greatest costs in terms of setup time and equipment. It is also useful
to use multiple tools and correlate the data, such as using MAC addresses
observed in syslog messages to verify that sniffer logs are accurately capturing
wireless client traffic.
Gain approval from the appropriate Institutional Review Board for human-
subjects research. Wireless data collection can involve potentially sensitive
information, such as the location of wireless users or the data that they are
transferring.
Decide how much of the WLAN will be monitored. Different tools may be
able to monitor different parts; for instance, it may be easy to use SNMP to
monitor every AP, but sniff only a subset of the WLAN.
Draw up a list of all the APs to be measured. If required, determine the
physical location of these APs, using a building plan and/or GPS.
24 MEASURING WIRELESS LANs
Ensure that all the APs that are to be measured are configured correctly,
for example, that they are configured to send syslog messages, or to allow
SNMP queries, and that the network security policies (if any) allow this syslog
and SNMP data to be transmitted to the host that is storing the data. Do not
rely on a sysadmin to do this, but confirm it for yourself.
Test the data collection and analysis software in a ‘‘dry run’’ before the actual
measurement study begins. Checki ng that the analysis software works will
help to determine whether sufficient data are being collected and if the
appropriate tools are being used.
Closely monitor the data collection. Keep track of changes in output, such as
syslog messages changing as a result of AP firmware changes. Measuring
devices may malfunction or run out of disk space, which also requires careful
monitoring.
Keep in touch with the WLAN’s sysadmins. It is important to know when new
APs are installed, or when existing APs are moved or decommissioned.
Minimize disruption on the network being measured. Most of the tools
described here are active measurement tools, in that they generate additional
network traffic. It is vital not to impact the network being monitored. For
instance, on one particular type of AP, we have found that frequent SNMP
queries could cause the AP to stop forwarding packets.
Expect the unexpected! Measurement of a live network, with large numbers of
real wireless network users, may encounter many surprising events. We have
had our measurement studies impacted by viruses, worms, misconfigured
wireless clients, firewalls, changes in network subnetting and VLANs and
more. With a comprehensive monitoring system as discussed above, however,
we have been able to detect mos t of these problems and reconfigure the
measurement infrastructure where required.
Readers who are intere sted in conduc ting a wireless measurement study, or who
would like access to data from some of the studies discussed here, are directed to
our Websites at
/>
campus and http://
crawdad.cs.dartmouth.edu/
.
REFERENCES
1. Apware project, />2. F. Baker, Requirements for IP Version 4 Routers, IETF RFC 1812, June 1995.
3. A. Balachandran, G. M. Voelker, P. Bahl, and P. Venkat Rangan, Characterizing user
behavior and network performance in a public wireless LAN, Proc. Int. Conf. Measure-
ments and Modeling of Computer Systems (SIGMETRICS), Marina Del Rey, CA, June
2002, ACM Press, pp. 195–205.
REFERENCES 25
4. M. Balazinska and P. Castro, Characterizing mobility and network usage in a corporate
wireless local-area network, Proc 2003 Int Conf Mobile Systems, Applications, and
Services (MobiSys), San Francisco, May 2003, USENIX Assoc., pp. 303–316.
5. F. Chinchilla, M. Lindsey, and M. Papadopouli, Analysis of wireless information locality
and association patterns in a campus, Proc. 23rd Annual Joint Conf. IEEE Computer and
Communications Societies (InfoCom), Hong Kong, March 2004, IEEE.
6. Ethereal protocol analyzer,
.
7. EtherPeek protocol analyzer, .
8. J. Flick and J. Johnson, Definitions of Managed Objects for the Ethernet-like Interface
Types, IETF RFC 2665, Aug. 1999.
9. T. Henderson, D. Kotz, and I. Abyzov, The changing usage of a mature campus-wide
wireless network, Proc. 10th Annual ACM Int. Conf. Mobile Computing and Networking
(MobiCom), Philadelphia, Sept. 2004, ACM Press.
10. R. Hutchins and E. W. Zegura, Measurements from a campus wireless network, Proc.
IEEE Int. Conf. Communications (ICC), New York, April 2002, IEEE Computer Society
Press, Vol. 5, pp. 3161–3167.
11. IEEE 802.11 MIB,
/>MIB-D6.2.txt
.
12. Kismet wireless sniffing software, .
13. D. Kotz and K. Essien, Analysis of a campus-wide wireless network, Wireless Networks
11: 115–133 (2005).
14. C. Lonvick, The BSD Syslog Protocol, IETF RFC 3164, Aug. 2001.
15. K. McCloghrie, D. Perkins, and J. Schoenwaelder, Structure of Management Information
Version 2 (SMIv2), IETF RFC 2578, April 1999.
16. M. McNett and G. M. Voelker, Access and Mobility of Wireless PDA Users, Technical
Report CS2004-0780, Dept. Computer Science and Engineering, Univ. California, San
Diego, Feb. 2004.
17. A. Mishra, M. Shin, and W. A. Arbaugh, An empirical analysis of the IEEE 802.11 MAC
layer handoff process, ACM SigComm Comput. Commun. Rev. 33(2):93–102 (April
2003).
18. Net-snmp SNMP tools,
.
19. Network Chemistry RFProtect wireless intrusion protection system, http://
www.networkchemistry.com
.
20. D. Schwab and R. Bunt, Characterising the use of a campus wireless network, Proc. 23rd
Annual Joint Conf. IEEE Computer and Communications Societies (InfoCom), Hong
Kong, March 2004, IEEE.
21. L. Song, D. Kotz, R. Jain, and X. He, Evaluating location predictors with extensive Wi-Fi
mobility data, Proc. 23rd Annual Joint Conf. IEEE Computer and Communications
Societies (InfoCom), Hong Kong, March 2004, IEEE.
22. Sveasoft alternative Linksys WRT54G firmware,
asoft. com/.
23. D. Tang and M. Baker, Analysis of a local-area wireless network, Proc. 6th Annual ACM
Int. Conf. Mobile Computing and Networking (MobiCom), Boston, Aug. 2000, ACM
Press, pp. 1–10.
24. Tazmen Sniffer Protocol,
workchemistr y.com/support/
appnotes/an001_tzsp.html
.
26 MEASURING WIRELESS LANs
25. Tcpdump packet capture software, .
26. J. Yeo, S. Banerjee, and A. Agrawala, Measuring Traffic on the Wireless Medium:
Experience and Pitfalls, Technical Report CS-TR 4421, Dept. Computer Science, Univ.
Maryland, Dec. 2002.
27. J. Yeo, M. Youssef, and A. Agrawala, Characterizing the IEEE 802.11 Traffic: The
Wireless Side, Technical Report CS-TR 4570, Dept. Computer Science, Univ. Maryland,
March 2004.
REFERENCES 27