Tài liệu Corruption, Democracy, and Economic Growth pdf
Bạn đang xem bản rút gọn của tài liệu. Xem và tải ngay bản đầy đủ của tài liệu tại đây (187.86 KB, 17 trang )
z
A. COOPER DRURY, JONATHAN KRIECKHAUS, AND MICHAEL LUSZTIG
Corruption, Democracy, and Economic Growth
A. COOPER DRURY, JONATHAN KRIECKHAUS, AND MICHAEL LUSZTIG
A
BSTRACT
. Scholars have long suspected that political processes such as
democracy and corruption are important factors in determining
economic growth. Studies show, however, that democracy has only
indirect effects on growth, while corruption is generally accepted by
scholars as having a direct and negative impact on economic perfor-
mance. We argue that one of democracy’s indirect benefits is its ability to
mitigate the detrimental effect of corruption on economic growth.
Although corruption certainly occurs in democracies, the electoral
mechanism inhibits politicians from engaging in corrupt acts that
damage overall economic performance and thereby jeopardize their
political survival. Using time-series cross-section data for more than 100
countries from 1982–97, we show that corruption has no significant
effect on economic growth in democracies, while non-democracies suffer
significant economic harm from corruption.
Keywords: • Corruption • Democracy • Economic growth • Political
economy • States
It is no great insight to proclaim that liberal democracies tend to be wealthier than
non-democracies. Since the end of World War II, a great deal of scholarly effort
has gone into exploring the relationship between economic growth and liberal
democracy, with many pursuing an obvious explanation for their association,
namely that democracy facilitates wealth by stimulating economic growth.
1
While
intuitively appealing, reality suggests the relationship is more complicated.
Indeed, a number of studies find no direct, statistically significant relationship
between democracy and economic growth, although democracy appears to have
important indirect influences on growth, due to its positive effect on such things as
educational expenditure, life expectancy, and political stability (Baum and Lake,
2003; Helliwell, 1994; Kurzman et al., 2002). This does not put an end to the
matter, of course. It simply suggests that greater understanding is needed of the
apparently symbiotic role played between the most robust system of government
International Political Science Review (2006), Vol 27, No. 2, 121–136
DOI: 10.1177/0192512106061423 © 2006 International Political Science Association
SAGE Publications (London, Thousand Oaks, CA and New Delhi)
ever developed (Fukuyama, 1992) and the economic growth and efficiency that
appears to sustain it.
We attempt to enhance the understanding of the indirect effects that democ-
racy has on economic growth. Although our focus is on just one of these indirect
effects, it is one that, as is clear from the discussion below, is substantively
important and exists worldwide to varying degrees. We concentrate on political
corruption, which is present in all regimes, albeit at differing levels. We are hardly
the first to delve into the role that corruption plays with respect to economic
growth. As the literature review below suggests, some argue that corruption has
beneficial effects for an economy. We disagree, and while this disagreement is
somewhat intuitive, some of our findings are unexpected and shed new light on
the connection between democracy and economic performance.
In this article, we use time-series cross-section data from 100 countries over a 16-
year period and find, rather intuitively, that corruption has a significant, negative
impact on economic performance in non-democracies. Our unique contribution,
however, is to explore further these relationships by examining democracy’s
indirect effects on economic growth. Our expectation (discussed below) is that
democracy will mitigate the negative effects of corruption, since the electoral
mechanism allows citizens to evict politicians that engage in particularly damaging
forms of corruption. Democracy, in other words, may exhibit no direct statistical
relationship with economic growth, but it clearly serves to militate against the
negative economic effects of corruption.
The Effects of Corruption and Democracy on Economic Growth
We now turn to a discussion of corruption’s effect on economic growth and then
explain how democracy ameliorates this effect.
The Ill Effects of Corruption
We define corruption “as the abuse of public office for private gain,” whether
pecuniary or in terms of status. The gain may accrue to an individual or a group,
or to those closely associated with such an individual or group. Corrupt activity
includes bribery, nepotism, theft, and other misappropriation of public resources
(see Bardhan, 1997: 1321; Lambsdorff, 1999: 3–4; Nye, 1967: 419; Shleifer and
Vishny, 1993: 599). The predominant, although not exclusive, view of corruption
is that it is damaging to economic performance as both a tax on productivity and a
market distortion.
Mauro (1995) finds empirically that corruption reduces private sector invest-
ment even in countries featuring cumbersome economic regulations, where
corruption might be expected to spur investment. Shleifer and Vishny (1993)
suggest that one reason for this is that corruption is more than simply a tax on
economic activity, primarily because there is no central mechanism for collection.
Instead, rapacious consumers of graft may be innumerable. Post-communist
Russia illustrates the point nicely:
To invest in a Russian company, a foreigner must bribe every agency involved in
foreign investment, including the foreign investment office, the relevant
industrial ministry, the finance ministry, the executive branch of the local
government, the legislative branch, the central bank, the state property bureau,
122 International Political Science Review 27(2)
and so on. The obvious result is that foreigners do not invest in Russia.
(Shleifer and Vishny, 1993: 615; see also Bardhan, 1997: 1324–6)
Rose-Ackerman (1996) also argues that corruption generates more distortion than
does mere taxation. Just as an incentive to bribe exists, one to receive bribes also
exists. Put differently, there is an underappreciated supply-side to the market for
rent-seeking. One manifestation is that policymakers may promote initiatives
(public works projects are an excellent example) not to satisfy social need, but
because such projects increase opportunities for bribes.
Moreover, as the literature on rent-seeking and directly unproductive activity
suggests, the construction of a market for political influence and favors generates
high opportunity costs in that it dissipates resources that could otherwise be used
on productive activity (Bhagwati, 1982; Brooks and Heijdra, 1988; Krueger, 1974;
Lien, 1990; Tullock, 1967). Thus, corruption draws off funds that would otherwise
be available for economic growth.
The other view of corruption suggests that while corruption itself may be
deplorable and unethical to moralists, its effects need not be economically
detrimental. Leff (1968) argues that where government sets for itself the task of
economic modernization (dictatorships of the right or left are excellent exam-
ples) graft may promote economic growth. That is, graft provides an alternative
channel to influence for private sector interests otherwise not well represented
(Nye, 1967: 420). Huntington (1968: 69) states it even more boldly: “the only
thing worse than a society with a rigid, overcentralized, dishonest bureaucracy is
one with a rigid, overcentralized, honest bureaucracy.”
Corruption also can be economically beneficial because it tends to favor the
most efficient firms. Many forms of corruption take the form of the sale of limited
commodities (whether these are policies, import licenses, or firm-specific favors,
supply may be assumed to be low and demand high). As such, a crude market for
favors emerges, with the richest (and perhaps most efficient) firms most able to
outbid their rivals. Weaker firms must become more efficient to compete in this
black market, or exit the productive sector (Leff, 1968). The success of these
firms, moreover, provides a broader base of taxation and public spending,
assuming at least some of the monies are reinvested by the state (Nye, 1967: 420).
Even those that do argue that corruption has economic benefits do not suggest
that corruption is efficient per se. Among others, Leff (1968) characterizes
corruption as a tax on economic activity; few see taxes as spurs to economic
growth. Rather, their point is that, under some circumstances, corruption is more
efficient than the alternative.
In sum, the literature on the economic effects of corruption yields two
positions. The first, more traditional and accepted position is that corruption has
few virtues: it renders otherwise good government bad and bad government
worse, it dissipates resources that could be used productively, and generates suffi-
ciently high transaction costs to limit significantly investment. The second view is
that corruption serves to create an economic equilibrium in states that are
excessively bureaucratic, rationalizing the weakest firms from the marketplace and
substituting private-sector economic decision-making for that provided by the
state. This second position is problematic because it does not consider the
incentive for all officials to get into the corruption game, the result of which is
excessive taxation on productivity. Further, most of those arguing the benefits of
corruption regularly point out that it is not the ideal, but perhaps better than a
DRURY/KRIECKHAUS/LUSZTIG: Corruption, Democracy, and Economic Growth 123
rigid, inefficient bureaucracy. Therefore, we hold that corruption will have a
negative impact on GDP growth, holding other factors constant.
We now turn to the discussion of democracy and economic performance,
where we argue that democracy has the indirect benefit of mitigating corruption’s
harmful impact on an economy.
The Indirect Benefit of Democracy
As a type of government, democracy is touted as having many benefits, both
political and economic. The economic benefits are not entirely clear, however.
Several writers have argued that democracy has positive effects on economic
growth for a variety of reasons. First, democracy allows for the eviction of bad
leaders. North (1990), for instance, argues that authoritarian elites will prey upon
societies unless constrained by democratic institutions. Bueno de Mesquita et al.
(2001) similarly argue that authoritarian leaders have few checks on their power
and thus engage in cronyism and corruption. Olson (1993), along with Przeworski
and Limongi (1993), provide analogous, albeit more complicated, arguments.
In addition to this general idea that democracy allows citizens periodically to
evict politicians who hurt the economy, a second and complementary set of
arguments focus on the microeconomic effects of a democratic political climate.
Sirowy and Inkeles (1990: 133–4) nicely summarize these effects:
Overall, the extension and protection of civil liberties and basic freedoms are
thought to generate the security of expectation necessary to motivate citizens
to work, save, and invest . . . In addition, popular political participation not
only has the consequence of breaking down the privilege and vested interests
of a few but also feeds a participative mentality that carries over into the
economic arena and greatly increases the flow of information so essential to
effective and efficient governments. In sum, political pluralism acts to release
energies and foster conditions conducive to change, entrepreneurial risk, and
economic development.
Third, Lipset (1959, 1960) argues that a symbiotic relationship between wealth
and democracy exists. Specifically, he suggests that democracy is most likely to
occur in an industrialized society in which wealth is generated by a large number
of (middle-class) industrial producers. In turn, the middle class retains a strong
stake in a system that provides sufficient freedom of choice (political and eco-
nomic) to permit the creation of more wealth.
The more pessimistic view of democracy is rooted in an older literature. This
pessimistic view was popularized by Samuel Huntington, who argued that in newly
democratic developing countries, citizen demands will rapidly escalate and gener-
ate high levels of government spending. Huntington and Nelson (1976: 23) argue
that one response is that “political participation must be held down, at least
temporarily, in order to promote economic development.” Similar arguments can
be found in the literature on East Asia, which generally suggests that authoritarian
regimes better avoid rent-seeking and politically motivated policy mistakes
(Haggard, 1990). In sum, democracies are argued to reduce the surplus available
for investment, with a consequent negative effect on economic growth.
A second critique of democracy stems from the neoclassical political-economy
literature. Olson, for instance, argues that special interest groups tend unduly to
124 International Political Science Review 27(2)
influence state policy, reaping particularistic privileges that damage the overall
economy. Olson (1982) argues that as a democracy ages, it becomes more plural-
istic and consequently less efficient. This “political” inefficiency leads to decreased
economic performance. Simply put, in older democracies there is more time for
interest groups to overcome the difficulties associated with collective action
(Olson, 1982). As a result, there are ever-more demands on the resources of the
state. Moreover, because the democratic state reflects, at least to some degree, the
political make-up of its constituents, there are more voices represented in
government, leading to political sclerosis. The result is decreased governmental
efficiency and, therefore, decreased economic performance (see also Bell, 1976;
Brittan, 1975; Schmitter and Karl, 1991). Scholars in the developmental state
tradition develop this argument in depth, arguing that authoritarian regimes,
especially in East Asia, are better able to resist special interest groups’ distributive
demands and rent-seeking pressures (Amsden, 1989; Evans, 1995; Wade, 1990).
Finally, Przeworski and Limongi (1993) resurrect the 19th-century argument
that democracy undermines the security of property rights by providing the dispo-
ssessed with a powerful political tool for expropriating the wealth of property-
holders, a result that could lead to considerable economic uncertainty and thus
lower economic growth.
While both positive and negative findings have been argued, the more recent
empirical literature suggests that neither perspective is accurate, or perhaps both
are accurate and they balance each other out. Using different methodologies and
a fairly sophisticated set of techniques for dealing with endogeneity, both Helliwell
(1994) and Przeworski et al. (2000) conclude that there is simply no statistically
significant relationship between democracy and growth.
This does not mean, however, that democracy has no significant impact on
growth at all. Instead, democracy has no direct effect on growth, but scholars are
increasingly realizing that democracy does have important indirect effects.
Democracy, for instance, is more likely to lead to greater spending on education
and health, both of which facilitate economic growth (Baum and Lake, 2003;
Helliwell, 1994). Moreover, democracy facilitates political stability, which is also
known to be good for economic growth.
We further pursue this insight that democracy might have important indirect
effects, especially pertaining to corruption. Our argument is grounded in one
interesting variant of the compatibility perspective, namely the claim that
democracy facilitates growth since citizens are better able to remove corrupt
politicians (Bueno de Mesquita et al., 2001; North, 1990). We argue, by extension,
that democracy may not merely reduce the level of corruption, but also change
the composition of corruption.
Our argument rests upon two plausible assumptions. First, politicians weigh the
costs and benefits of specific acts of corruption when they are faced with the
choice of engaging in an illicit act. Corrupt behavior yields obvious benefits, inclu-
ding both personal enrichment and the ability to gain political support from those
groups benefiting from corruption. These potential benefits exist for most
politicians in most political systems.
Corruption also entails costs, however. Our second assumption is that these
costs vary substantially across types of corruption and types of political system. The
cost to politicians is primarily determined by how a given act of corruption hurts
particular societal actors, and how capable those actors are of responding to this
damage through the political system. The ability of the society to react is largely
DRURY/KRIECKHAUS/LUSZTIG: Corruption, Democracy, and Economic Growth 125
determined by regime type. In authoritarian systems, as Bueno de Mesquita et al.
(2001) note, the supporting or ruling coalition is relatively small. Consequently,
the costs of corrupt behavior imposed upon the majority of the population can be
safely ignored. Given that authoritarian leaders will not suffer retribution from
society, they can engage in extremely costly forms of corruption. A good example
of such systematic corruption is Zaire from 1962 to 1994, where Mobuto allowed
90 percent of the road network to erode away, deciding quite rationally that this
severe misallocation of resources from infrastructure to corruption would not
threaten his ability to maintain power (Evans, 1995).
In democratic systems, citizens can remove politicians and, therefore, both the
level and composition of corruption will be lower. Corrupt activities that impose a
large cost on society will annoy voters, which is costly for politicians. When these
costs outweigh the benefits of any given corrupt act, politicians will be deterred
from corruption. This will reduce the total number of corrupt activities in a
democracy. More interesting, for our purposes, is that this reduction in corruption
will not be even across all forms of corruption. Instead, politicians will avoid those
types of corruption that cost society dearly, given that such acts are most likely to
have severe political consequences – namely, removal from office. Corruption that
impedes important investments in physical infrastructure and education will not
be pursued because the political costs outweigh the benefits. However, less costly
forms of corruption, such as nepotism or bribes for expedited access to govern-
ment officials, may continue unabated because the benefits continue to outweigh
the minor political costs.
In sum, our expectation is that at any given level of corruption, the effect of that
corruption on economic growth will be lower in a democracy than under author-
itarian rule. A democracy might experience high levels of corruption, but this
corruption will be restricted to those activities and sectors that have relatively little
impact on national economic performance because voters will definitely act to
remove politicians that engage in significant growth-impairing corruption. This
ability to punish elected officials provides a powerful incentive for politicians to
confine their corrupt activities to economically irrelevant activities.
This is a rather common-sense intuition, but it has interesting implications for
the relationships between democracy, corruption, and growth. Our expectation is
that corruption will have a negative effect on growth in authoritarian regimes, as
per conventional theory, but we believe that in a democracy this negative effect
will be much weaker, because citizens will demand that politicians at least keep
their corrupt behavior from influencing what is probably the most important
means of legitimacy in modern nations – economic growth.
Data
We now turn to a discussion of the data we use to test our argument. The data are
arrayed as a time-series cross-section of more than 100 countries for 16 years
(1982–97). Summary statistics for the data appear in Table 1. Our dependent
variable, growth of GDP, is measured by the World Bank’s World Development
Indicators (2003).
For our first independent variable, corruption, we rely on the International
Country Risk Guide’s (ICRG) assessment of corruption in a wide range of
countries between 1982 and 1997. The index ranges from six to zero, with lower
scores indicating that:
126 International Political Science Review 27(2)
“high government officials are likely to demand special payments” and “illegal
payments are generally expected throughout lower levels of government” in
the form of “bribes connected with import and export licenses, exchange
controls, tax assessment, policy protection or loans.” (Knack and Keefer, 1995:
225)
We recode the original data so that the least corrupt countries (for example,
Australia, Finland, Sweden, and so on) score a zero, while the most corrupt (for
example, Bangladesh, Haiti, Niger, and so on) score a six. Thus, higher values
mean higher levels of corruption. Alternative measures of corruption also exist,
but have severe limitations as compared to the ICRG measure. Mauro (1995)
provides a measure of corruption, but it is only available for one year. A somewhat
better measure is Transparency International, which provides data for 1996–2003.
Given data limitations for other variables, it would only be possible to examine up
until 2001, which would leave merely six years of data. By comparison, the ICRG
data exists for a much longer period, from 1982 until 1997.
Our second independent variable, democracy, is captured by the most common
indices used in the literature. First, we use the Polity IV data (Marshall and
Jaggers, 2000), which measures a country’s level of democracy and autocracy and
creates an overall measure by subtracting the latter from the former. The result is
a score that ranges from –10 to 10. We dichotomize this variable because we want
to measure the effect a democratic regime has on economic performance and
corruption. It is in democracies that we expect to see beneficial effects on
economic growth and mitigating effects on corruption.
Second, we use the equally prominent Freedom House measure of democracy,
which consists of a combined score of a country’s political rights and civil liberties,
resulting in an index that runs from 2 to 14, with lower scores indicating more
democracy. We dichotomize this index at 5.5, based on Freedom House’s judg-
ment that countries with a score of less than 5.5 are either “free” or “partially free,”
whereas countries with a score of more than 5.5 are “not free.”
Third, as an additional check on the robustness of the results, we utilize an
index of democracy created by Alvarez, Cheibub, Limongi, and Przeworski
(ACLP). Alvarez et al. (1996) argue that democracy should not be rated along a
scale, as Polity and Freedom House do, but rather be measured as a dichotomous
variable in which countries either are or are not democratic. They rate countries
as democratic if: (1) the chief executive is elected, (2) the legislature is elected,
DRURY/KRIECKHAUS/LUSZTIG: Corruption, Democracy, and Economic Growth 127
TABLE 1. Summary Statistics
Standard
Variable Mean deviation Minimum Maximum
Growth 1.734 6.813 –52.096 138.897
Level of corruption 2.629 1.464 0 6
Life expectancy 4.090 0.211 3.441 4.391
Trade openness 67.922 51.430 0 440.500
Population growth 0.019 0.013 –0.174 0.174
Logged GDP per capita 8.162 1.030 5.639 10.692
Tropical climate 0.500 0.478 0 1
Government spending 20.606 13.342 1.578 180.346
and (3) there is more than one party (Alvarez et al., 1996; Przeworski et al., 2000).
For a critical review of these three different measures of democracy, see Munck
and Verkuilen (2002).
We also include six control variables in the model. Theoretically, there are
strong reasons to believe that each influences economic growth. Empirically, these
variables have generally been found to correlate with growth in most previous
cross-sectional analyses (Barro, 1997; Bleaney and Nishiyama, 2002). The cross-
sectional time-series literature on growth is much sparser, but Kurzman et al.
(2002) find that these variables perform reasonably well in pooled samples.
First, the inclusion of initial GDP is suggested by basic neoclassical theory.
Given diminishing returns to capital, rich countries should grow less rapidly than
poor countries. Barro (1991) used the log of initial GDP as a proxy for the capital
stock; this proxy has become a staple of statistical analyses of growth.
Our second control variable is logged life expectancy. Economists argue that
the overall health of workers allows for greater productivity, since workers are
more able to work diligently, for longer hours, and without succumbing to disease
or debilitation. It is likely that these factors are particularly important in
developing countries, since much labor is physically strenuous and citizens’ overall
health is more likely to be salient than with respect to white-collar jobs. The typical
quantitative measure of health is the log of average life expectancy (Barro, 1997).
Third, government consumption may retard growth since government expen-
ditures entail higher levels of taxation and thereby reduce private sector actors’
willingness to work or produce. More generally, government consumption shifts
resources from the private sector to the public sector, and most economists
believe that the private sector more efficiently allocates resources than the public
sector.
Fourth, population growth may inhibit economic growth. When the rate of
population growth is high, the large number of new workers entering the work-
force serves to dilute total capital per worker. For any given level of investment,
the capital stock per worker will fall, resulting in lower levels of economic
productivity.
Fifth, trade openness is expected to influence growth positively. According to
Ricardo’s theory of comparative advantage, state-induced deviation from free
trade will merely employ the world’s resources inefficiently and reduce world out-
put. Most empirical studies find that greater trade openness does in fact facilitate
growth, and this variable is accordingly a common control variable.
Sixth, we include a dummy variable identifying the proportion of a country that
is tropical, as defined by the proportion of the country that lies between the tropic
of Cancer and the tropic of Capricorn. This variable has been popularized by
Sachs and Warner (1997), who note that in a variety of ways agricultural produc-
tivity and health is lower in tropical climates.
We did not include education as a control variable because a number of African
countries fell out of the analysis due to missing data, and we wished to retain as
large a sample as possible. We did, however, run all of the analyses with education
in the analysis, and found little change in the results.
Finally, while earlier growth studies frequently included investment as a control
variable, it is increasingly recognized that this represents a suboptimal control
(Bleaney and Nishiyama, 2002). First, causality is ambiguous, since rapid rates of
growth lead to higher levels of investment. Second, investment constitutes an
intervening variable rather than a true independent variable; as such, it is not
128 International Political Science Review 27(2)
appropriate to control for its effects (King et al., 1994: 78). One means by which
corruption might influence growth, for instance, is to reduce the quantity of
private or public investment. Therefore, to control for investment would
essentially control for the very effect we are trying to uncover.
Analysis
Selecting all of the countries for which data were available, the data set is
comprised of responses from more than 100 countries over a 16-year period. The
data are arrayed as a time-series cross-section. There are many more cases than
time periods, and data with this characteristic are very likely to have nonspherical
errors. We use panel-corrected standard errors to correct for this bias that might
otherwise inflate our significance measures (Beck and Katz, 1995: 636, 638–640).
Diagnostic tests revealed that GDP growth is autoregressive (Banerjee, 1999;
Drukker, 2003; Hadri, 2000; Im et al., 1997; Levin and Lin, 1993; Woodridge,
2002). We correct for this temporal dependence with a panel-specific AR(1)
model (Achen, 2000).
2
To test for the differences between non-democracies and democracies, we first
interact the democracy and corruption variables. This strategy permits us to
compare the impact of corruption on growth in democracies versus non-
democracies. We then separate the data into two models – one that includes only
non-democracies and the other that contains democracies. This approach
provides a more intuitive means to view the differential effects corruption has on
democratic and non-democratic regimes. Because we have three measures of
democracy, we report the analyses for each of these measures in Tables 2–4,
respectively.
3
Overall, the models (interaction, non-democracies, and democracies) are all
significant beyond the 0.0001 level, although their performance is not overly
strong, with the R
2
statistics ranging between 0.07 and 0.17, depending on the
measure of democracy used. While a higher R
2
would be preferable, it is worth
noting that Kurzman et al. (2002) report an even lower R
2
when examining
annual data. As they note, annual models are inherently “noisy,” given that
business cycles and other short-run factors are accounting for much of the annual
variation in growth.
The results in all three tables provide almost uniform support for our
argument. The first columns in Tables 2–4 report our results for the interaction of
democracy and corruption. For both the Polity and Freedom House measures, the
results support our argument that democracy mitigates the negative impact of
corruption on economic growth. Looking at Table 2, for example, the model
predicts that for each standard deviation increase in the level of corruption,
economic growth decreases by nearly 1 percent, holding all other variables
constant. However, the same increase in a democracy leads to a marginal 0.1
percent increase in the growth rate.
4
A nearly identical effect is found in Table 3.
These results clearly support the argument that corruption is a drag on economic
performance only in non-democratic regimes.
The insignificance of the corruption, democracy, and interaction variables in
Table 4 is most likely the result of the limited scope of the ACLP democracy
measure. Unlike the Polity and Freedom House data, the ACLP data end in 1990,
effectively truncating the analysis by seven years and cutting out almost half of the
data.
DRURY/KRIECKHAUS/LUSZTIG: Corruption, Democracy, and Economic Growth 129
130 International Political Science Review 27(2)
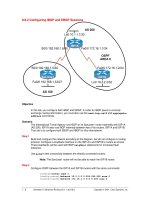
TABLE 2. The Effects of Corruption on Economic Growth in Non-Democracies and Democracies,
1982–97 (Polity IV Democracy Data)
Democracy/corruption Non-
interaction democracy Democracy
Level of corruption –0.583** –0.625** 0.37
(0.181) (0.174) (0.252)
Democracy –1.44
(0.946)
Corruption / democracy interaction 0.688**
(0.262)
Life expectancy 3.099 4.271 1.097
(2.131) (2.727) (3.400)
Trade openness 0.017** 0.018** 0.018**
(0.004) (0.007) (0.006)
Population growth –23.61 –35.863 –11.162
(16.595) (33.814) (19.173)
Logged GDP per capita –0.900* –1.132** 0.005
(0.358) (0.363) (0.630)
Tropical state –1.623** –1.345 –1.752**
(0.447) (0.922) (0.493)
Government spending –0.090** –0.090** –0.067*
(0.016) (0.022) (0.027)
Constant –0.84 –3.513 –2.998
(7.543) (11.341) (13.126)
Observations 1435 602 833
R
2
0.07 0.07 0.05
T
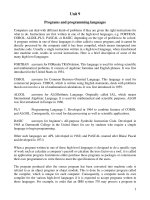
ABLE 3. The Effects of Corruption on Economic Growth in Non-Democracies and Democracies,
1982–97 (Freedom House Democracy Data)
Democracy/corruption Non-
interaction democracy Democracy
Level of corruption –0.462** –0.430** 0.072
(0.151) (0.148) (0.242)
Democracy –1.053
(0.743)
Corruption / democracy interaction 0.555*
(0.224)
Life expectancy 2.962 4.424 –0.207
(2.284) (2.507) (3.243)
Trade openness 0.018** 0.017** 0.018**
(0.003) (0.006) (0.004)
Population growth –43.900** –72.419** –3.061
(16.908) (22.422) (19.232)
Logged GDP per capita –0.902* –0.956* –0.508
(0.383) (0.419) (0.615)
Tropical state –1.550** –1.134 –2.232**
(0.399) (0.593) (0.627)
Government spending –0.081** –0.088** –0.031
(0.016) (0.021) (0.024)
Constant –0.5 –5.371 7.193
(7.813) (9.111) (12.064)
Observations 1506 761 745
R
2
0.09 0.08 0.09
Notes: Standard errors in parentheses
* significant at 5 percent; ** significant at 1 percent
As an alternative test, the second and third columns in Tables 2–4 report our
results for non-democracies and democracies as two separate samples. The tables
all show that corruption has a deleterious effect on economic performance in
non-democracies. As the interaction model predicts, a one standard deviation
increase in corruption leads to nearly a full point decrease in the annual growth
rate. Unlike their non-democratic brethren, however, economic growth in demo-
cratic regimes is unaffected by corruption. As each of the tables report, corruption
never attains or even approaches statistical significance for democratic countries.
Democracy itself seems to mitigate the economically damaging effects of
corruption. Unlike non-democracies, whose economic performance significantly
suffers from corruption, corrupt democracies apparently grow just as fast as
democracies with little to no corruption.
Our results show that corruption has a negative effect in authoritarian regimes,
but not democratic regimes, which supports our contention that democracy
mitigates the negative effects of any given level of corruption. There are three
alternative explanations for the lack of a correlation between corruption and
growth in democracies, however. The first concern is that the effects are simply
due to a lack of variation in corruption for democracies. If there was little to no
variation in the independent variable, then corruption clearly could not have an
DRURY/KRIECKHAUS/LUSZTIG: Corruption, Democracy, and Economic Growth 131
TABLE 4. The Effects of Corruption on Economic Growth in Non-Democracies and Democracies,
1982–90 (ACLP Democracy Data)
Democracy/corruption Non-
interaction democracy Democracy
Level of corruption –0.163 –0.551* 0.094
(0.164) (0.232) (0.332)
Democracy 0.281
(0.831)
Corruption / democracy interaction –0.357
(0.240)
Life expectancy 2.488 3.845 3.966
(2.046) (2.191) (5.042)
Trade openness 0.020** 0.023** 0.017**
(0.005) (0.006) (0.005)
Population growth –17.366 3.147 –21.078
(25.538) (41.129) (38.494)
Logged GDP per capita –1.171* –1.508** –0.977
(0.522) (0.514) (0.979)
Tropical state –2.247** –2.093** –3.067**
(0.501) (0.599) (0.640)
Government spending –0.110** –0.124** –0.069*
(0.015) (0.025) (0.029)
Constant 3.337 0.363 –5.286
(7.476) (9.242) (16.676)
Observations 788 399 389
R
2
0.14 0.17 0.10
Note: Standard errors in parentheses
* significant at 5 percent; ** significant at 1 percent
effect on growth even if democracy has no ameliorative effect whatsoever. In fact,
however, corruption does vary substantially in democracies, and even varies more
than in authoritarian regimes: the standard deviation of corruption is 1.4 in
democratic regimes and only 1.1 in authoritarian regimes.
A second potential issue is that while corruption might vary in both types of
regime, the mean level of corruption might be lower in democracies, causing
corruption to have no impact on the economy. Indeed, it is true that the average
corruption score in democracies is 2.0, while the average corruption score in non-
democracies is somewhat higher at 3.3. Although we certainly would not deny that
democracy might improve economic performance by reducing the level of corrup-
tion within countries, column one of both Tables 2 and 3 nonetheless confirms
that democracy mitigates the effect of any given level of corruption.
5
These models
control for the level of corruption in each country. Therefore, the fact that the
interaction term is statistically significant and positive confirms that even after
controlling for democracy’s possible effects through lowering corruption, there is
nonetheless an additional positive effect by reducing the impact of corruption at
any level.
A third and more subtle possibility is that despite the high variance of
corruption in democracies, there simply might not be enough corruption in any
democracy to reduce substantially economic growth, and that there is therefore
no way to falsify our hypothesis. In fact, however, many democracies exhibit very
high levels of corruption, including the maximum score of six. Moreover, fully 29
of the 52 democratic countries in our sample did at one point or another expe-
rience a level of corruption greater than or equal to the mean level of corruption
in authoritarian regimes. Thus, there are plenty of data to falsify our hypothesis.
Our main goal in the above analyses was to note that democracy mitigates the
negative effects of a given level of corruption, but it is also worth discussing the
influence of the control variables. It is important to note that previous extensions
of cross-sectional economic analysis to pooled data have generally rendered some
control variables insignificant, so we do not necessarily expect all control variables
to be significant.
6
For precisely this reason, however, it is interesting to examine
which control variables are robust to cross-sectional time-series analysis.
Neoclassical growth theory predicts that initial GDP has a negative effect on
growth, reflecting diminishing returns to capital in richer countries, and our
results confirm this standard prediction for the sample with non-democracies.
Economists also argue that government consumption hurts growth by taking
resources away from the (efficient) private sector and placing them within the
(less efficient) public sector (Barro, 1997). Economists analogously argue that
trade openness should enhance growth, given efficiency gains from comparative
advantage and greater opportunities for technology transfer. These free-market
expectations are confirmed in most of the analyses.
The effect of a tropical climate has not been previously tested in annual time-
series cross-sectional analysis, and our findings confirm the typical cross-sectional
finding, namely that the countries in a more tropical climate do in fact suffer
significantly less economic growth.
Finally, the last two control variables also have the anticipated effect, but their
effects do not generally reach statistical significance. Population growth impedes
economic growth, while higher life expectancy generally facilitates it, but while
the signs are as expected, the variables generally do not reach conventional levels
of significance.
132 International Political Science Review 27(2)
Conclusion
Scholars have long suspected that political processes such as democracy and
corruption are important for economic growth. Our theoretical argument, sup-
ported by empirical evidence, entails a significant reconceptualization of the
complex relationships between these three variables. Most studies of democracy
test its direct impact on economic growth and find no result. Most studies of
corruption test its aggregate impact on growth and find a negative effect. We
argue that the causal relationship between these variables is more complex.
Specifically, we argue that the negative effect of corruption is mediated by the
political process in which corruption occurs, and that democracy will mitigate or
reduce that negative effect. To understand the political effects of corruption, in
short, it is necessary to take into account the political context within which the
corruption occurs. Specifically, the ability in a democracy for the electorate to
remove its leaders from office seems to mitigate the stunting effect corruption has
on economic growth. Many democracies exhibit significant levels of corruption,
but their leaders must refrain from growth-impairing corruption lest they be
punished at the next election.
Our empirical results suggest the need for further research on the interaction
between democracy, corruption, and growth. We argue that a democracy’s
electoral mechanism causes corruption to have no impact on its economy. Future
research should explore the nature of this causal process. One specification of
that process would emphasize the impact of a free press, given that in a demo-
cratic context journalists are freer to publicize growth-impairing activities than in
an authoritarian context. Another causal story may be that institutions such as
political parties put in place mechanisms that constrain individual politicians from
engaging in growth-impairing corruption. Finally, democratic regimes are likely to
provide greater political independence for the judiciary, which provides yet
another check on the quantity and composition of corruption.
Finally, our results provide new insight into the relationship between politics
and economic growth. In addition to showing generally that political factors play a
large role in determining economic growth, our findings suggest that democracy
has yet another benefit to recommend it – mitigating corruption’s ill economic
effects. Given that some nations are rife with corruption, promoting democracy
within them may enhance not only their general human rights, but also their
opportunity for prosperity.
Notes
1. We define a liberal democracy as one that conforms to the following: a government
structure that preserves the rights and the autonomy of all individuals; where all
individuals are equal before the law; where state authority is limited, transparent, and
grounded in the protection of the rights of the individual; and where government elites
are selected by merit. The selection mechanism, moreover, must ensure the respon-
siveness of elites to civil society, and must entail selection of representatives through
popular elections with (near) universal voting rights.
2. We also ran the models presented below with lagged dependent variables in place of the
AR(1) correction. The results were comparable to those presented below; no signifi-
cant, substantive changes appeared.
3. Data, output, and command files (Stata 8) are available from the first author’s web
page.
DRURY/KRIECKHAUS/LUSZTIG: Corruption, Democracy, and Economic Growth 133
4. To calculate the effect of corruption in a democracy, we add the corruption and
interaction coefficients (Friedrich, 1982). The result is a near-zero effect of corruption
in a democracy. The small increase in growth indicated by the summed coefficients is
not significant. Additional evidence for this lack of significant impact appears in the
second and third columns of Tables 2–4, which show that the corruption variable is
positive in democratic states, but statistically insignificant.
5. The fact that average corruption is lower in democracies than in non-democracies
might be due to the beneficial effects of democracy, but the relationship might also be
spurious given that richer societies have undergone substantial political and social
modernization, and are hence more likely to be simultaneously democratic and less
corrupt.
6. Kurzman et al. (2002), for instance, compare cross-sections with pooled data using one-
year intervals (as in our analysis), and they find that R
2
falls sharply, while many control
variables become insignificant. Barro (1997) reports a similar phenomenon.
References
Achen, Christopher H. (2000). “Why Lagged Dependent Variables Can Suppress the
Explanatory Power of Other Independent Variables.” Paper presented at the Annual
Meeting of the Political Methodology Section of the American Political Science
Association, Los Angeles, CA, July 20–22.
Amsden, Alice H. (1989). Asia’s Next Giant: South Korea and Late Industrialization. New York:
Oxford University Press.
Alvarez, M., Cheibub, J.A., Limongi, F. and Przeworski, A. (1996). “Classifying Political
Regimes,” Studies in Comparative International Development 31(2): 3–36.
Banerjee, Anindya (1999). “Panel Data Unit Roots and Cointegration: An Overview,” Oxford
Bulletin of Economics and Statistics, Special Issue: 607–29.
Bardhan, Pranab (1997). “Corruption and Development: A Review of Issues,” Journal of
Economic Literature 35: 1320–46.
Barro, Robert J. (1991). “Economic Growth in a Cross Section of Countries,” Quarterly
Journal of Economics 106: 407–43.
Barro, Robert J. (1997). Determinants of Economic Growth: A Cross-Country Empirical Study.
Cambridge, MA: MIT Press.
Baum, Matthew A. and Lake, David A. (2003). “The Political Economy of Growth:
Democracy and Human Capital,” American Journal of Political Science 47: 333–47.
Beck, Nathaniel and Katz, Jonathan N. (1995). “What to Do (and Not to Do) with Time-
Series-Cross-Section Data in Comparative Politics,” American Political Science Review 89:
634–47.
Bell, Daniel (1976). The Cultural Contradictions of Capitalism. New York: Basic Books.
Bhagwati, Jagdish N. (1982). “Directly Unproductive Profit-Seeking (DUP) Activities,”
Journal of Political Economy 90: 988–1002.
Bleaney, Michael and Nishiyama, Akira (2002). “Explaining Growth: A Contest between
Models,” Journal of Economic Growth 7: 43–56.
Brittan, Samuel (1975). “The Economic Contradictions of Democracy,” British Journal of
Political Science 5: 129–60.
Brooks, Michael A. and Heijdra, Ben J. (1988). “In Search of Rent-Seeking,” in Charles K.
Rowley, Robert D. Tollison and Gordon Tullock (eds), The Political Economy of Rent-
Seeking. Boston, MA: Kluwer Academic.
Bueno de Mesquita, B., Morrow, J.D., Siverson, R. and Smith, A. (2001). “Political
Competition and Economic Growth,” Journal of Democracy 12: 58–72.
Drukker, D.M. (2003). “Testing for Serial Correlation in Linear Panel-Data Models,” The
Stata Journal (3)2: 1–10.
Evans, Peter (1995). Embedded Autonomy: States and Industrial Transformation. Princeton, NJ:
Princeton University Press.
134 International Political Science Review 27(2)
Friedrich, Robert J. (1982). “In Defense of Multiplicative Terms in Multiple Regression
Equations,” American Journal of Political Science 26: 797–833.
Fukuyama, Francis (1992). The End of History and the Last Man. New York: Free Press.
Hadri, Kaddour (2000). “Testing for Stationarity in Heterogeneous Panel Data,” The
Econometrics Journal 3: 148–61.
Haggard, Stephan D. (1990). Pathways from the Periphery: The Politics of Growth in the Newly
Industrializing Countries. New York: Cornell University Press.
Helliwell, John F. (1994). “Empirical Linkages Between Democracy and Economic Growth,”
British Journal of Political Science 24: 225–48.
Huntington, Samuel P. (1968). Political Order in Changing Societies. New Haven, CT: Yale
University Press.
Huntington, Samuel P. and Nelson, Joan M. (1976). No Easy Choice: Political Participation in
Developing Countries. Cambridge, MA: Harvard University Press.
Im, K.S., Hashem Pesaran, M. and Shin, Y. (1997). “Testing for Unit Roots in
Heterogeneous Panels,” unpublished working paper, URL: />faculty/pesaran/lm.pdf. Cambridge: Department of Applied Economics, University of
Cambridge.
King, G., Keohane, R.O. and Verba, S. (1994). Designing Social Inquiry: Scientific Inference in
Qualitative Research. Princeton, NJ: Princeton University Press.
Knack, S. and Keefer, P. (1995). “Institutions and Economic Performance: Cross-Country
Tests using Alternative Institutional Measures,” Economics and Politics 7(3): 207–28.
Krueger, Anne O. (1974). “The Political Economy of the Rent-Seeking Society,” American
Economic Review 64: 291–303.
Kurzman, C., Werum, R. and Burkhart, R.E. (2002). “Democracy’s Effect on Economic
Growth: A Pooled Time-Series Analysis, 1951–1980,” Studies in Comparative International
Development 37: 3–33.
Lambsdorff, Johann Graf (1999). “The Transparency International Corruption Perceptions
Index 1999: Framework Document,” URL: www.transparency.org.
Leff, Nathaniel H. (1968). Economic Policy-Making and Development in Brazil, 1947–1964. New
York: Wiley.
Levin, Andrew and Lin, Chien-Fu (1993). “Unit Root Tests in Panel Data: New Results,”
Discussion Paper No. 93-56. San Diego: University of California at San Diego.
Lien, Da-Hsiang Donald (1990). “Corruption and Allocation Efficiency,” Journal of
Development Economics 33: 153–64.
Lipset, Seymour Martin (1959). “Some Social Requisites of Democracy,” American Political
Science Review 53: 69–105.
Lipset, Seymour Martin (1960). Political Man: The Social Bases of Politics. New York: Doubleday.
Marshall, Monty G. and Jaggers, Keith (2000). Polity IV Project: Political Regime Characteristics
and Transitions, 1800–1999, URL: />Mauro, Paolo (1995). “Corruption and Growth,” Quarterly Journal of Economics 110: 681–712.
Munck, G.L. and Verkuilen, J. (2002). “Conceptualizing and Measuring Democracy,”
Comparative Political Studies 35(1): 5–34.
North, Douglas (1990). Institutions, Institutional Change, and Economic Performance.
Cambridge: Cambridge University Press.
Nye, J.S. (1967). “Corruption and Political Development: A Cost-Benefit Analysis,” American
Political Science Review 61: 417–27.
Olson, Mancur (1982). The Rise and Decline of Nations: Economic Growth, Stagflation, and Social
Rigidities. New Haven, CT: Yale University Press.
Olson, Mancur (1993). “Dictatorship, Democracy, and Development,” American Political
Science Review 87: 567–76.
Przeworski, A. and Limongi, F. (1993). “Political Regimes and Economic Growth,” Journal of
Economic Perspectives 7: 51–69.
Przeworski, A., Alvarez, M.E., Cheibub, J.A. and Limongi, F. (2000). Democracy and
Development: Political Institutions and Well-Being in the World, 1950–1990. Cambridge:
Cambridge University Press.
DRURY/KRIECKHAUS/LUSZTIG: Corruption, Democracy, and Economic Growth 135
Rose-Ackerman, Susan (1996). “When is Corruption Harmful?” Working Paper.
Washington, DC: World Bank.
Sachs, Jeffrey and Warner, Andrew. M. (1997). “Sources of Slow Growth in African
Economies,” Journal of African Economies 6: 335–76.
Schmitter, Philippe C. and Karl, Terry Lynn (1991). “What Democracy Is . . . And Is Not,”
Journal of Democracy, summer 75–88.
Shleifer, Andrei and Vishny, Robert W. (1993). “Corruption,” Quarterly Journal of Economics
108: 599–617.
Sirowy, Larry and Inkeles, Alex (1990). “The Effects of Democracy on Economic Growth
and Inequality: A Review,” Studies in Comparative International Development 25: 126–57.
Tullock, Gordon (1967). “Welfare Costs of Tariffs, Monopolies and Theft,” Western Economic
Journal 5: 224–32.
Wade, Robert (1990). Governing the Market: Economic Theory and the Role of Government in East
Asian Industrialization. Princeton, NJ: Princeton University Press.
World Bank (2003). World Development Indicators 2003. Washington, DC: World Bank.
Wooldridge, J.M. (2002). Econometric Analysis of Cross Section and Panel Data. Cambridge, MA:
MIT Press.
Biographical Notes
A. COOPER DRURY is Assistant Professor of Political Science at the University of
Missouri, Columbia and conducts research on foreign policy and political
economy, and specifically on economic sanctions. He is the author of Economic
Sanctions and Presidential Decisions: Models of Political Rationality (2005). His most
recent articles appear in the Journal of Politics, Journal of Peace Research, and
International Studies Perspectives. A
DDRESS: Department of Political Science, University
of Missouri, Columbia, MO 65211–6030, USA [email: ].
JONATHAN KRIECKHAUS is Assistant Professor of Political Science at the University of
Missouri, Columbia and conducts research on the politics of economic growth. He
is the author of Dictating Development: How Europe Shaped the Global Periphery
(forthcoming). His work has also recently appeared in the British Journal of Political
Science and World Development. A
DDRESS: University of Missouri, Columbia, MO
65211–6030, USA [email: ].
MICHAEL LUSZTIC is Associate Professor of Political Science at Southern Methodist
University. He is author of two books, Risking Free Trade and The Limits of
Protectionism, as well as numerous articles in journals such as the Review of
International Political Economy, World Politics, Comparative Politics, and Publius.
A
DDRESS: Department of Political Science, Southern Methodist University, Dallas,
TX 75275, USA [email: ].
Acknowledgments. We thank Jay Dow, Doh Shin, and Melanie Taylor Drury for their helpful
comments on previous drafts of this article.
136 International Political Science Review 27(2)