Tài liệu Bài tập về Kinh tế vĩ mô bằng tiếng Anh - Chương 18 doc
Bạn đang xem bản rút gọn của tài liệu. Xem và tải ngay bản đầy đủ của tài liệu tại đây (131.49 KB, 22 trang )
Chapter 18: Externalities and Public Goods
278
CHAPTER 18
EXTERNALITIES AND PUBLIC GOODS
EXERCISES
1. A number of firms have located in the western portion of a town after single-family
residences took up the eastern portion. Each firm produces the same product and, in the
process, emits noxious fumes that adversely affect the residents of the community.
a. Why is there an externality created by the firms?
Noxious fumes created by firms enter the utility function of residents, and the
residents have no control over the quantity of the fumes. We can assume that the
fumes decrease the utility of the residents (i.e., they are a negative externality) and
lower property values.
b. Do you think that private bargaining can resolve the problem? Explain.
If the residents anticipated the location of the firms, housing prices should reflect
the disutility of the fumes; the externality would have been internalized by the
housing market in housing prices. If the noxious fumes were not anticipated,
private bargaining could resolve the problem of the externality only if there are a
relatively small number of parties (both firms and families) and property rights are
well specified. Private bargaining would rely on each family’s willingness to pay
for air quality, but truthful revelation might not be possible. All this will be
complicated by the adaptability of the production technology known to the firms
and the employment relations between the firms and families. It is unlikely that
private bargaining will resolve the problem.
Chapter 18: Externalities and Public Goods
279
c. How might the community determine the efficient level of air quality?
The community could determine the economically efficient level of air quality by
aggregating the families’ willingness to pay and equating it with the marginal cost
of pollution reduction. Both steps involve the acquisition of truthful information.
2. A computer programmer lobbies against copyrighting software, arguing that everyone
should benefit from innovative programs written for personal computers and that exposure
to a wide variety of computer programs will inspire young programmers to create even more
innovative programs. Considering the marginal social benefits possibly gained by this
proposal, do you agree with this position?
Computer software as information is a classic example of a public good. Since it
can be costlessly copied, the marginal cost of providing software to an additional
user is near zero. Therefore, software is nonrival. (The fixed costs of creating
software are high, but the variable costs are low.) Furthermore, it is expensive to
exclude consumers from copying and using software because copy protection
schemes are available only at high cost or high inconvenience to users. Therefore,
software is also nonexclusive. As both nonrival and nonexclusive, computer
software suffers the problems of public goods provision: the presence of free-riders
makes it difficult or impossible for markets to provide the efficient level of
software. Rather than regulating this market directly, the legal system guarantees
property rights to the creators of software. If copyright protection were not
enforced, it is likely that the software market would collapse, or that there would be
a significant decrease in the quantity of software developed and supplied, which
would reduce the marginal social benefits. Therefore, we do not agree with the
computer programmer.
Chapter 18: Externalities and Public Goods
280
3. Assume that scientific studies provide you with the following information concerning the
benefits and costs of sulfur dioxide emissions:
Benefits of abating (reducing) emissions: MB=500-20A
Costs of abating emissions: MC=200+5A
where A is the quantity abated in millions of tons and the benefits and costs are given in
dollars per ton.
a. What is the socially efficient level of emissions abatement?
To find the socially efficient level of emissions abatement, set marginal benefit
equal to marginal cost and solve for A:
500-20A=200+5A
A=12.
b. What are the marginal benefit and marginal cost of abatement at the socially efficient
level of abatement?
Plug A=12 into the marginal benefit and marginal cost functions to find the benefit
and cost:
MB=500-20(12)=260
MC=200+5(12)=260.
Chapter 18: Externalities and Public Goods
281
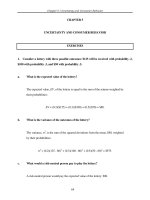
c. What happens to net social benefits (benefits minus costs) if you abate 1 million more
tons than the efficient level? 1 million fewer?
Net social benefits are the area under the marginal benefit curve minus the area
under the marginal cost curve. At the socially efficient level of abatement this is
equal to area a+b+c+d in Figure 18.3.c or
0.5(500-200)(12)=1800 million dollars.
If you abate 1 million more tons then the net social benefit is area a+b+c+d-e or
1800-0.5(265-240)(1)=1800-12.5=1787.5 million dollars.
If you abate 1 million less tons then the net social benefit is area a+b or
0.5(500-280)(11)+(280-255)(11)+0.5(255-200)(11)=1787.5 million dollars.
d. Why is it socially efficient to set marginal benefits equal to marginal costs rather than
abating until total benefits equal total costs?
It is socially efficient to set marginal benefit equal to marginal cost rather than total
benefit equal to total cost because we want to maximize net benefits, which are total
benefit minus total cost. Maximizing total benefit minus total cost means that at
the margin, the last unit abated will have an equal cost and benefit. Choosing the
point where total benefit is equal to total cost will result in too much abatement, and
would be analogous to choosing to produce where total revenue was equal to total
cost. If total revenue was always equal to total cost by choice, then there would
never be any profit. In the case of abatement, the more we abate, the costlier it is.
Given that funds will tend to be scarce, dollars should be allocated to abatement
Chapter 18: Externalities and Public Goods
only so long as the benefit of the last unit of abatement is greater than or equal to
the cost of the last unit of abatement.
$
A
25
13
12
11
500
MC
MB
a
b
c
d
e
Figure 18.3.c
4. Four firms located at different points on a river dump various quantities of effluent into
it. The effluent adversely affects the quality of swimming for homeowners who live
downstream. These people can build swimming pools to avoid swimming in the river, and
firms can purchase filters that eliminate harmful chemicals in the material dumped in the
river. As a policy advisor for a regional planning organization, how would you compare and
contrast the following options for dealing with the harmful effect of the effluent:
a. An equal-rate effluent fee on firms located on the river.
282
Chapter 18: Externalities and Public Goods
283
First, one needs to know the value to homeowners of swimming in the river. This
information can be difficult to obtain, because homeowners will have an incentive
to overstate this value. As an upper boundary, if there are no considerations
other than swimming, one could use the cost of building swimming pools, either a
pool for each homeowner or a public pool for all homeowners. Next, one needs to
know the marginal cost of abatement. If the abatement technology is well
understood, this information should be readily obtainable. If the abatement
technology is not understood, an estimate based on the firms’ knowledge must be
used.
The choice of a policy tool will depend on the marginal benefits and costs of
abatement. If firms are charged an equal-rate effluent fee, the firms will reduce
effluents to the point where the marginal cost of abatement is equal to the fee. If
this reduction is not high enough to permit swimming, the fee could be increased.
Alternatively, revenue from the fees could be used to provide swimming facilities,
reducing the need for effluent reduction.
b. An equal standard per firm on the level of effluent that each can dump.
Standards will be efficient only if the policy maker has complete information
regarding the marginal costs and benefits of abatement, so that the efficient level of
the standard can be determined. Moreover, the standard will not encourage firms
to reduce effluents further when new filtering technologies become available.
c. A transferable effluent permit system in which the aggregate level of effluent is fixed
and all firms receive identical permits.
A transferable effluent permit system requires the policy maker to determine the
efficient effluent standard. Once the permits are distributed and a market
develops, firms with a higher cost of abatement will purchase permits from firms
Chapter 18: Externalities and Public Goods
284
with lower abatement costs. However, unless permits are sold initially, rather than
merely distributed, no revenue will be generated for the regional organization.
5. Medical research has shown the negative health effects of “secondhand” smoke. Recent
social trends point to growing intolerance of smoking in public areas. If you are a smoker
and you wish to continue smoking despite tougher anti smoking laws, describe the effect of
the following legislative proposals on your behavior. As a result of these programs, do you,
the individual smoker, benefit? Does society benefit as a whole?
Since smoking in public areas is similar to polluting the air, the programs proposed
here are similar to those examined for air pollution. A bill to lower tar and
nicotine levels is similar to an emissions standard, and a tax on cigarettes is similar
to an emissions fee. Requiring a smoking permit is similar to a system of
emissions permits, assuming that the permits would not be transferable. The
individual smoker in all of these programs is being forced to internalize the
externality of “second-hand” smoke and will be worse off. Society will be better
off if the benefits of a particular proposal outweigh the cost of implementing that
proposal. Unfortunately, the benefits of reducing second-hand smoke are
uncertain, and assessing those benefits is costly.
a. A bill is proposed that would lower tar and nicotine levels in all cigarettes.
The smoker will most likely try to maintain a constant level of consumption of
nicotine, and will increase his or her consumption of cigarettes. Society may not
benefit from this plan if the total amount of tar and nicotine released into the air is
the same.
b. A tax is levied on each pack of cigarettes sold.
Chapter 18: Externalities and Public Goods
Smokers might turn to cigars, pipes, or might start rolling their own cigarettes.
The extent of the effect of a tax on cigarette consumption depends on the elasticity
of demand for cigarettes. Again, it is questionable whether society will benefit.
c. Smokers would be required to carry government issued smoking permits at all times.
Smoking permits would effectively transfer property rights to clean air from
smokers to non-smokers. The main obstacle to society benefiting from such a
proposal would be the high cost of enforcing a smoking permits system. In
addition, the cost of the permit raises the effective price of the cigarettes and the
resulting affect on quantity smoked will depend on the elasticity of demand.
6. The market for paper in a particular region in the United States is characterized by the
following demand and supply curves
Q
D
= 160,000 − 2000
P
and Q
S
=
40,000
+
2000
P
,
where
Q
D
is the quantity demanded of paper in 100 lb. lots, is the quantity demanded
of paper in 100 lb. lots, and P is the price per 100 lb. lot of paper. Currently there is no
attempt to regulate the dumping of effluent into streams and rivers by the paper mills. As
a result, dumping is widespread. The marginal external cost (MEC) associated with the
production of paper is given by the curve
Q
S
0.0006Q
S
.
M
EC
=
a. Calculate the output and price of paper if it is produced under competitive
conditions and no attempt is made to monitor or regulate the dumping of effluent.
285
Chapter 18: Externalities and Public Goods
The equilibrium price and output would be where quantity demand is equal to
quantity supplied:
160,000-2000P=40,000+2000P
4000P=120,000
P=$30 per 100 lb. lot
Q=100,000 lots of 100 lb. each.
b. Determine the socially efficient price and output of paper.
To find the socially efficient solution, we need to consider the external costs, as given by
EC = 0.0006Q = 40,000
S
, as well as the private costs, as given by
Q
S
M
2000
+
P
.
Rewriting the supply curve, the private costs are P=0.0005Q
S
-20=MC. Therefore,
MSC=MC+MEC=0.0005Q
S
-20+0.0006Q
S
MSC=0.0011Q
S
-20.
Setting the marginal social cost equal to the demand curve, or the marginal benefit,
0.0011Q-20=80-0.0005Q
Q=62,500 lots of 100 lb. each.
P=$48.75 per 100 lb. lot.
286
Chapter 18: Externalities and Public Goods
c. Explain clearly why the answers you calculated in parts a and b differ.
The equilibrium quantity declined and the equilibrium price rose in part b because
the external costs were considered. Ignoring some of the costs will result in too
much output being produced and sold at too low of a price.
7. In a market for dry cleaning, the inverse market demand function is given by
P
= 100 − Q
and the (private) marginal cost of production for the aggregation of all dry
cleaning firms is given by
MC
=10
+
Q
. Finally, the pollution generated by the dry
cleaning process creates external damages given by the marginal external cost curve
M
E
C
= Q
.
a. Calculate the output and price of dry cleaning if it is produced under competitive
conditions absent regulation.
To find the answer, set price equal to marginal cost:
100-Q=10+Q,
Q=45, and P=55.
b. Determine the socially efficient price and output of dry cleaning.
To find the answer here, we must first calculate the marginal social cost (MSC),
which is equal to the marginal external cost plus the private marginal cost. Next,
set MSC equal to the market demand function to solve for price and quantity.
When all costs are included, the quantity produced will fall and the price will rise:
MSC=MC+MEC=10+2Q=100-Q,
287
Chapter 18: Externalities and Public Goods
288
Q=30, and P=70.
c. Determine the tax that would result in a competitive market producing the socially
efficient output.
If there is a unit tax, then the new marginal private cost function is MC’=10+Q+tQ. If
we now set this new marginal cost function equal to the price of 70 and substitute in 30
for the quantity, we can solve for t:
10+Q+tQ=70
Q(1+t)=60
1+t=2
t=1.
The tax should be $1 per unit output. Note that with the tax equal to 1, the new private
cost function is the same as the marginal social cost function.
d. Calculate the output and price of dry cleaning if it is produced under monopolistic
conditions without regulation.
The monopolist will set marginal cost equal to marginal revenue. Recall that the
marginal revenue curve has a slope that is twice the slope of the demand curve so
MR=100-2Q=MC=10+Q. Therefore, Q=30 and P=70.
e. Determine the tax that would result in a monopolistic market producing the socially
efficient output.
Chapter 18: Externalities and Public Goods
289
The tax is equal to zero since the monopolist will produce at the socially efficient output
in this case.
f. Assuming that no attempt is made to monitor or regulate the pollution, which
market structure yields higher social welfare? Discuss.
In this case it is actually the monopolist that yields the higher level of social welfare over
the competitive market since the monopolist’s profit maximizing price and quantity are
the same as the socially efficient solution. Since a monopolist tends to produce less
output than the competitive equilibrium, it may end up producing closer to the social
equilibrium when a negative externality is present.
8. A beekeeper lives adjacent to an apple orchard. The orchard owner benefits from the
bees because each hive pollinates about one acre of apple trees. The orchard owner pays
nothing for this service, however, because the bees come to the orchard without his having to
do anything. Because there are not enough bees to pollinate the entire orchard, the orchard
owner must complete the pollination by artificial means, at a cost of $10 per acre of trees.
Beekeeping has a marginal cost of MC = 10 + 5Q, where Q is the number of beehives. Each
hive yields $40 worth of honey.
a. How many beehives will the beekeeper maintain?
The beekeeper maintains the number of hives that maximizes profits, when
marginal revenue is equal to marginal cost. With a constant marginal revenue of
$40 (there is no information that would lead us to believe that the beekeeper has any
market power) and a marginal cost of 10 + 5
Q:
40 = 10 + 5
Q, or Q = 6.
Chapter 18: Externalities and Public Goods
290
b. Is this the economically efficient number of hives?
If there are too few bees to pollinate the orchard, the farmer must pay $10 per acre
for artificial pollination. Thus, the farmer would be willing to pay up to $10 to the
beekeeper to maintain each additional hive. So, the marginal social benefit,
MSB,
of each additional hive is $50, which is greater than the marginal private benefit of
$40. Assuming that the private marginal cost is equal to the social marginal cost,
we set
MSB = MC to determine the efficient number of hives:
50 = 10 + 5
Q, or Q = 8.
Therefore, the beekeeper’s private choice of
Q = 6 is not the socially efficient
number of hives.
c. What changes would lead to the more efficient operation?
The most radical change that would lead to more efficient operations would be the
merger of the farmer’s business with the beekeeper’s business. This merger would
internalize the positive externality of bee pollination. Short of a merger, the
farmer and beekeeper should enter into a contract for pollination services.
Chapter 18: Externalities and Public Goods
291
9. There are three groups in a community. Their demand curves for public television in
hours of programming, T, are given respectively by
W
1
= $200 -T,
W
2
= $240 - T,
W
3
= $320 - 2T.
Suppose public television is a pure public good that can be produced at a constant marginal
cost of $200 per hour.
a. What is the efficient number of hours of public television?
The efficient number of hours is the amount such that the sum of the marginal
benefits is equal to marginal cost. Given the demand curves representing the
marginal benefits to each individual, we sum these demand curves vertically to
determine the sum of all marginal benefits. From the table below one can see that
MSB = MC at T = 140 hours of programming.
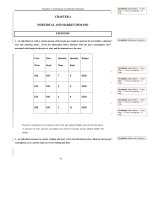
Willingness to Pay
Time Group 1 Group 2 Group 3 Vertical
Sum
100 100 140 120 360
Chapter 18: Externalities and Public Goods
292
120 80 120 80 280
140 60 100 40 200
160 40 80 0 120
180 20 60 0 80
b. How much public television would a competitive private market provide?
To find the number of hours that the private market would provide, we add the
individual demand curves horizontally. The efficient number of hours is such that
the private marginal cost is equal to the private marginal benefit. The demand
curve for group 1 lies below
MC = $200 for all T > 0. With marginal cost equal to
$200, only groups 2 and 3 would be willing to pay $200. At that price, 100 hours
of programming would be provided.
Quantity Demanded
Price Group 1 Group 2 Group 3 Horizontal
Sum
240 0 0 40 40
220 0 20 50 70
200 0 40 60 100
180 20 60 70 150
160 40 80 80 200
Chapter 18: Externalities and Public Goods
293
140 60 100 90 250
10. Reconsider the common resource problem as given by Example 18.5. Suppose that
crawfish popularity continues to increase, and that the demand curve shifts from C = 0.401 -
0.0064F to C = 0.50 - 0.0064F. How does this shift in demand affect the actual crawfish
catch, the efficient catch, and the social cost of common access? (Hint: Use the marginal
social cost and private cost curves given in the example.)
The relevant information is now the following:
Demand:
C = 0.50 - 0.0064F
MSC: C = -5.645 + 0.6509F.
With an increase in demand, the demand curve for crawfish shifts upward,
intersecting the price axis at $0.50. The private cost curve has a positive slope, so
additional effort must be made to increase the catch. Since the social cost curve
has a positive slope, the socially efficient catch also increases. We may determine
the socially efficient catch by solving the following two equations simultaneously:
0.50 - 0.0064
F = -5.645 + 0.6509F, or F
*
= 9.35.
To determine the price that consumers are willing to pay for this quantity, substitute
F* into the equation for marginal social cost and solve for C:
C = -5.645 + (0.6509)(9.35), or C = $0.44.
Next, find the actual level of production by solving these equations simultaneously:
Chapter 18: Externalities and Public Goods
294
Demand: C = 0.50 - 0.0064F
MPC: C = -0.357 + 0.0573F
0.50 - 0.0064F = -0.357 + 0.0573F, or F
**
= 13.45.
To determine the price that consumers are willing to pay for this quantity, substitute
F** into the equation for marginal private cost and solve for C:
C = -0.357 + (0.0573)(13.45), or C = $0.41.
Notice that the marginal social cost of producing 13.45 units is
MSC = -5.645 +(0.6509)(13.45) = $3.11.
With the increase in demand, the social cost is the area of a triangle with a base of
4.1 million pounds (13.45 - 9.35) and a height of $2.70 ($3.11 - 0.41), or $5,535,000
more than the social cost of the original demand.
11. The Georges Bank, a highly productive fishing area off New England, can be divided
into two zones in terms of fish population. Zone 1 has the higher population per square mile
but is subject to severe diminishing returns to fishing effort. The daily fish catch (in tons) in
Zone 1 is
F
1
= 200(X
1
) - 2(X
1
)
2
Chapter 18: Externalities and Public Goods
where X
1
is the number of boats fishing there. Zone 2 has fewer fish per mile but is larger,
and diminishing returns are less of a problem. Its daily fish catch is
F
2
= 100(X
2
) - (X
2
)
2
where X
2
is the number of boats fishing in Zone 2. The marginal fish catch MFC in each
zone can be represented as
MFC
1
= 200 - 4(X
1
) MFC
2
= 100 - 2(X
2
).
There are 100 boats now licensed by the U.S. government to fish in these two zones. The fish
are sold at $100 per ton. Total cost (capital and operating) per boat is constant at $1,000 per
day. Answer the following questions about this situation:
a. If the boats are allowed to fish where they want, with no government restriction, how
many will fish in each zone? What will be the gross value of the catch?
Without restrictions, the boats will divide themselves so that the average catch (
AF
1
and
AF
2
) for each boat is equal in each zone. (If the average catch in one zone is
greater than in the other, boats will leave the zone with the lower catch for the zone
with the higher catch.) We solve the following set of equations:
AF
1
= AF
2
and X
1
+ X
2
= 100 where
1
11
2
1
1
200 2
200 2
AF
XX
X
X=
−
=−
and
295
Chapter 18: Externalities and Public Goods
2
22
2
2
2
100
100
AF
XX
X
X=
−
=−.
Therefore,
AF
1
= AF
2
implies
200 - 2
X
1
= 100 - X
2
,
200 - 2(100 - X
2
) = 100 - X
2
, or X
2
100
3
=
and
X
1
= 100−
100
3
⎛
⎝
⎞
⎠
=
200
3
.
Find the gross catch by substituting the value of
X
1
and X
2
into the catch equations:
1F
= 200
()
200
3
⎛
⎝
⎞
⎠
− 2
()
200
3
⎛
⎝
⎞
⎠
2
=13,333 − 8,889 = 4,444,
and
2F
= 100
()
100
3
⎛
⎝
⎞
⎠
−
100
3
⎛
⎝
⎞
⎠
2
= 3,333 −1,111 = 2,222.
The total catch is
F
1
+ F
2
= 6,666. At the price of $100 per ton, the value of the
catch is $666,600. The average catch for each of the 100 boats in the fishing fleet
is 66.66 tons.
To determine the profit per boat, subtract total cost from total revenue:
π = (100)(66.66) - 1,000, or π = $5,666.
296
Chapter 18: Externalities and Public Goods
297
Total profit for the fleet is $566,600.
b. If the U.S. government can restrict the boats, how many should be allocated to each
zone? What will be the gross value of the catch? Assume the total number of boats
remains at 100.
Assume that the government wishes to maximize the net social value of the fish
catch, i.e., the difference between the total social benefit and the total social cost.
The government equates the marginal fish catch in both zones, subject to the
restriction that the number of boats equals 100:
MFC
1
= MFC
2
and X
1
+ X
2
= 100,
MFC
1
= 200 - 4X
1
and MFC
2
= 100 - 2X
2
.
Setting
MFC
1
= MFC
2
implies:
200 - 4
X
1
= 100 - 2X
2
, or 200 - 4(100 - X
2
) = 100 - 2X
2
, or X
2
= 50 and
X
1
= 100 - 50 = 50.
Find the gross catch by substituting
X
1
and X
2
into the catch equations:
F
1
= (200)(50) - (2)(50
2
) = 10,000 - 5,000 = 5,000 and
F
2
= (100)(50) - 50
2
= 5,000 - 2,500 = 2,500.
Chapter 18: Externalities and Public Goods
The total catch is equal to F
1
+ F
2
= 7,500. At the market price of $100 per ton,
the value of the catch is $750,000. Total profit is $650,000. Notice that the
profits are not evenly divided between boats in the two zones. The average catch
in Zone A is 100 tons per boat, while the average catch in Zone B is 50 tons per
boat. Therefore, fishing in Zone A yields a higher profit for the individual owner
of the boat.
c. If additional fishermen want to buy boats and join the fishing fleet, should a
government wishing to maximize the net value of the catch grant them licenses?
Why or why not?
To answer this question, first determine the profit-maximizing number of boats in
each zone. Profits in Zone A are
π
A
= 100()200X
1
− 2X
1
2
()
−1,000X, or
π
A
= 19,000X
1
− 200X
1
2
.
To determine the change in profit with a change in
X
1
take the first derivative of the
profit function with respect to
X
1
:
d
dX
X
A
π
1
1
19 000 400=−, .
To determine the profit-maximizing level of output, set
d
dX
A
π
1
equal to zero and
solve for
X
1
:
19,000 - 400
X
1
= 0, or X
1
= 47.5.
Substituting
X
1
into the profit equation for Zone A gives:
298
Chapter 18: Externalities and Public Goods
π
A
= 100()200()47.5()− 2
(
) 47.5
2
(
)()
− 1,000
(
) 47.5
(
)= $451,250.
For Zone B follow a similar procedure. Profits in Zone B are
π
B
= 100()100X
2
− X
2
2
()
−1,000X
2
, or
π
B
= 9,000X
2
−100X
2
2
.
Taking the derivative of the profit function with respect to
X
2
gives
d
dX
X
B
π
2
2
9 000 200=−, .
Setting
d
dX
B
π
2
equal to zero to find the profit-maximizing level of output gives
9,000 - 200
X
2
= 0, or X
2
= 45.
Substituting
X
2
into the profit equation for Zone B gives:
π
B
= (100)((100)(45) - 45 ) - (1,000)(45) = $202,500.
B
2
Total profit from both zones is $653,750, with 47.5 boats in Zone A and 45 boats in
Zone B. Because each additional boat above 92.5 decreases total profit, the
government should not grant any more licenses.
299