Tài liệu Câu hỏi đánh giá môn Kinh tế vĩ mô bằng tiếng Anh- Chương 2 pdf
Bạn đang xem bản rút gọn của tài liệu. Xem và tải ngay bản đầy đủ của tài liệu tại đây (71.09 KB, 7 trang )
Chapter 2: The Basics of Supply and Demand
CHAPTER 2
THE BASICS OF SUPPLY AND DEMAND
QUESTIONS FOR REVIEW
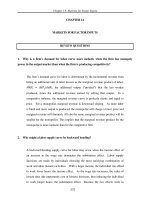
1. Suppose that unusually hot weather causes the demand curve for ice cream to shift to the
right. Why will the price of ice cream rise to a new market-clearing level?
Assume the supply curve is fixed. The unusually hot weather will cause a
rightward shift in the demand curve, creating short-run excess demand at the current
price. Consumers will begin to bid against each other for the ice cream, putting
upward pressure on the price. The price of ice cream will rise until the quantity
demanded and the quantity supplied are equal.
D
1
D
2
P
1
P
2
S
Price
Quantity of Ice Cream
Q
1
= Q
2
Figure 2.1
2. Use supply and demand curves to illustrate how each of the following events would affect
the price of butter and the quantity of butter bought and sold:
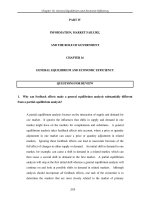
a. An increase in the price of margarine.
Most people consider butter and margarine to be substitute goods. An increase in
the price of margarine will cause people to increase their consumption of butter,
thereby shifting the demand curve for butter out from D
1
to D
2
in Figure 2.2.a.
This shift in demand will cause the equilibrium price to rise from P
1
to P
2
and the
equilibrium quantity to increase from Q
1
to Q
2
.
5
Chapter 2: The Basics of Supply and Demand
D
1
D
2
P
1
P
2
S
Price
Quantity of Butter
Q
1
Q
2
Figure 2.2.a
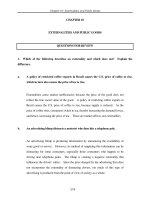
b. An increase in the price of milk.
Milk is the main ingredient in butter. An increase in the price of milk will increase
the cost of producing butter. The supply curve for butter will shift from S
1
to S
2
in
Figure 2.2.b, resulting in a higher equilibrium price, P
2
, covering the higher
production costs, and a lower equilibrium quantity, Q
2
.
6
D
P
1
P
2
S
2
Price
Quantity of Butter
Q
1
Q
2
S
1
Figure 2.2.b
Note: Given that butter is in fact made from the fat that is skimmed off of the
milk, butter and milk are joint products. If you are aware of this relationship, then
your answer will change. In this case, as the price of milk increases, so does the
quantity supplied. As the quantity supplied of milk increases, there is a larger
supply of fat available to make butter. This will shift the supply of butter curve
to the right and the price of butter will fall.
Chapter 2: The Basics of Supply and Demand
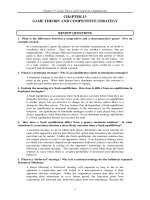
c. A decrease in average income levels.
Assume that butter is a normal good. A decrease in the average income level will
cause the demand curve for butter to shift from D
1
to D
2.
This will result in a decline
in the equilibrium price from P
1
to P
2
, and a decline in the equilibrium quantity
from Q
1
to Q
2
. See Figure 2.2.c.
D
1
P
1
P
2
S
Price
Quantity of Butter
Q
1
Q
2
D
2
Figure 2.2.c
3. If a 3-percent increase in the price of corn flakes causes a 6-percent decline in the
quantity demanded, what is the elasticity of demand?
The elasticity of demand is the percentage change in the quantity demanded divided
by the percentage change in the price. The elasticity of demand for corn flakes is
−
+
=−
6
3
2
. This is equivalent to saying that a 1% increase in price leads to a 2%
decrease in quantity demanded. This is in the elastic region of the demand curve,
where the elasticity of demand exceeds -1.0.
4. Explain the difference between a shift in the supply curve and a movement along
the supply curve.
A movement along the supply curve is caused by a change in the price or the
quantity of the good, since these are the variables on the axes. A shift of the
supply curve is caused by any other relevant variable that causes a change in the
quantity supplied at any given price. Some examples are changes in production
costs and an increase in the number of firms supplying the product.
5. Explain why for many goods, the long-run price elasticity of supply is larger than the
short-run elasticity.
The elasticity of supply is the percentage change in the quantity supplied divided by
the percentage change in price. An increase in price induces an increase in the
quantity supplied by firms. Some firms in some markets may respond quickly and
cheaply to price changes. However, other firms may be constrained by their
production capacity in the short run. The firms with short-run capacity constraints
will have a short-run supply elasticity that is less elastic. However, in the long run
7
Chapter 2: The Basics of Supply and Demand
8
all firms can increase their scale of production and thus have a larger long-run price
elasticity.
6. Why do long-run elasticities of demand differ from short-run elasticities? Consider two
goods: paper towels and televisions. Which is a durable good? Would you expect the price
elasticity of demand for paper towels to be larger in the short-run or in the long-run? Why?
What about the price elasticity of demand for televisions?
Long-run and short-run elasticities differ based on how rapidly consumers respond
to price changes and how many substitutes are available. If the price of paper
towels, a non-durable good, were to increase, consumers might react only
minimally in the short run. In the long run, however, demand for paper towels
would be more elastic as new substitutes entered the market (such as sponges or
kitchen towels). In contrast, the quantity demanded of durable goods, such as
televisions, might change dramatically in the short run following a price change.
For example, the initial result of a price increase for televisions would cause
consumers to delay purchases because durable goods are built to last longer.
Eventually consumers must replace their televisions as they wear out or become
obsolete, and therefore, we expect the demand for durables to be more inelastic in
the long run.
7. Are the following statements true or false? Explain your answer.
a. The elasticity of demand is the same as the slope of the demand curve.
False. Elasticity of demand is the percentage change in quantity demanded for a
given percentage change in the price of the product. The slope of the demand
curve is the change in price for a given change in quantity demanded, measured in
units of output. Though similar in definition, the units for each measure are
different.
b. The cross price elasticity will always be positive.
False. The cross price elasticity measures the percentage change in the quantity
demanded of one product for a given percentage change in the price of another
product. This elasticity will be positive for substitutes (an increase in the price of
hot dogs is likely to cause an increase in the quantity demanded of hamburgers) and
negative for complements (an increase in the price of hot dogs is likely to cause a
decrease in the quantity demanded of hot dog buns).
c. The supply of apartments is more inelastic in the short run than the long run.
True. In the short run it is difficult to change the supply of apartments in response
to a change in price. Increasing the supply requires constructing new apartment
buildings, which can take a year or more. Since apartments are a durable good, in
the long run a change in price will induce suppliers to create more apartments (if
price increases) or delay construction (if price decreases).
8. Suppose the government regulates the prices of beef and chicken and sets them below
their market-clearing levels. Explain why shortages of these goods will develop and what
Chapter 2: The Basics of Supply and Demand
9
factors will determine the sizes of the shortages. What will happen to the price of pork?
Explain briefly.
If the price of a commodity is set below its market-clearing level, the quantity that
firms are willing to supply is less than the quantity that consumers wish to purchase.
The extent of the excess demand implied by this response will depend on the
relative elasticities of demand and supply. For instance, if both supply and
demand are elastic, the shortage is larger than if both are inelastic. Factors such as
the willingness of consumers to eat less meat and the ability of farmers to change
the size of their herds and hence produce less will determine these elasticities and
influence the size of excess demand. Customers whose demands are not met will
attempt to purchase substitutes, thus increasing the demand for substitutes and
raising their prices. If the prices of beef and chicken are set below market-clearing
levels, the price of pork will rise, assuming that pork is a substitute for beef and
chicken.
9. The city council of a small college town decides to regulate rents in order to reduce
student living expenses. Suppose the average annual market-clearing rent for a two-
bedroom apartment had been $700 per month, and rents are expected to increase to $900
within a year. The city council limits rents to their current $700 per month level.
a. Draw a supply and demand graph to illustrate what will happen to the rental price
of an apartment after the imposition of rent controls.
The rental price will stay at the old equilibrium level of $700 per month. The
expected increase to $900 per month may have been caused by an increase in
demand. Given this is true, the price of $700 will be below the new equilibrium
and there will be a shortage of apartments.
b. Do you think this policy will benefit all students? Why or why not.
It will benefit those students who get an apartment, though these students may
also find that the costs of searching for an apartment are higher given the shortage
of apartments. Those students who do not get an apartment may face higher
costs as a result of having to live outside of the college town. Their rent may be
higher and the transportation costs will be higher.
10. In a discussion of tuition rates, a university official argues that the demand for
admission is completely price inelastic. As evidence she notes that while the university has
doubled its tuition (in real terms) over the past 15 years, neither the number nor quality of
students applying has decreased. Would you accept this argument? Explain briefly.
(Hint: The official makes an assertion about the demand for admission, but does she actually
observe a demand curve? What else could be going on?)
If demand is fixed, the individual firm (a university) may determine the shape of the
demand curve it faces by raising the price and observing the change in quantity
sold. The university official is not observing the entire demand curve, but rather
only the equilibrium price and quantity over the last 15 years. If demand is
shifting upward, as supply shifts upward, demand could have any elasticity. (See
Figure 2.7, for example.) Demand could be shifting upward because the value of a
college education has increased and students are willing to pay a high price for each
Chapter 2: The Basics of Supply and Demand
opening. More market research would be required to support the conclusion that
demand is completely price inelastic.
S
1976
Price
Quantity
S
1986
S
1996
D
1996
D
1986
D
1976
Figure 2.10
11. Suppose the demand curve for a product is given by Q=10-2P+P
s
, where P is the price of
the product and P
s
is the price of a substitute good. The price of the substitute good is $2.00.
a. Suppose P=$1.00. What is the price elasticity of demand? What is the cross-price
elasticity of demand?
First you need to find the quantity demanded at the price of $1.00. Q=10-
2(1)+2=10. Price elasticity of demand =
P
Q
Δ
Q
ΔP
=
1
10
(−2) =−
2
10
=−0.2.
Cross-price elasticity of demand =
P
s
Q
Δ
Q
ΔP
s
=
2
10
(1) = 0.2.
b. Suppose the price of the good, P, goes to $2.00. Now what is the price elasticity of
demand? What is the cross-price elasticity of demand?
First you need to find the quantity demanded at the price of $2.00. Q=10-
2(2)+2=8.
Price elasticity of demand =
P
Q
Δ
Q
ΔP
=
2
8
(−2) =−
4
8
=−0.5.
Cross-price elasticity of demand =
P
s
Q
Δ
Q
ΔP
s
=
2
8
(1) = 0.25.
12. Suppose that rather than the declining demand assumed in Example 2.8, a decrease in the
cost of copper production causes the supply curve to shift to the right by 40 percent. How
will the price of copper change?
10
Chapter 2: The Basics of Supply and Demand
11
If the supply curve shifts to the right by 40% then the new quantity supplied will be
140 percent of the old quantity supplied at every price. The new supply curve is
therefore
Q’ = 1.4*(-4.5+16P) = -6.3+22.4P. To find the new equilibrium price of copper,
set the new supply equal to demand so that –6.3+22.4P=13.5-8P. Solving for price
results in P=65 cents per pound for the new equilibrium price. The price decreased
by 10 cents per pound, or 13.3%.
13. Suppose the demand for natural gas is perfectly inelastic. What would be the effect, if
any, of natural gas price controls?
If the demand for natural gas is perfectly inelastic, then the demand curve is
vertical. Consumers will demand a certain quantity and will pay any price for this
quantity. In this case, a price control will have no effect on the quantity
demanded.