Comparison of quality of life and nutritional status in gastric cancer patients undergoing gastrectomies
Bạn đang xem bản rút gọn của tài liệu. Xem và tải ngay bản đầy đủ của tài liệu tại đây (725.35 KB, 7 trang )
Original Article
Clin Nutr Res 2015;4:153-159
/>pISSN 2287-3732 ∙ eISSN 2287-3740
Comparison of Quality of Life and Nutritional Status in
Gastric Cancer Patients Undergoing Gastrectomies
Hee-Sook Lim1,2, Gyu-Seok Cho3, Yoon-Hyung Park2, Soon-Kyung Kim4*
1
Department of Clinical Nutrition, Soonchunhyang University Bucheon Hospital, Bucheon 420-767, Korea
Department of Preventive Medicine, Soonchunhyang University College of Medicine, Cheonan 330-930, Korea
3
Department of Surgery, Soonchunhyang University Bucheon Hospital, Bucheon 420-767, Korea
4
Department of Food Science & Nutrition, Soonchunhyang University, Asan 336-745, Korea
2
The aim of this study was to compare the quality of life (QoL) depending on the postoperative survival period or nutritional
status in gastric cancer patients. Surviving gastric cancer patients (n = 222) after the gastrectomy were included in the study
at Soonchunhyang University Bucheon Hospital from April 2010 to August 2012. The Korean versions of the European Organization for Research and Treatment of Cancer (EORTC) Quality of Life Questionnaire Core 30 (QLQ-C30) and a gastric cancerspecific module, the EORTC QLQ-STO22, were used to assess the QoL. The postoperative survival period of the patients fell
into two groups; the less-than-1-year group or the more-than-1-year group, and the nutritional status of the patients fell into
three groups by a score of patient generated-subjective global assessment (SGA)-A, B, and C. As a result, the rate of malnutrition was 34.5% in the less-than-1-year group and 19.8% in the more-than-1-year group, respectively. Score for the fatigue
(p = 0.006), loss of appetite (p = 0.002), reflux (p = 0.027) and body image (p = 0.004) in which the QoL was significantly
lower in the less-than-1-year group than in the more-than-1-year group. The score of QoL according to the nutritional status
of all subjects, overall health status (p = 0.043), physical functioning (p = 0.016), fatigue (p = 0.006), pain (p = 0.028), loss of
appetite (p = 0.017), reflux (p = 0.003), eating restriction (p = 0.002), anxiety (p = 0.010), and body image (p = 0.001) was significantly lower in the SGA-C group than in other SGA groups. These results suggest that the nutritional status of the gastrectomy patients with stomach cancer may impact on their QoL. It is necessary to to develop nutritional intervention to improve
QoL in gastric cancer patients with postoperative malnutrition.
Key Words: Stomach neoplasms, Gastrectomy, Nutritional status, Quality of life
*Corresponding author Soon-Kyung Kim
Address Department of Food Science & Nutrition, Soonchunhyang
University, 22 Soonchunhyang-ro, Sinchang-myeon, Asan 336-745,
Korea
Tel +82-41-530-1261 Fax +82-41-530-1264
Received June 20, 2015
Revised July 10, 2015
Accepted July 23, 2015
© 2015 The Korean Society of Clinical Nutrition
This is an Open Access article distributed under the terms of the Creative Commons
Attribution Non-Commercial License ( />which permits unrestricted non-commercial use, distribution, and reproduction in any
medium, provided the original work is properly cited.
Introduction
Cancer negatively affects the quality of life (QoL) owing to the disease itself but also adverse effects of cancer
therapy and the possibility of relapse. The best treatment for
gastric cancer is determined by the survival rate and the QoL
in patient after the treatment. Therefore, many studies have
continued to evaluate the QoL in cancer patients [1]. Gastric
cancer is the second most common cancer in Korea and the
first among Koream men [2]. From an early stage of cancer
development, gastric cancer patients experience malnutrition
and weight loss mainly due to loss of appetite and decrease
in bowel function. In addition, there are considerable changes
in the physical symptoms and emotional status depending
on the timing and the method of the treatment. Since these
153
Lim HS et al.
conditions greatly affects the QoL, the demands on shortand long- term QoL assessment is getting increased [3]. In
fact, studies on the QoL of Korean gastric patients have been
conducted according to the type of reconstruction surgery,
resection extent, and the status of long-term survival [4-6].
These studies have demonstrated that enhanced level of QoL
with increasing survival rate of cancer patients was closely related with the treatment methods or conditions. Cancer recurrence is different for each type of cancer. Usually recurrence
of gastric cancer is confirmed one year after surgery. On the
other hand, the malnutrition rate in patients after gastrectomy
is still high and several problems co-exist, including dumping
syndrome, anemia, and nutrient malabsorption.
Therefore, it is very important to devlop a method to identify the malnutrition early and to improve nutritional status
because it is directly linked to patient symptoms and the QoL
[7]. However, studies that simultaneously assess the nutritional
status and QoL are limited in Korea. Therefore, we conducted
this study to help improve the QoL of gastric cancer patients
by investigating the malnutrition rate of gastric cancer patients through the evaluation of nutritional status and the
QoL, and to determine whether the QoL is different in gastric
cancer patients depending on the postoperative survival period or nutritional status.
Materials and Methods
The subjects were 222 gastric cancer survivors who underwent gastrectomy at the Surgery Department of Soonchunhyang University Hospital, and had no evidence of relapse and
no disease in other organs. The goal of the study was thoroughly explained to the patients, who then signed the consent
form. The results were obtained through one-on-one interviews. Clinicopathological factors including disease stage, surgical methods, extent of resection, and chemotherapy status
were investigated by using the medical records, and the nutritional status was evaluated by the score of patient generatedsubjective global assessment (PG-SGA), which the attending
dietitian of the gastric cancer surgical team commonly uses
for cancer patients. Using the evaluation score, the nutritional
status was divided into three stages (SGA-A: well nourished,
SGA-B: moderate malnutrition, SGA-C: severe malnutrition).
Korean versions of the European Organization for Research
and Treatment of Cancer Core Questionnaire (EORTC) QLQC30 and the EORTC QLQ-STO22, corresponding to the gastric
cancer module, were used to evaluate the QoL. The score was
154
calculated by investigating 15 scales from the EORTC QLQ-C30
and 9 scales from the EORTC QLQ-STO22. In the EORTC QLQC30, the QoL is higher when the general health and functional
scale score is higher, and the QOL is lower when the symptom
scale score is higher. In the EORTC QLQ-STO22, the QoL is lower when the score of each category is higher. In this study, the
postoperative survival period was divided into two groups (the
less-than-1-year group and the more-than-1-year group) and
the nutritional status into three groups (SGA-A, B, and C), and
each indicator was analyzed comparatively. Statistical analysis
for all data collected from the investigation were performed
by using the SPSS program (ver. 18.0, SPSS Inc., Chicago, IL,
USA). The Soonchunhyang University Medical School IRB approved the study protocol. The general information of the
patients was presented as means and standard deviation, and
the postoperative malnutrition rate was analyzed by using the
chi-square test. Analysis of covariance (ANCOVA), adjusted for
gender and follow up duration, was conducted for comparison
of QoL between groups according to postoperative elapsed
time period. Among the groups divided by the nutritional
status, the differences of QoL were also tested by ANCOVA
adjusted for extent of gastric resection which showed the
significant differences. Then, post hoc comparison was performed among groups of different nutritional status. For all
analyses, p < 0.05 was considered statistically significant.
Results
Clinical characteristics
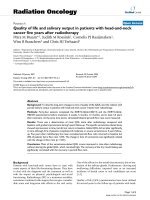
A total of 222 patients participated in the study; the mean
age was 54.9, with 68.9% men and 31.1% women. A group of
the less-than-1-year of post-operation, with a mean survival
duration of 8.6 month, had 116 (52.3%) patients, and a group
of the more-than-1-year of post-operation, with a mean
survival duration of 18.4 months, had 106 (47.7%) patients.
When the final disease stage was classified according to the
6th Union for International Cancer Control (UICC), 120 (54.1%)
patients had stage I and II while 102 (45.9%) patients had
stage III and IV, showing no significant difference between the
two groups. In terms of the surgical methods, 153 (68.9%)
underwent laparoscopic surgery and 69 (31.1%) underwent
laparotomy. Considering the resection extent, 168 (75.7%)
received subtotal gastrectomy and 54 (24.3%) received total
gastrectomy; adjuvant chemotherapy was administered to 78
patients (35.1%), and there was no significant difference in the
distribution between the two groups (Table 1).
/>
Quality of Life after Gastrectomy
Table 1. Clinicopathologic data according to the period of postoperative survival
Age, years
Total
(n = 222)
Less-than-1-year
group
(n = 116)
More-than-1-year
group
(n = 106)
p value
54.9 ± 13.8*
55.5 ± 12.8
55.3 ± 11.6
0.461
153 (68.9)†
72 (62.1)
81 (76.4)
0.029
69 (31.1)
44 (37.9)
25 (23.6)
69 (31.1)
32 (27.6)
37 (34.9)
Gender
Male
Female
Stage
I
II
51 (23.0)
29 (25.0)
22 (20.8)
III
92 (41.4)
49 (42.2)
43 (40.6)
IV
10 (4.5)
6 (5.2)
4 (3.8)
Open
69 (31.1)
37 (31.9)
32 (30.2)
Laparo
153 (69.8)
79 (68.1)
74 (69.8)
54 (24.3)
27 (23.3)
27 (25.5)
168 (75.7)
89 (76.7)
79 (74.5)
Yes
78 (35.1)
40 (34.5)
38 (35.8)
No
144 (64.9)
76 (65.5)
68 (64.2)
13.5 ± 5.8
8.6 ± 3.8
0.452
Operation method
0.885
Extent of gastric resection
Total
Subtotal
0.755
Chemotherapy
Follow up duration (month)
18.4 ± 6.1
0.888
< 0.001
*Mean ± standard deviation; †Number (%).
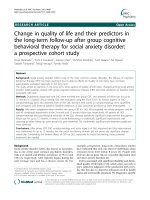
Malnutrition rate
When indicators of nutritional status were compared between two groups of postoperative survival period, there was
no difference in the serum albumin and hemoglobin levels,
since these indicators were within the normal range in patient
of both groups. The serum albumin level was significantly
different after the surgery between two groups. The mean
weight loss was 5.1% in the less-than-1-year group and 3.3%
in the more-than-1-year group, and the difference was significant (p < 0.001). The pre-operative malnutrition rate for all
subjects was 4.5%. After surgery, the rate of moderate malnutrition and the rate of severe malnutrition was 25.9% and
8.6% in the less-than-1-year group and 17.0% and 2.8% in
the more-than-1-year group, respectively; thus, the malnutrition rate was significantly higher in the less-than-1-year group
(p < 0.05) (Table 2).
QoL according to the period of postoperative survival
The overall health status considering the EORTC QLQ-C30
was lower in the less-than-1-year group, but the difference
/>
between two groups was not significant. When the 15 functional scales were compared, although the QoL considering
the physical, emotional, congnitive and social function categories was lower in the less-than-1-year group than in the
more-than-10year group, the difference between two groups
was not significant. In the 9 categories pertaining to symptom
scales, the QoL considering fatigue, pain, sleep disorder, loss
of appetite, diarrhea and finalcial difficulties was lower in the
less-than-1-year group but the mean scores for nausea and
vomiting were the same. On the other hand, the QoL considering the dyspnea was higher in the less-than-1-year group than
in the more-than-10year group. Among those symptoms, the
symptoms that reached statistical significance were fatigue
(p < 0.01) and loss of appetite (p < 0.01), in which the QoL
was significantly lower in the less-than-1-year group. The QoL
considering all the 9 categories of the QLQ-STO22 was lower
in the less-than-1-year group, but the result was significant
for only two categories of reflux (p < 0.05) and body image
(p < 0.01) (Table 3).
155
Lim HS et al.
Table 2. Comparison of nutritional status according to the period of postoperative survival
Albumin, g/dL
Hemoglobin, g/dL
Preoperative
Total
(n = 222)
4.3 ± 0.4*
Current
4.3 ± 0.4
0.932
4.2 ± 0.5
4.1 ± 0.5
4.3 ± 0.5
0.009
Preoperative
13.1 ± 2.1
13.2 ± 2.1
13.0 ± 2.2
0.818
Current
13.3 ± 2.3
13.1 ± 2.7
13.5 ± 1.8
0.118
4.4 ± 2.9
5.1 ± 3.4
3.3 ± 2.4
< 0.001
1.2 ± 0.9
0.8 ± 0.6
< 0.001
2
1.0 ± 0.9
BMI gap, kg/m
Current SGA grade
p value
4.3 ± 0.4
Weight loss change, %
Preoperative SGA grade
Less-than-1-year group More-than-1-year group
(n = 116)
(n = 106)
†
A
212 (95.5)
112 (96.6)
100 (94.3)
B
10 (4.5)
4 (3.4)
6 (5.7)
C
0 (0.0)
0 (0.0)
0 (0.0)
A
161 (72.5)
76 (65.5)
85 (80.2)
B
48 (21.6)
30 (25.9)
18 (17.0)
C
13 (5.9)
10 (8.6)
3 (2.8)
0.438
0.033
BMI: body mass index, SGA: subjective global assessment.
*Mean ± standard deviation; †Number (%).
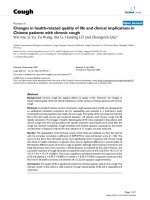
QoL according to the postoperative nutritional status
When we compared the QoL according to the nutritional
status of all subjects, the overall health status was the highest
for the well-nourished group (SGA-A) (p < 0.05). In terms of
the functional scales, the QoL of the SGA-A and SGA-B groups
was higher than that of the SGA-C group in the physical
funtioning (p < 0.05). Regarding the symptom scales, the QoL
was significantly lower in the SGA-C group than in the SGAA group for considering the categories of fatigue (p < 0.01)
and pain (p < 0.05), and the QoL was significantly lower in the
SGA-C group than in the other two groups for considering
the category of loss of appetite (p < 0.05). Considering most
categories of the QLQ-STO22, SGA-C group has significantly
lower QoL for reflux (p < 0.01), eating restriction (p < 0.01),
anxiety (p < 0.05), and body image (p < 0.01) (Table 4).
Discussion
The results from QoL studies in gastric cancer patients are
diverse [4,8,9]. In studies of the QoL according to resection
extent, patients who underwent partial resection showed a
significant difference in the overall health status at 3 months
after the surgery compared to the patients who underwent
total resection [4]. In addition, the QoL was reported to be
lower in patients whose diagnosed disease stage was higher
and who underwent total resection [8], and the QoL was
156
higher in patients who underwent laparoscopic surgery than
in patients who underwent laparotomy [9]. In this study, when
the QoL categories were evaluated according to the postoperative survival period, a significant difference was observed
only in symptoms of fatigue, loss of appetite, reflux, and body
image. This is somewhat different from the results reported by
Park et al. [10], that the QoL score of both groups was lower
than the mean score for overall health status and that significant differences were shown regarding the physical function,
dyspnea, constipation, diarrhea, financial difficulties, loss of
appetite, and body image between two groups.
The malnutrition rate of the subjects in our study was
34.5% in the less-than-1-year group but this number was
decreased to 19.8% in the more-than-1-year group. This was
slightly higher than the rate reported by Ryu & Kim [11] and
similar to the result of Wu et al. [12]. As the postoperative nutritional status of patients are getting worse and manifested
with weight loss and hypoalbuminemia even at 6 months after
the surgery, continuous nutritional management is recommended [13]. From up to date studies which explored the relationship between the nutritional status and QoL are very rare.
In a study by Seo et al. [14], there was no association between
the QoL and nutritional indicators such as the total serum protein and albumin levels, prognostic nutrition index (PNI), and a
body weight. Regarding nutrient intake, the group with a lower
QoL had significantly less intake of nutrients such as proteins,
/>
Quality of Life after Gastrectomy
Table 3. Comparison of quality of life according to the period of postoperative survival
Less-than-1-year group
(n = 116)
More-than-1-year group
(n = 106)
p value
QLQ-C30 function
Overall health status
68.8 ± 25.4*
73.0 ± 19.6
0.484
Physical functioning
82.7 ± 13.6
85.6 ± 10.1
0.501
Role functioning
80.4 ± 26.5
87.9 ± 20.6
0.095
Emotional functioning
83.4 ± 22.2
84.0 ± 16.7
0.410
Cognitive functioning
80.6 ± 12.7
83.6 ± 13.5
0.377
Social functioning
85.1 ± 11.9
86.6 ± 17.6
0.590
Fatigue
22.3 ± 12.5
28.4 ± 18.2
0.006
Nausea and vomitting
13.4 ± 11.6
13.4 ± 13.8
0.385
Pain
10.4 ± 18.1
10.8 ± 9.0
0.271
Dyspnea
12.9 ± 9.1
11.5 ± 10.4
0.358
Insommnia
12.1 ± 10.9
15.0 ± 11.8
0.405
Appetite loss
11.5 ± 13.2
16.3 ± 17.5
0.002
Constipation
15.8 ± 11.6
17.1 ± 10.4
0.203
Diarrhea
18.4 ± 12.9
19.0 ± 13.3
0.355
Financial difficulties
19.8 ± 10.0
22.3 ± 11.5
0.184
Dysphagia
12.8 ± 17.8
10.7 ± 16.9
0.359
Pain
18.4 ± 15.5
18.6 ± 21.9
0.616
Reflux
18.0 ± 16.8
12.5 ± 17.6
0.027
Eating restriction
16.7 ± 17.5
12.6 ± 13.2
0.272
Anxiety
24.9 ± 16.1
19.2 ± 13.6
0.090
Dry mouth
19.7 ± 20.2
18.5 ± 16.0
0.535
Taste problem
11.2 ± 12.9
9.5 ± 13.3
0.251
QLQ-C30 symptom
QLQ-STO22 symptom
Body image
18.0 ± 18.1
10.9 ± 14.6
0.004
Hair loss
28.6 ± 32.5
26.6 ± 23.7
0.355
p values were calculated by ANCOVA adjusted for gender and follow up duration.
QLQ: quality of life questionnaire.
*Mean ± standard deviation.
iron, and zinc, and such a problem was more severe in women
than in men; thus, a balanced nutrient intake is emphasized
to improve the post-operative QoL [15]. In our study, the QoL
was significantly lower in the SGA-C group than in the SGA-A
group considering the overall health status including functional scales (physical functioning), and symptom scales (fatigue,
pain, and loss of appetite) of the EORTC QLQ-C30, and the QoL
in the SGA-C group was lower for considering reflux, eating
restriction, anxiety, and body image scales of the QLQ-STO22.
/>
This is consistent with the results from other study for the
nunutritional evaluation by using the nutritional risk screening (NRS) 2002, in which the QoL of the high-risk group with
NRS ≥ 3 was significantly lower than that of other groups [16].
The association between the nutritional status and the QoL of
cancer patients was well described in a study by Marín Caro et
al. [17]. Therefore, as QoL markedly decreases when the nutritional status deteriorates, great efforts to prevent malnutrition
to enhance early recovery from post-surgery need to be made.
157
Lim HS et al.
Table 4. Comparison of quality of life according to nutritional status
SGA-A
(n = 161)
SGA-B
(n = 48)
SGA-C
(n = 13)
Tukey
p value
Overall health status
72.1 ± 28.5*
67.0 ± 19.3
61.5 ± 23.4
1>3
0.032
Physical functioning
89.6 ± 18.9
87.5 ± 15.1
74.4 ± 18.3
1,2 > 3
0.025
Role functioning
86.9 ± 22.0
80.2 ± 20.6
79.9 ± 21.5
0.584
Emotional functioning
85.7 ± 19.2
82.6 ± 16.8
73.9 ± 16.4
0.067
Cognitive functioning
85.0 ± 13.7
83.6 ± 16.5
82.2 ± 19.4
0.579
Social functioning
84.4 ± 18.4
80.6 ± 15.6
78.1 ± 20.5
0.446
Fatigue
18.6 ± 14.3
23.2 ± 12.5
27.9 ± 19.0
Nausea and vomitting
10.7 ± 16.5
13.4 ± 13.8
14.0 ± 15.2
8.6 ± 14.9
10.4 ± 11.2
13.0 ± 16.3
Dyspnea
12.0 ± 18.0
11.9 ± 13.1
12.4 ± 16.5
0.520
Insommnia
11.3 ± 16.2
13.1 ± 19.4
14.8 ± 17.8
0.418
Appetite loss
9.9 ± 12.8
14.5 ± 19.2
18.5 ± 20.1
Constipation
12.5 ± 10.6
14.8 ± 5.6
16.8 ± 11.5
0.302
Diarrhea
18.7 ± 19.5
17.4 ± 12.9
20.4 ± 16.2
0.485
Financial difficulties
18.3 ± 15.9
21.8 ± 15.0
23.0 ± 21.5
0.349
Dysphagia
11.7 ± 22.0
10.4 ± 15.4
12.7 ± 15.6
0.416
Pain
17.1 ± 21.4
16.6 ± 22.5
18.1 ± 18.9
0.523
Reflux
8.6 ± 16.3
11.5 ± 17.7
16.0 ± 15.0
1<3
0.002
Eating restriction
10.3 ± 16.6
15.6 ± 23.2
17.3 ± 18.4
1 < 2,1 < 3
0.004
Anxiety
14.2 ± 18.2
20.9 ± 13.6
23.0 ± 15.1
1<3
0.014
Dry mouth
18.4 ± 26.6
21.5 ± 26.0
19.3 ± 24.6
0.203
Taste problem
10.7 ± 18.3
12.5 ± 20.8
13.1 ± 23.0
0.331
Body image
12.1 ± 21.2
14.9 ± 19.3
21.6 ± 15.3
Hair loss
23.5 ± 19.6
28.7 ± 22.9
26.8 ± 17.5
QLQ-C30 function
QLQ-C30 symptom
Pain
1<3
0.002
0.044
1<3
1,2 < 3
0.030
0.011
QLQ-STO22 symptom
1,2 < 3
0.001
0.089
p values were calculated by ANCOVA adjusted for extent of gastric resection.
QLQ: quality of life questionnaire.
*Mean ± standard deviation.
This study has some limitations. Different recovery patterns among patients owing to variations in the elapsed time
from the surgery could result in differences in QoL, but our
classification might have been somewhat broad owing to a
criterion value of 1 year. Unfortunately, QoL comparison or
adjusting the results with the surgical method or range could
not be performed. Though many studies has been performed
to associate the surgical method and QoL, this study is still
158
meaningful because the study involved nutritional evaluation methods commonly used by dietitians. The results of this
study implicate the relationship between nutritional status
and QoL. Therefore, these two indicators could be included in
the management protocol of postoperative gastric cancer and
also be utilized in the care system of long-term survivals from
gastric cancer.
/>
Quality of Life after Gastrectomy
Conclusion
Our results indicate that the QoL of gastric cancer patients
is getting lower with lesser elapsed time of post-gastrectomy
and with a worsening of nutritional status. To improve the QoL
when treating cancer, active nutritional management must be
performed and continuous studies that integrate the effect
of the long-term outcome and diet quality on the QoL are required.
Conflict of Interest
6.
7.
8.
9.
We declare that we have no conflict of interest.
Acknowledgement
This work was supported by the Soonchunhyang University
Research Fund.
10.
11.
12.
References
1. Ferrell BR, Wisdom C, Wenzl C. Quality of life as an outcome variable in
the management of cancer pain. Cancer 1989;63:2321-7.
2. Jung KW, Won YJ, Kong HJ, Oh CM, Cho H, Lee DH, Lee KH. Cancer statistics in Korea: incidence, mortality, survival, and prevalence in 2012.
Cancer Res Treat 2015;47:127-41.
3. Yasuda K, Shiraishi N, Etoh T, Shiromizu A, Inomata M, Kitano S. Longterm quality of life after laparoscopy-assisted distal gastrectomy for
gastric cancer. Surg Endosc 2007;21:2150-3.
4. Park S, Chung HY, Lee SS, Kwon O, Yu W. Serial comparisons of quality of life after distal subtotal or total gastrectomy: what are the
rational approaches for quality of life management? J Gastric Cancer
2014;14:32-8.
5. Kim AR, Cho J, Hsu YJ, Choi MG, Noh JH, Sohn TS, Bae JM, Yun YH, Kim
/>
13.
14.
15.
16.
17.
S. Changes of quality of life in gastric cancer patients after curative resection: a longitudinal cohort study in Korea. Ann Surg 2012;256:100813.
Lee JH, Kim YW, Ryu KW, Lee JR, Kim CG, Choi IJ, Kook MC, Nam BH,
Bae JM. A phase-II clinical trial of laparoscopy-assisted distal gastrectomy with D2 lymph node dissection for gastric cancer patients. Ann
Surg Oncol 2007;14:3148-53.
Horváth OP, Kalmár K, Cseke L, Pótó L, Zámbó K. Nutritional and lifequality consequences of aboral pouch construction after total gastrectomy: a randomized, controlled study. Eur J Surg Oncol 2001;27:55863.
Rausei S, Mangano A, Galli F, Rovera F, Boni L, Dionigi G, Dionigi R.
Quality of life after gastrectomy for cancer evaluated via the EORTC
QLQ-C30 and QLQ-STO22 questionnaires: surgical considerations from
the analysis of 103 patients. Int J Surg 2013;11 Suppl 1:S104-9.
Kim YW, Baik YH, Yun YH, Nam BH, Kim DH, Choi IJ, Bae JM. Improved
quality of life outcomes after laparoscopy-assisted distal gastrectomy
for early gastric cancer: results of a prospective randomized clinical
trial. Ann Surg 2008;248:721-7.
Park JY, Eom BW, Jo MJ, Yoon HM, Ryu KW, Kim YW, Nam BH, Lee JH.
Health-related quality of life after robot-assisted distal gastrectomy in
early gastric cancer. World J Surg 2014;38:1112-20.
Ryu SW, Kim IH. Comparison of different nutritional assessments in
detecting malnutrition among gastric cancer patients. World J Gastroenterol 2010;16:3310-7.
Wu GH, Liu ZH, Wu ZH, Wu ZG. Perioperative artificial nutrition in
malnourished gastrointestinal cancer patients. World J Gastroenterol
2006;12:2441-4.
Sungurtekin H, Sungurtekin U, Balci C, Zencir M, Erdem E. The influence
of nutritional status on complications after major intraabdominal surgery. J Am Coll Nutr 2004;23:227-32.
Seo KS, Lee JM, Kim WY. Comparison of reconstructive techniques
after total gastrectomy as determined by patient quality of life and
nutritional status. J Korean Gastric Cancer Assoc 2007;7:219-27.
Tian J, Chen JS. Nutritional status and quality of life of the gastric
cancer patients in Changle County of China. World J Gastroenterol
2005;11:1582-6.
Gavazzi C, Colatruglio S, Sironi A, Mazzaferro V, Miceli R. Importance
of early nutritional screening in patients with gastric cancer. Br J Nutr
2011;106:1773-8.
Marín Caro MM, Laviano A, Pichard C. Impact of nutrition on quality of
life during cancer. Curr Opin Clin Nutr Metab Care 2007;10:480-7.
159