Evaluation of nutritional status of cancer patients during Treatment by PatientGenerated Subjective Global Assessment: a HospitalBased Study
Bạn đang xem bản rút gọn của tài liệu. Xem và tải ngay bản đầy đủ của tài liệu tại đây (513.11 KB, 5 trang )
See discussions, stats, and author profiles for this publication at: />
Evaluation of Nutritional Status of Cancer Patients during Treatment by
Patient-Generated Subjective Global Assessment: a Hospital-Based Study
Article in Asian Pacific journal of cancer prevention: APJCP · January 2016
DOI: 10.7314/APJCP.2015.16.18.8173
CITATIONS
READS
13
567
4 authors, including:
Dibyendu Sharma
Ritesh Tapkire
Cachar Cancer Hospital & Research Centre
Cachar Cancer Hospital & Research Centre
1 PUBLICATION 13 CITATIONS
7 PUBLICATIONS 123 CITATIONS
SEE PROFILE
Soumitra Nath
Gurucharan College, Silchar
38 PUBLICATIONS 92 CITATIONS
SEE PROFILE
Some of the authors of this publication are also working on these related projects:
DBT Funded BIF and BT-Hub, Gurucharan College, Silchar View project
All content following this page was uploaded by Soumitra Nath on 23 January 2016.
The user has requested enhancement of the downloaded file.
SEE PROFILE
DOI: />Evaluation of Nutritional Status of Cancer Patients during Treatment by PG-SGA: a Hospital Based Study
RESEARCH ARTICLE
Evaluation of Nutritional Status of Cancer Patients during
Treatment by Patient-Generated Subjective Global Assessment:
a Hospital-Based Study
Dibyendu Sharma1*, Ravi Kannan2, Ritesh Tapkire2, Soumitra Nath3
Abstract
Cancer patients frequently experience malnutrition. Cancer and cancer therapy effects nutritional status
through alterations in the metabolic system and reduction in food intake. In the present study, fifty seven cancer
patients were selected as subjects from the oncology ward of Cachar Cancer Hospital and Research Centre,
Silchar, India. Evaluation of nutritional status of cancer patients during treatment was carried out by scored
Patient-Generated Subjective Global Assessment (PG-SGA). The findings of PG-SGA showed that 15.8% (9)
were well nourished, 31.6% (18) were moderately or suspected of being malnourished and 52.6% (30) were
severely malnourished. The prevalence of malnutrition was highest in lip/oral (33.33%) cancer patients. The
study showed that the prevalence of malnutrition (84.2%) was high in cancer patients during treatment.
Keywords: Nutritional status - cancer - scored patient - generated subjective global assessment - malnourished
Asian Pac J Cancer Prev, 16 (18), 8173-8176
Introduction
Nutrition is an important factor in the treatment and
progression of cancer. The majority of cancer patients
experience weight loss as their disease progresses and,
in general, weight loss is a major prognostic indicator of
poor survival and impaired response to cancer treatment
(Khoshnevis et al., 2012). Cancer patients are particularly
susceptible to nutritional depletion due to the combined
effects of the malignant disease and its treatment (Amaral
et al., 2008; Paccagnella et al., 2010).
With increasing incidence of cancer, identification
and management of nutritional deficiencies are needed.
According to guidelines from the European Society of
Parenteral and Enteral Nutrition (ESPEN) and American
Society of Parenteral and Enteral Nutrition (ASPEN),
preoperative nutritional support should be considered
in cancer patients. Further, for severely malnourished
patients, they recommend performing surgery after
administering preoperative nutritional support for more
than 7 days (Weimann et al., 2006; Braga et al., 2009).
Studies indicate that malnutrition and weight loss are
common among 20 to 97% of oncologic patients (Kern
and Norton, 1988; Ollenschlager et al., 1991; Abe et al.,
2013; Gabrielson et al., 2013; Malihi et al., 2013) and the
prevalence of malnutrition depends on the tumour type,
location, stage and treatment (Shike, 1996).
The consequences of malnutrition may include an
increased risk of complications, decreased response
and tolerance to treatment, impaired quality of life and
decreased survival rate (Ottery, 1996; Nitenberg and
Raynard, 2000). Factors affecting a person’s food intake,
such as difficulties swallowing and loss of appetite play an
important role in quality of life (Hickson and Frost, 2004).
The prevalence and magnitude of a diminished
nutritional status varies with individual treatment
regimens, it is widely accepted that the principal causes
related to therapy are the result of commonly experienced
side effects such as nausea, vomiting, anorexia, lethargy,
diarrhoea, esophagitis, and dysphasia (Kyle et al., 2005;
Odelli et al., 2005). The cancer burden continues to
increase due to adoption of lifestyles and behaviours that
increase the risk of getting cancer and the increase in
population causing strait resources pushing the economies
to produce more that causes pollution and also increases
exposure of masses to carcinogens (Jemal et al., 2011).
Cancer can alter metabolism of nutrients, thus leading to
development of symptoms and disturbances of the Gastro
Intestinal Tract (GIT) leading to malnutrition (Nitenberg
and Raynard, 2000). Hence, having the right knowledge
is vital to enable cope with the symptoms as the treatment
goes on and even after treatment to prevent relapse.
Materials and Methods
Study design
Present study was an observational study in which the
standard questionnaire of PG-SGA was used to evaluate
nutritional status of the patient. The participants enrolled in
the study comprised of cancer patients who were receiving
Centre of Diet & Nutritional Science, 2Department of Surgical Oncology, Cachar Cancer Hospital & Research Centre, 3Department
of Biotechnology, Gurucharan College, Silchar, India *For correspondence:
1
Asian Pacific Journal of Cancer Prevention, Vol 16, 2015
8173
Dibyendu Sharma et al
surgery, radiotherapy, chemotherapy or a combination of
these or had completed treatment and was on follow-up
care. A total of 57 patients were interviewed in the present
study, age group between 28 to 75 years, comprising of 33
males and 24 females. All the gathered data were analysed
by MS-Excel.
Inclusion and exclusion criteria
Patients who were diagnosed with cancer, aged at
least 18 years, admitted to medical facility were eligible
for inclusion in the study. The patients who were too ill
to understand and respond were excluded.
Results and Discussion
Demographic characteristics of patients who were
interviewed are described in Table 1.They had various
forms of cancer. Out of the 57 subjects, 40.35% had
cancer in lip/oral cavity followed by oesophageal
cancer (15.79%) and least being bone tumour (1.75%).
Distribution according to the site of cancer are given in
Table 2..
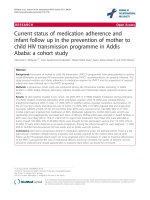
Among the participants enrolled in the study, they
were treated with radiotherapy chemotherapy or chemoradiotherapy. In most cases, patients had undergone
surgery along with different therapy. Number of patients
receiving different therapy and surgery are illustrated in
Figure 1.
BMI of participants were classified in different groups
(Table 3) and the analysis showed that majority of them
have imbalance weight-height ratio. It has also been
observed that 80.70% of patients had less than usual foodintake, 15.79% of patients had unchanged food-intake
and 3.51% of patients had more than usual food-intake
over the preceding month (Table 4) and this may result
in poor nutritional status and intolerance treatment. In
a study (Sattianayagam et al., 2013) found that 55 % of
patients had less than usual food-intake, 45 % of patients
had unchanged food-intake and 4 % of patients had more
than usual food-intake over the preceding month.
The study tells us that the most common cause of
food-intake reduction during the past two weeks were;
no appetite (38.60%), nausea (43.86%), constipation
(15.79%), mouth sores (17.54%) and pain (8.77%) as
seen in Table 4. The problems most frequently endorsed
by patients as contributing to psychological distress was
depression (73.88%) and the observation was found to
be in correlation with other studies (Dyrbye et al., 2006;
Ma et al., 2013).
Examining patient’s weight loss revealed that 15 out
of 57 patients (26.32%) did not lose weight and 19.30%
had gained weight during the last one month of the study
period. 5 patients were found to had weight loss of less
than 3 %, 7 patients were found to had weight loss of 3-5
%, 13 patients were found to had weight loss of 5-10%
and 6 patients were found to had weight loss of more than
10%. Analysis of percentage of weight loss shows that
54.39% of the participants had weight loss of more than
3% in the last month or 5% over 6 months which is an
early signs of malnutrition (Sattianayagam et al., 2013).
It has also been evidenced that only 1.75% of the
8174
Asian Pacific Journal of Cancer Prevention, Vol 16, 2015
subjects have normal activities with no limitations in their
day-to-day activities over the past month. 17.54% of the
subjects were able to do little activity and spend most of
the day in bed or chair; 42.11% of the subjects have rate
their activities as not their normal self, but able to be up
and about with normal activities; 36.84% of the subjects
have rate their activities as not felling up to most things,
but in bed or chair less than half the day and 1.75% of the
subjects were pretty much bedridden and rarely out of bed.
The findings suggest that cancer patients both during and
after treatments may be malnourished and have negative
impact hence, on their day-to-day activities and function
and treatment tolerance. So, proper planning and nutrition
intervention before, during and after treatment is required.
Physical examination conducted for subjective
Table 1. Demographic Characteristics of Patients
Characteristics Number of patients
Age
28-50 years
51-72 years
Hindu
Religion
Muslim
Christian
Income per Month
<5000
(Indian Rupees)
>5000
Sanitation
Squat toilet
Pit toilet
Food Habit
Vegetarian
Non-Vegetarian
PHE Department
Water Source
Well
Tube-Well
Pond
Boiling
Drinking Water Treatment Water Filter
Untreated
Tobacco Use
Chewing
Smoking
Liquor
Alcohol
19 (33.33%)
38 (66.67%)
35 (61.40%)
17 (29.82%)
5 (8.80%)
37 (64.91%)
20 (35.09%)
19 (33.33%)
38 (66.67%)
1 (1.75%)
56 (98.25%)
31 (54.40%)
8 (14.03%)
8 (14.03%)
10 (17.54%)
6 (10.53%)
33 (57.90%)
18 (31.58%)
52 (91.23%)
31 (54.38%)
8 (14.03%)
Table 2. Distribution according to the site of Cancer
Cancer site
Lip/oral cavity
Pharynx
Larynx
Oesophagus
Bone tumor
Lymphoma
Breast
Lung
Ovary
Colon
Rectum
Number of patients
23 (40.35%)
3 (5.26%)
2 (3.51%)
9 (15.79%)
1 (1.75%)
2 (3.51%)
4 (7.02%)
4 (7.02%)
3 (5.26%)
2 (3.51%)
4 (7.02%)
Table 3. BMI Classification of Participants
CategoriesBMI
Very severely underweight (<15)
Severely underweight (15-16)
Underweight (16-18.5)
Normal (18.5-25)
Overweight (25-30)
Obese class 1 (30-35)
12 (21.05%)
6 (10.53%)
14 (24.56%)
21 (36.84%)
3 (5.26%)
1 (1.75%)
DOI: />Evaluation of Nutritional Status of Cancer Patients during Treatment by PG-SGA: a Hospital Based Study
Table 4. Frequency of Variables Affecting Patients’
Nutritional Status (PG-SGA Score)
Clinical characteristics
Number of Patients
Food intake
Unchanged
More than usual
Less than usual
Problem/Symptoms
No appetite
Nausea
Constipation
Mouth sores
Pain
Depression
Weight loss
>10%
5-10%
3-5%
<3
Weight increased
Weight unchanged
Physical activity
Rarely out of bed
Less than half the day , in bed
Fairly normal activities
More than half the day , in bed/chair
Normal no limitation
Physical Examination
Severe
Moderate
Mild
Normal
9 (15.79%)
2 (3.51%)
46 (80.70%)
22 (38.60%)
25 (43.86%)
9 (15.79%)
10 (17.54%)
5 (8.77%)
42 (73.68%)
6 (10.53%)
13 (22.81%)
7 (12.28%)
5 (8.77%)
11 (19.30%)
15 (26.32%)
1 (1.75%)
21 (36.84%)
24 (42.11%)
10 (17.54%)
1 (1.75%)
14 (24.56%)
21 (36.84%)
11 (19.30%)
11 (19.30%)
17
Surgery
plus
chemoradiotherapy
7
Surgery
plus
chemotherapy
5
Surgery
plus
radiotherapy
12
Chemo-‐radiotherapy
1
Radiotherapy
0
2
4
6
8
10
12
14
16
Co-relation between PG-SGA score and BMI
The prevalence of moderate to severe malnutrition in
the patients was 84.21% (PG-SGA) and the prevalence
of undernutrition was 56.14% (BMI). From the nutrition
assessment tool of PG-SGA, the result we got indicated
that BMI alone cannot be a reliable indicator of nutritional
status of an individual in cancer patients. Previous studies
in cancer patient groups also highlighted the limitations
of using BMI as the sole measure of nutritional status
(Desbrow et al., 2005; Isenring et al., 2006).
In conclusion, This observational study highlights the
fact that nutritional issues are prevalent among cancer
patients during treatment. High prevalence of malnutrition
(84.21%) was observed among cancer patients, and this
was significantly associated with clinical symptoms
directly related to the eating process. Nutritional screening
is an important step needed to help intervene earlier in the
Cancer patient’s trajectory. Earlier detection of nutritional
risk symptoms will result in thorough nutritional
assessments and interventions that may help prevent
further or pending malnutrition and weight loss during
treatment and ultimately improve the quality of life of the
advanced cancer patient.
Acknowledgements
15
Chemotherapy
evaluation of fat, muscle and fluid status showed that
24.56% of patients had severe deficit, 36.84% of patients
had moderate deficit, 19.30% of patients had mild
deficit and only 19.30% of patients had no deficit. Thus,
indicating that the prevalence of malnutrition is very high
among them during treatment.
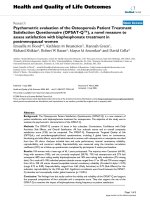
According to PG-SGA score (Fig 2) 15.79% of patients
were well-nourished or anabolic (SGA-A); 31.58% of
patients had moderate or suspected malnutrition (SGA-B);
52.63% of patients were severely malnourished. Thus, the
prevalence of malnutrition in the study population was
high (84.21%) and it depends on the tumour type, tumour
location, stage of the disease, and treatment received and
on the type of nutritional assessment method used (Shike,
1996; Bauer et al., 2002).
18
No.
of
pa(ents
Figure 1. Different Type of Treatments and their
Combinations
The authors wish to extend their grateful thanks to
Cachar Cancer Hospital and Research Centre, Silchar,
Assam, India for providing the opportunity to carry out
the present study. Authors also acknowledge the Hospital
Society for funding the study.
References
16%
SGA-‐A
SGA-‐B
53%
31%
SGA-‐C
Figure 2. Frequency of Severity of Malnutrition (PGSGA score)
Abe Vicente M, Barao K, Silva TD, et al (2013). What are the
most effective methods for assessment of nutritional status
in outpatients with gastric and colorectal cancer? Nutr Hosp,
28, 585-91.
Amaral TF, Antunes A, Cabral S, et al (2008). An evaluation of
three nutritional screening tools in a Portuguese oncology
centre. J Hum Nutr Diet, 21, 575-83.
Bauer J, Capra S, Ferguson M (2002). Use of the scored PatientGenerated Subjective Global Assessment (PG-SGA) as a
nutrition assessment tool in patients with cancer. Eur J Clin
Nutr, 56, 779-85.
Braga M, Ljungqvist O, Soeters P, et al (2009). ESPEN
Asian Pacific Journal of Cancer Prevention, Vol 16, 2015
8175
Dibyendu Sharma et al
Guidelines on Parenteral Nutrition: surgery. Clin Nutr, 28,
378-86.
Desbrow B, Bauer J, Blum C, et al (2005). Assessment of
nutritional status in hemodialysis patients using patientgenerated subjective global assessment. J Ren Nutr, 15,
211-6.
Dyrbye LN, Thomas MR, Shanafelt TD (2006). Systematic
review of depression, anxiety, and other indicators of
psychological distress among U.S. and Canadian medical
students. Acad Med, 81, 354-73.
Gabrielson DK, Scaffidi D, Leung E, et al (2013). Use of an
abridged scored Patient-Generated Subjective Global
Assessment (abPG-SGA) as a nutritional screening tool
for cancer patients in an outpatient setting. Nutr Cancer,
65, 234-9.
Hickson M, Frost G (2004). An investigation into the
relationships between quality of life, nutritional status and
physical function. Clin Nutr, 23, 213-21.
Isenring E, Cross G, Daniels L, et al (2006). Validity of the
malnutrition screening tool as an effective predictor
of nutritional risk in oncology outpatients receiving
chemotherapy. Support Care Cancer, 14, 1152-6.
Jemal A, Bray F, Center MM, et al (2011). Global cancer
statistics. CA Cancer J Clin, 61, 69-90.
Kern KA, Norton JA (1988). Cancer cachexia. JPEN J Parenter
Enteral Nutr, 12, 286-98.
Khoshnevis N, Ahmadizar F, Alizadeh M, et al (2012).
Nutritional assessment of cancer patients in Tehran, Iran.
Asian Pac J Cancer Prev, 13, 1621-6.
Kyle UG, Genton L, Pichard C (2005). Hospital length of stay
and nutritional status. Curr Opin Clin Nutr Metab Care, 8,
397-402.
Ma L, Poulin P, Feldstain A, et al (2013). The association
between malnutrition and psychological distress in patients
with advanced head-and-neck cancer. Curr Oncol, 20,
554-60.
Malihi Z, Kandiah M, Chan YM, et al (2013). Nutritional status
and quality of life in patients with acute leukaemia prior
to and after induction chemotherapy in three hospitals in
Tehran, Iran: a prospective study. J Hum Nutr Diet, 26,
123-31.
Nitenberg G, Raynard B (2000). Nutritional support of the cancer
patient: issues and dilemmas. Crit Rev Oncol Hematol, 34,
137-68.
Odelli C, Burgess D, Bateman L, et al (2005). Nutrition
support improves patient outcomes, treatment tolerance and
admission characteristics in oesophageal cancer. Clin Oncol
(R Coll Radiol), 17, 639-45.
Ollenschlager G, Viell B, Thomas W, et al (1991). Tumor
anorexia: causes, assessment, treatment. Recent Results
Cancer Res, 121, 249-59.
Ottery FD (1996). Definition of standardized nutritional
assessment and interventional pathways in oncology.
Nutrition, 12, 15-9.
Paccagnella A, Morello M, Da Mosto MC, et al (2010). Early
nutritional intervention improves treatment tolerance and
outcomes in head and neck cancer patients undergoing
concurrent chemoradiotherapy. Support Care Cancer, 18,
837-45.
Sattianayagam PT, Lane T, Fox Z, et al (2013). A prospective
study of nutritional status in immunoglobulin light chain
amyloidosis. Haematologica, 98, 136-40.
Shike M (1996). Nutrition therapy for the cancer patient.
Hematol Oncol Clin North Am, 10, 221-34.
Weimann A, Braga M, Harsanyi L, et al (2006). ESPEN
guidelines on enteral nutrition: surgery including organ
transplantation. Clin Nutr, 25, 224-44.
8176
Asian Pacific Journal of Cancer Prevention, Vol 16, 2015
View publication stats