Tài liệu Memory Dump Analysis Anthology- P19 ppt
Bạn đang xem bản rút gọn của tài liệu. Xem và tải ngay bản đầy đủ của tài liệu tại đây (1.12 MB, 30 trang )
Visualizing Memory Dumps 541
Mspaint process user memory dump (32 bits-per-pixel):
Please purchase PDF Split-Merge on www.verypdf.com to remove this watermark.
542 PART 6: Fun with Crash Dumps
Mspaint process user memory dump after loading “Toco Toucan.jpg” from Vista
Sample Pictures folder (32 bits-per-pixel):
Please purchase PDF Split-Merge on www.verypdf.com to remove this watermark.
Visualizing Memory Dumps 543
Citrix ICA client process (wfica32.exe) user memory dump (32 bits-per-pixel):
Please purchase PDF Split-Merge on www.verypdf.com to remove this watermark.
544 PART 6: Fun with Crash Dumps
VISUALIZING MEMORY LEAKS
Dump2Picture (page 532) can be used to explore memory leaks visually. I created
the following small program in Visual C++ that leaks 64Kb every second:
#include "stdafx.h"
#include <windows.h>
int _tmain(int argc, _TCHAR* argv[])
{
while (true)
{
printf("%x\n", (UINT_PTR)malloc(0xFFFF));
Sleep(1000);
}
return 0;
}
Then I sampled 3 dumps at 7Mb, 17Mb and 32Mb process virtual memory size
and converted them as 16 bits-per-pixel bitmaps. On the pictures below we can see that
the middle black memory area grows significantly. Obviously malloc function allocates
zeroed memory and therefore we see black color.
Please purchase PDF Split-Merge on www.verypdf.com to remove this watermark.
Visualizing Memory Leaks 545
7Mb process memory dump:
Please purchase PDF Split-Merge on www.verypdf.com to remove this watermark.
546 PART 6: Fun with Crash Dumps
17Mb process memory dump:
Please purchase PDF Split-Merge on www.verypdf.com to remove this watermark.
Visualizing Memory Leaks 547
32Mb process memory dump:
Please purchase PDF Split-Merge on www.verypdf.com to remove this watermark.
548 PART 6: Fun with Crash Dumps
If we zoom in the black area we would see the following pattern:
Colored lines inside are heap control structures that are created for every allo-
cated block of memory. If this is correct then allocating smaller memory blocks would
create a hatched pattern. And this is true indeed. The following program leaks 256 byte
memory blocks:
#include "stdafx.h"
#include <windows.h>
int _tmain(int argc, _TCHAR* argv[])
{
while (true)
{
printf("%x\n", (UINT_PTR)malloc(0xFF));
Sleep(1000/0xFF);
}
return 0;
}
Please purchase PDF Split-Merge on www.verypdf.com to remove this watermark.
Visualizing Memory Leaks 549
The corresponding process memory picture and zoomed heap area are the
following:
Please purchase PDF Split-Merge on www.verypdf.com to remove this watermark.
550 PART 6: Fun with Crash Dumps
Making allocations 4 times smaller makes heap area to look hatched and zoomed
picture is more densely packed by heap control structures:
#include "stdafx.h"
#include <windows.h>
int _tmain(int argc, _TCHAR* argv[])
{
while (true)
{
printf("%x\n", (UINT_PTR)malloc(0xFF/4));
Sleep((1000/0xFF)/4);
}
return 0;
}
Please purchase PDF Split-Merge on www.verypdf.com to remove this watermark.
Visualizing Memory Leaks 551
Please purchase PDF Split-Merge on www.verypdf.com to remove this watermark.
552 PART 6: Fun with Crash Dumps
Here is another example. One service was increasing its memory constantly. The
crash dump picture shows huge hatched dark region in the middle:
Please purchase PDF Split-Merge on www.verypdf.com to remove this watermark.
Visualizing Memory Leaks 553
Please purchase PDF Split-Merge on www.verypdf.com to remove this watermark.
554 PART 6: Fun with Crash Dumps
and if we zoom in this region we get:
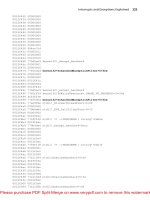
Because the pattern and allocation size look uniform it could be the true heap
memory leak for some operation that allocates constant size buffers. After opening the
memory dump and looking at heap segments that had grown the most we can see the
same allocation size indeed:
0:000> !.\w2kfre\ntsdexts.heap -h 5
HEAPEXT: Unable to get address of NTDLL!NtGlobalFlag.
Index Address Name Debugging options enabled
1: 00140000
2: 00240000
3: 00310000
4: 00330000
5: 00370000
Segment at 00370000 to 00380000 (00010000 bytes committed)
Segment at 01680000 to 01780000 (00100000 bytes committed)
Segment at 019C0000 to 01BC0000 (00200000 bytes committed)
Segment at 01BC0000 to 01FC0000 (00400000 bytes committed)
Segment at 01FC0000 to 027C0000 (00800000 bytes committed)
Segment at 027C0000 to 037C0000 (01000000 bytes committed)
Segment at 037C0000 to 057C0000 (02000000 bytes committed)
Segment at 057C0000 to 097C0000 (00155000 bytes committed)
…
…
…
Please purchase PDF Split-Merge on www.verypdf.com to remove this watermark.
Visualizing Memory Leaks 555
057B96E0: 01048 . 01048 [07] - busy (1030), tail fill
057BA728: 01048 . 01048 [07] - busy (1030), tail fill
057BB770: 01048 . 01048 [07] - busy (1030), tail fill
057BC7B8: 01048 . 01048 [07] - busy (1030), tail fill
057BD800: 01048 . 01048 [07] - busy (1030), tail fill
057BE848: 01048 . 01048 [07] - busy (1030), tail fill
057BF890: 01048 . 00770 [14] free fill
Heap entries for Segment07 in Heap 370000
057C0040: 00040 . 01048 [07] - busy (1030), tail fill
057C1088: 01048 . 01048 [07] - busy (1030), tail fill
057C20D0: 01048 . 01048 [07] - busy (1030), tail fill
057C3118: 01048 . 01048 [07] - busy (1030), tail fill
057C4160: 01048 . 01048 [07] - busy (1030), tail fill
057C51A8: 01048 . 01048 [07] - busy (1030), tail fill
…
…
…
Please purchase PDF Split-Merge on www.verypdf.com to remove this watermark.
556 PART 6: Fun with Crash Dumps
PICTURING COMPUTER MEMORY
An alternative to converting memory dumps to picture files is to save a memory
range to a binary file and then convert it to a BMP file. Thus we can view the particular
DLL or driver mapped into address space, heap or pool region, etc.
To save a memory range to a file we can use WinDbg .writemem command:
.writemem d2p-range.bin 00800000 0085e000
or
.writemem d2p-range.bin 00400000 L20000
I wrote a WinDbg script that saves a specified memory range and then calls a
shell script which automatically converts the saved binary file to a BMP file and then
runs whatever picture viewer is registered for .bmp extension.
The WinDbg script code (mempicture.txt):
.writemem d2p-range.bin ${$arg1} ${$arg2}
.if (${/d:$arg3})
{
.shell -i- mempicture.cmd d2p-range ${$arg3}
}
.else
{
.shell -i- mempicture.cmd d2p-range
}
The shell script (mempicture.cmd):
dump2picture %1.bin %1.bmp %2
%1.bmp
Because WinDbg installation folder is assumed to be the default directory for
both scripts and Dump2Picture.exe they should be copied to the same folder where
windbg.exe is located. On my system it is
C:\Program Files\Debugging Tools for Windows
Both scripts are now included in Dump2Picture package available for free down-
load at:
Please purchase PDF Split-Merge on www.verypdf.com to remove this watermark.
Picturing Computer Memory 557
To call the script from WinDbg we use the following command:
$$>a< mempicture.txt Range [bits-per-pixel]
where Range can be in ADDRESS1 ADDRESS2 or ADDRESS LXXX format, bits-per-pixel
can be 8, 16, 24 or 32. By default it is 32.
For example, I loaded a complete Windows x64 memory dump and visualized
HAL (hardware abstraction layer) module:
kd> lm
start end module name
fffff800`00800000 fffff800`0085e000 hal
fffff800`01000000 fffff800`0147b000 nt
fffff97f`ff000000 fffff97f`ff45d000 win32k
kd> $$>a< mempicture.txt fffff800`00800000 fffff800`0085e000
Writing 5e001 bytes
C:\Program Files\Debugging Tools for Windows>dump2picture d2p-range.bin
d2p-range.bmp
Dump2Picture version 1.1
Written by Dmitry Vostokov, 2007
d2p-range.bmp
d2p-range.bin
1 file(s) copied.
C:\Program Files\Debugging Tools for Windows>d2p-range.bmp
<.shell waiting 10 second(s) for process>
.shell: Process exited
kd>
and Windows Picture and Fax Viewer application was launched and displayed the
following picture:
Please purchase PDF Split-Merge on www.verypdf.com to remove this watermark.
558 PART 6: Fun with Crash Dumps
Please purchase PDF Split-Merge on www.verypdf.com to remove this watermark.
Unicode Illuminated 559
UNICODE ILLUMINATED
I generated a memory dump with plenty of Unicode and ASCII strings “Hello
World!” to see how they look on a picture. Wide characters from Unicode (UTF-16) )oc-
cupy two bytes:
0:000> db 008c7420 l20
008c7420 48 00 65 00 6c 00 6c 00-6f 00 20 00 57 00 6f 00 H.e.l.l.o.
.W.o.
008c7430 72 00 6c 00 64 00 21 00-00 00 00 00 00 00 00
00 r.l.d.!
and characters from ASCII encoding occupy one byte of memory:
0:000> db 008c72b4 l10
008c72b4 48 65 6c 6c 6f 20 57 6f-72 6c 64 21 00 00 00 00 Hello
World!
We can see that the second byte for Unicode English characters is zero. I con-
verted that memory dump into 8 bits-per-pixel bitmap using Dump2Picture (page 532)
and after zooming it sufficiently in Vista Photo Viewer until pixels become squares I got
the following picture that illustrates the difference between Unicode and ASCII strings:
Incidentally the same memory dump converted to 32 bits-per-pixel bitmap shows
Unicode “Hello World!” strings in green colors.
Please purchase PDF Split-Merge on www.verypdf.com to remove this watermark.
560 PART 6: Fun with Crash Dumps
TEACHING BINARY TO DECIMAL CONVERSION
Sometimes we have data in binary and we want to convert it to decimal to loo-
kup some constant in a header file, for example. I used to do it previously via calc.exe.
Now I use .formats WinDbg command and 0y binary prefix:
0:000> .formats 0y111010
Evaluate expression:
Hex: 0000003a
Decimal: 58
Octal: 00000000072
Binary: 00000000 00000000 00000000 00111010
Chars: :
Time: Thu Jan 01 00:00:58 1970
Float: low 8.12753e-044 high 0
Double: 2.86558e-322
Once I was flying SWISS and found the binary watch in their duty-free catalog
which I use now to guess time:
It has 6 binary digits for minutes. There are desktop binary clocks and other bi-
nary watches available if we google them but they don’t have 6 binary digits for mi-
nutes. They approximate them by using 2 rows or columns: tenths of minutes and mi-
nutes (2 + 4 binary digits) and we are all good in handling 4 binary digits because of our
work with hexadecimal nibbles but not good in handling more binary digits like 5 or 6
when we see them in one row.
Please purchase PDF Split-Merge on www.verypdf.com to remove this watermark.
Crash Dumps and Global Conspiracy 561
CRASH DUMPS AND GLOBAL CONSPIRACY
There are Matrix-style conspiracy theories where we are like computer programs.
Looking from crash dump analysis and debugging perspective we ask a question
whether a process can detect its own past crash dumps? Obviously yes, if it the code
was written with such intention. If the code was written without such intention but is
complex enough to generate additional code or reuse the existing one to train itself in
such procedure then it can detect past crash dumps too. Therefore, if we can see our
past crash dumps then this will be the proof that we live in a Matrix-type world.
More questions spring to conspiracy-savvy mind. Are there any secret software
engineering societies (SSES)? Can we see patterns in memory dumps linking to alien
code?
Please purchase PDF Split-Merge on www.verypdf.com to remove this watermark.
562 PART 6: Fun with Crash Dumps
Please purchase PDF Split-Merge on www.verypdf.com to remove this watermark.
AT&T and Intel Syntax 563
PART 7: WINDBG FOR GDB USERS AND VICE VERSA
AT&T AND INTEL SYNTAX
For Windows users AT&T assembly language syntax might be uncomfortable.
Source and destination operands are reversed and negative offsets like -4
are represented in hexadecimal format like 0xfffffffc. It is ok for small assembly lan-
guage fragments but very confusing when looking at several pages of code. Here is an
example of AT&T syntax:
C:\MinGW\bin>gdb a.exe
GNU gdb 5.2.1
Copyright 2002 Free Software Foundation, Inc.
GDB is free software, covered by the GNU General Public License, and you
are welcome to change it and/or distribute copies of it under certain
conditions.
Type "show copying" to see the conditions.
There is absolutely no warranty for GDB. Type "show warranty" for details.
This GDB was configured as "i686-pc-mingw32" (no debugging symbols
found)
(gdb) disas main
Dump of assembler code for function main:
0x4012f0 <main>: push %ebp
0x4012f1 <main+1>: mov %esp,%ebp
0x4012f3 <main+3>: sub $0x8,%esp
0x4012f6 <main+6>: and $0xfffffff0,%esp
0x4012f9 <main+9>: mov $0x0,%eax
0x4012fe <main+14>: add $0xf,%eax
0x401301 <main+17>: add $0xf,%eax
0x401304 <main+20>: shr $0x4,%eax
0x401307 <main+23>: shl $0x4,%eax
0x40130a <main+26>: mov %eax,0xfffffffc(%ebp)
0x40130d <main+29>: mov 0xfffffffc(%ebp),%eax
0x401310 <main+32>: call 0x401850 <_alloca>
0x401315 <main+37>: call 0x4014f0 <__main>
0x40131a <main+42>: leave
0x40131b <main+43>: ret
0x40131c <main+44>: nop
0x40131d <main+45>: nop
0x40131e <main+46>: nop
0x40131f <main+47>: nop
End of assembler dump.
In GDB we can change AT&T flavor to Intel using the following command:
(gdb) set disassembly-flavor intel
Please purchase PDF Split-Merge on www.verypdf.com to remove this watermark.
564 PART 7: WinDbg For GDB Users and Vice Versa
The same function now looks more familiar:
(gdb) disas main
Dump of assembler code for function main:
0x4012f0 <main>: push ebp
0x4012f1 <main+1>: mov ebp,esp
0x4012f3 <main+3>: sub esp,0x8
0x4012f6 <main+6>: and esp,0xfffffff0
0x4012f9 <main+9>: mov eax,0x0
0x4012fe <main+14>: add eax,0xf
0x401301 <main+17>: add eax,0xf
0x401304 <main+20>: shr eax,0x4
0x401307 <main+23>: shl eax,0x4
0x40130a <main+26>: mov DWORD PTR [ebp-4],eax
0x40130d <main+29>: mov eax,DWORD PTR [ebp-4]
0x401310 <main+32>: call 0x401850 <_alloca>
0x401315 <main+37>: call 0x4014f0 <__main>
0x40131a <main+42>: leave
0x40131b <main+43>: ret
0x40131c <main+44>: nop
0x40131d <main+45>: nop
0x40131e <main+46>: nop
0x40131f <main+47>: nop
End of assembler dump.
Unfortunately we cannot change Intel syntax to AT&T in WinDbg so if you are
accustomed to GDB and move to WinDbg you have to get used to the new syntax flavor.
Please purchase PDF Split-Merge on www.verypdf.com to remove this watermark.
Installation 565
INSTALLATION
The primary motivation for this part is to help WinDbg users starting with
FreeBSD or Linux core dump analysis and vice versa to quickly learn GDB debugger com-
mands because most debugging and crash dump analysis principles and techniques are
the same for both worlds. We need to disassemble, dump memory locations, list
threads and their stack traces and so on. GDB users starting with Windows crash dump
analysis can learn WinDbg commands too. Here I start mapping WinDbg commands to
GDB commands and vice versa.
Although GDB is primarily used on Unix systems it is possible to use it on Win-
dows. For this tutorial I use MinGW (Minimalist GNU for Windows):
We can download and install the current MinGW package from SourceForge:
Next we need to download an install GDB package. At the time of this writing
both packages (MinGW-5.1.3.exe and gdb-5.2.1-1.exe) were available at the following
location:
/>1
When installing MinGW package we need to select MinGW base tools and g++
compiler. This will download necessary components for GNU C/C++ environment. When
installing GDB package select the same destination folder we used when installing
MinGW package.
Now we can create the first C program we will use for learning GDB and WinDbg
commands:
#include <stdio.h>
int main()
{
puts("Hello World!");
return 0;
}
Please purchase PDF Split-Merge on www.verypdf.com to remove this watermark.