Tài liệu Master the Gre 2010 - Part 19 pptx
Bạn đang xem bản rút gọn của tài liệu. Xem và tải ngay bản đầy đủ của tài liệu tại đây (136.54 KB, 10 trang )
Know When—and When Not—to Work Backward
If a multiple-choice question asks for a number value, and if you draw a blank as far
as how to set up and solve the problem, don’t panic. You might be able to work
backward by testing the answer choices in turn.
8. A ball is dropped from 192 inches above level ground, and after the third
bounce, it rises to a height of 24 inches. If the height to which the ball
rises after each bounce is always the same fraction of the height reached
on its previous bounce, what is this fraction?
(A)
1
8
(B)
1
4
(C)
1
3
(D)
1
2
(E)
2
3
The correct answer is (D). The fastest route to a solution is to plug in an
answer. Try choice (C) and see what happens. If the ball bounces up
1
3
as high as
it started, then after the first bounce it will rise up
1
3
as high as 192 inches, or 64
inches. After a second bounce, it will rise
1
3
as high, or about 21 inches. But the
problem states that the ball rises to 24 inches after the third bounce. Obviously,
if the ball rises less than that after two bounces, it will be too low after three. So
choice (C) cannot be the correct answer. We can see that the ball must be
bouncing higher than one third of the way, so the correct answer must be a larger
fraction, meaning either choice (D) or choice (E). You’ve already narrowed your
odds to 50%. Try plugging in choice (D), and you’ll see that it works:
1
2
of 192 is 96;
1
2
of 96 is 48; and
1
2
of 48 is 24.
Although it would be possible to develop a formula to answer question 8, it’s not
worthwhile, considering how quickly and easily you can work backward from the
answer choices.
In multiple-choice questions, working backward from numerical answer choices works
well when the numbers are easy and when few calculations are required, as in
question 8. In other cases, applying algebra might be a better way.
Chapter 7: Problem Solving 163
TIP
In multiple-choice Problem
Solving questions, numerical
answer choices are listed in
order of value from least to
greatest. To work backward
from the answer choices, start
with choice (C). If choice (C) is
too great, then you can
assume choices (D) and (E)
are incorrect and try choices
(A) or (B) instead.
www.petersons.com
9. How many pounds of nuts selling for 70 cents per pound must be mixed
with 30 pounds of nuts selling at 90 cents per pound to make a mixture
that sells for 85 cents per pound?
(A) 8.5
(B) 10
(C) 15
(D) 16.5
(E) 20
The correct answer is (B). Is the easiest route to the solution to test the
answer choices? Let’s see. First of all, calculate the total cost of 30 pounds of nuts
at 90 cents per pound: 30 3 .90 5 $27. Now, start with choice (C). 15 pounds of
nuts at 70 cents per pound costs $10.50. The total cost of this mixture is $37.50,
and the total weight is 45 pounds. Now you’ll need to perform some long division.
The average price per pound of the mixture turns out to be between 83 and 84
cents—too low for the 85-cent average given in the question. So you can at least
eliminate choice (C).
You should realize by now that testing the answer choices might not be the most
efficient way to tackle this question. Besides, there are ample opportunities for
calculation errors. Instead, try solving this problem algebraically by writing and
solving an equation. Here’s how to do it. The cost (in cents) of the nuts selling for
70 cents per pound can be expressed as 70x, letting x equal the number that
you’re asked to determine. You then add this cost to the cost of the more
expensive nuts (30 3 90 5 2,700) to obtain the total cost of the mixture, which
you can express as 85(x 1 30). You can state this algebraically and solve for x as
follows:
70 2 700 85 30
70 2 700 85 2 550
150 15
10
xx
xx
x
x
+=+
+=+
=
=
,()
,,
At 70 cents per pound, 10 pounds of nuts must be added in order to make a
mixture that sells for 85 cents per pound.
Look for the Simplest Route to the Answer
In many Problem Solving questions, there’s a long way and a short way to arrive at
the correct answer. When it looks like you’re facing a long series of calculations or a
complex system of equations, always ask yourself whether you can take an easier,
more intuitive route to solving the problem.
PART IV: Quantitative Reasoning164
www.petersons.com
10. What is the difference between the sum of all positive odd integers less
than 32 and the sum of all positive even integers less than 32?
(A) 32
(B) 16
(C) 15
(D) 1
(E) 0
The correct answer is (B). To answer this question, should you add up two long
series of numbers on your scratch paper? In this case, it’s a waste of time, and you
risk committing calculation errors along the way. A smart test-taker will notice a
pattern and use it as a shortcut. Compare the initial terms of each sequence:
even integers: [2, 4, 6, ]. . ., 30
odd integers: [1, 3, 5, ]. . ., 29, 31
Notice that for each successive term, the odd integer is one less than the corre-
sponding even integer. There are a total of 15 corresponding integers, so the
difference between the sums of all these corresponding integers is 15. But the
odd-integer sequence includes one additional integer: 31. So the difference is
16, which is 31 – 15.
Start with What You Know
It’s easy to get lost in Problem Solving questions that are complex and involve
multiple steps to solve. First, take a deep breath and start with information you know.
Then ask yourself what you can deduce from it, leading yourself step-by-step to the
solution.
11. In a group of 20 singers and 40 dancers, 20% of the singers are less than
25 years old, and 40% of the entire group are less than 25 years old. What
portion of the dancers are younger than 25 years old?
(A) 20%
(B) 24%
(C) 40%
(D) 50%
(E) 60%
The correct answer is (D). To answer this question, you need to know (1) the
total number of dancers and (2) the number of dancers younger than 25 years old.
The question provides the first number: 40. To find the second number, start with
what the question provides and figure out what else you know. Keep going, and
eventually you’ll arrive at your destination. Of the whole group of 60, 24 are
younger than 25 years. (40% of 60 is 24.) 20% of the 20 singers, or 4 singers, are
younger than 25 years. Hence, the remaining 20 people younger than 25 must be
dancers. That’s the second number you needed to answer the question. 20 is 50%
of 40.
Chapter 7: Problem Solving 165
www.petersons.com
Search Geometry Problem Figures for Clues
Some GRE geometry problems will be accompanied by figures. They’re there for a
reason: The pieces of information provided in a figure can lead you, step-by-step, to
the answer.
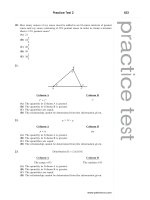
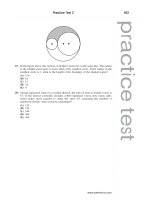
12. If O is the center of the circle in the figure above, what is the area of the
shaded region, expressed in square units?
(A)
3
2
p
(B) 2p
(C)
5
2
p
(D)
8
3
p
(E) 3p
The correct answer is (E). This question asks for the area of a portion of the
circle defined by a central angle. To answer the question, you’ll need to determine
the area of the entire circle as well as what percent (portion) of that area is
shaded. Mine the figure for a piece of information that might provide a starting
point. If you look at the 60° angle in the figure, you should recognize right away
that both triangles are equilateral (all angles are 60°) and, extended out to their
arcs, form two “pie slices,” each one
1
6
the size of the whole pie (the circle). What’s
left are two big slices, each of which is twice the size of a small slice. So the
shaded area must account for
1
3
the circle’s area. You’ve now reduced the problem
to the simple mechanics of calculating the circle’s area and then dividing it by 3.
In an equilateral triangle, all sides are congruent. Mining the figure once again,
notice length 3, which is also the circle’s radius (the distance from its center to its
PART IV: Quantitative Reasoning166
www.petersons.com
circumference). The area of any circle is pr
2
, where r is the circle’s radius. Thus,
the area of the circle is 9p. The shaded portion accounts for
1
3
the circle’s area,
or 3p.
Sketch Your Own Geometry Figure
A geometry problem that doesn’t provide a diagram might be more easily solved if it
had one. Use your scratch paper and draw one for yourself. It will be easier than
trying to visualize it in your head.
13. On the xy-coordinate plane, points R(7,23) and S(7,7) are the endpoints of
the longest possible chord of a certain circle. What is the area of the
circle?
(A) 7p
(B) 16p
(C) 20p
(D) 25p
(E) 49p
The correct answer is (D). There are lots of sevens in this question, which
might throw you off track without at least a rough picture. To keep your thinking
straight, scratch out your own rough xy-grid and plot the two points. You’ll see
that R is located directly below S, so chord RS
is vertical.
Accordingly, the length of RS is simply the vertical distance from 23to7,
which is 10. By definition, the longest possible chord of a circle is equal in
length to the circle’s diameter. The circle’s diameter is 10, and thus its
radius is 5. The circle’s area is p(5)
2
5 25p.
Plug in the Numbers for “Defined Operation” Questions
One of your 14 Problem Solving questions might very well be a so-called defined
operation question. These are odd-looking problems that might strike you as being
difficult. But they’re really not. In fact, the math usually turns out to be very easy.
You’re being tested on your ability to understand what the problem requires you to do,
and then to cross your t’s and dot your i’s as you perform simple arithmetical
calculations.
Chapter 7: Problem Solving 167
ALERT!
GRE geometry figures provide
helpful information for solving
the problem, but they’re not
intended to provide the
answer through visual
measurement. Make sure you
solve the problem by applying
your knowledge, not by
looking at the figure.
www.petersons.com
14. Let be defined for all numbers a, b, c, and d by 5 ac 2 bd.If
x 5
, what is the value of ?
(A) 1
(B) 2
(C) 4
(D) 5
(E) 10
The correct answer is (B). In defining the diamond-shaped figure as “ac 2 bd,”
the question is telling you that whenever you see four numbers in a diamond like
this, you should plug them into the mathematical expression shown in the order
given. The question itself then requires you to perform this simple task twice.
First, let’s figure out the value of x.Ifx is the diamond labeled as x, then a 5 5,
b 5 4, c 5 2, and d 5 1. Now, we plug those numbers into the equation given,
then do the simple math:
x
x
x
=×−×
=−
=
()()52 41
10 4
6
Now we tackle the second step. Having figured out the value of x, we can plug it
into our second diamond, where a 5 6, b 5 10, c 5 2, and d 5 1.Again, plug in the
numbers and do the math:
(6 3 2) 2 (10 3 1) 5 12 2 10 5 2
As you can see, the math is very easy; the trick is understanding what the
question is asking: which is to have you “define” a new math operation and then
carefully plug in the numbers and work out the solution. With a little practice,
you’ll never get a defined operation question wrong.
THE DATA INTERPRETATION FORMAT
Data interpretation is a special Problem Solving format designed to gauge your ability
to read and analyze data presented in statistical charts, graphs, and tables, and to
calculate figures such as percentages, ratios, fractions, and averages based on the
numbers you glean from graphical data.
Expect to find three to five data interpretation questions (possibly in sets of two or
three) mixed in with your other Quantitative Reasoning questions. Each question in a
data interpretation set pertains to the same graphical data. Each question (and each
set) involves either one or two distinct graphical displays. Four types appear on the
GRE most frequently: tables, pie charts, bar graphs, and line charts.
Note the following key features of GRE data interpretation questions:
PART IV: Quantitative Reasoning168
NOTE
Expect 3 to 5 data
interpretation questions on the
exam. Some may appear in
sets pertaining to the same
graphical data.
www.petersons.com
• Important assumptions will be provided. Any additional information that
you might need to know to interpret the figures will be indicated above and below
the figures. Be sure to read this information.
• Some questions might ask for an approximation. This is because the test
makers are trying to gauge your ability to interpret graphical data, not your
ability to crunch numbers to the nth decimal place.
• Many of the numbers used are almost round. This feature relates to the
previous one. The GRE rewards test takers who recognize that rounding off
numbers (to an appropriate extent) will suffice to reach the correct answer.
• Some questions may be long and wordy. Solving a data interpretation
problem may call for multiple steps involving various graphical data, so the
questions can be lengthy. In fact, you may have more trouble interpreting the
questions than the graphical data.
• Bar graphs and line charts are drawn to scale. That’s because visual esti-
mation is part of what’s required to analyze a bar graph or line chart’s graphical
data. However, pie charts will not necessarily be drawn to scale. (You’ll interpret
them strictly by the numbers provided), and visual scale is irrelevant when it
comes to analyzing tables.
• Figures are not drawn to deceive you or to test your eyesight. In bar
graphs and line charts, you won’t be asked to split hairs to determine precise
values. These graphs and charts are designed for a comfortable margin for error
in visual acuity. Just don’t round up or down too far.
• You may need to scroll vertically to see the entire display. Some vertical
scrolling might be required to view the entire display, especially the information
above and below the chart, graph, or table. If so, don’t forget to scroll up and down
as you analyze each question.
The 5-Step Plan
Here’s the 5-step approach that will help you handle any data interpretation question
(or set of questions). Just ahead, we’ll apply this approach to a two-question set.
STEP 1: LOOK AT THE “BIG PICTURE” FIRST
Before plunging into the question(s), read all the information above and below the
figure(s). Look particularly for the following:
• Totals (dollar figures or other numbers)
• Whether the numbers are expressed in terms of hundreds, thousands, or millions
• How two or more figures are labeled
• Whether graphical data is expressed in numbers or percentages
STEP 2: READ THE ENTIRE QUESTION CAREFULLY
Readtheentire question verycarefully.As you doso,dividethequestionintoparts,each
of which involves a distinct step in getting to the answer. Pay particular attention to
what the question asks for. For example:
Chapter 7: Problem Solving 169
NOTE
Data interpretation questions
are most often based on
tables, pie charts, bar graphs,
and line charts. However, you
might encounter some other
type of graphic, so don’t be
surprised to see something
else.
www.petersons.com
• Does the question ask for an approximation or a precise value?
• Does the question ask for a percentage or a raw number?
• Does the question ask for a comparison?
• Does the question ask for an increase or a decrease?
In breaking down the question into tasks, look for a shortcut to save yourself pencil
work.
STEP 3: PERFORM THE STEPS NEEDED TO REACH THE ANSWER
Look for a shortcut to the answer. For questions calling for approximations, round
numbers up or down (but not too far) as you go.
STEP 4: CHECK THE CHOICES FOR YOUR ANSWER
Ifan “approximation”questionasksfora number,find the choiceclosesttoyour answer.
Look for other answer choices that are too close for comfort. If you see any, or if your
solution is nowhere near any of the choices, go to step 5.
STEP 5: CHECK YOUR CALCULATIONS
Check all of your calculations and make sure the size and form (number, percentage,
total, etc.) of your solutionconforms with what the question asks.Check your rounding
technique. Did you round off in the wrong direction? Did you round off too far?
APPLYING THE 5-STEP PLAN
Let’s applythe5-step approachtoa pairofquestions, based onthefollowing tworelated
pie charts.
We’ll perform step 1 before we even look at the first question based on this data.
Step 1: Size up the two charts and read the information above and below them. Notice
that we’re dealing only with one company during one year. Notice also that dollar
PART IV: Quantitative Reasoning170
TIP
Use rounding and estimation
to answer a data
interpretation question—but
only if the question calls for an
approximation.
www.petersons.com
totals are provided, but that the pie segments are all expressed only as percentages.
That’s a clue that your tasks for this set of data might be to calculate dollar amounts
for various pie segments.
Now that you’ve familiarized yourself with the graphical display of data, proceed to
step 2 for the first question.
Step 2: Carefully read the question, but not the five lettered answer choices yet. (This
question is near the lowest level of difficulty; about 85% of test takers would answer it
correctly.)
15. Which of the following pairs of divisions, each pair considered separately,
accounted for more than 50 percent of Company XYZ’s income during the
year?
I. Division A and Division B
II. Division C and Division D
III. Division A and Division C
(A) I only
(B) III only
(C) I and II only
(D) I and III only
(E) I, II, and III
Just by reading the question, you know that it involves only the chart on the left
(“Income”) and that you won’t need to convert percentages into dollar figures. So it’s a
straightforward question that you should not consider skipping. Nevertheless, be sure
to read it very carefully: You’re looking for any pair that accounted for “more than 50
percent” of XYZ’s income, not 50 percent or more. (This distinction makes the dif-
ference between the correct answer choice and an incorrect one, as you’ll soon see.)
Step 3: You need to combine three different percentage pairs (indicated by Roman
numerals I, II, and III). Be careful to combine the correct percentages from the chart
on the left. Here are the results:
I. Division A and Division B (38% + 12% = 50%)
II. Division C and Division D (20% + 30% = 50%)
III. Division A and Division C (38% + 20% = 58%)
Step 4: The only pair among the three that accounted for more than 50% of XYZ’s
income is pair III. Because only pair III meets that criterion, the correct answer must
be (B): “III only.” If you have extra time, go to step 5.
Step 5: Check the pie chart on the left and the three division pairs (I, II, and III)
again to make sure the percentages you used and your addition are correct. Once
you’ve confirmed they are, go on to the next question. The correct answer is (B).
Let’s apply the same five-step approach to a moderately difficult question. (About 50%
of test takers would respond correctly to questions like it.)
Step 1: You’ve already performed this step, so move to step 2.
Chapter 7: Problem Solving 171
NOTE
The Roman numeral format
illustrated in Question 15 is not
used very frequently on the
GRE. Expect no more than one
or two Problem Solving
questions in this format.
www.petersons.com
Step 2: Carefully read the question, but not the five answer choices yet:
16. During year X, by approximately what amount did Division C’s income
exceed Division B’s expenses?
(A) $125,000
(B) $127,000
(C) $140,000
(D) $180,000
(E) $312,000
This question involves three tasks: (1) calculate Division C’s income; (2) calculate
Division B’s expenses; and (3) compute their difference.
There’s no shortcut to these three tasks, although you know from the question stem
that calculating approximate values will probably suffice. Go on to step 3.
Step 3: Division B’s expenses accounted for 26% of XYZ’s total expenses, given as
$495,000. Rounding off these figures to 25% and $500,000, Division B’s expenses
totaled approximately $125,000. Income from Division C sales was 20% of total XYZ
income, given as $1,560,000. Rounding this total down to $1,500,000, income from
Division C sales was approximately $300,000. Income from Division C sales exceeded
Division B’s expenses by approximately $175,000.
Step 4: Scan the answer choices. The only one that’s close to this solution is choice
(D). If you have extra time, go to step 5.
Step 5: Make sure that you started with the right numbers. Did you compare C’s
income with B’s expense (and not some other combination)? If you’re satisfied that the
numbers you used were the right ones and that your calculations are okay, confirm
your response and move on to the next question. The correct answer is (D).
DATA INTERPRETATION STRATEGIES
Applying the five-step approach to the two sample questions in the previous section
highlighted certaintips, techniques, andstrategies fordata interpretation.Here’s alist
of them. (The last one applies to certain other types of graphical data.)
Don’t Confuse Percentages with Raw Numbers
Most data interpretation questions involveraw data as well as proportion—in terms of
either percent, fraction, or ratio.Always ask yourself: “Is the solution to this problem a
rawnumberoraproportionalnumber?”(You can besurethatthetestdesignerswillbait
you with appropriate incorrect answer choices.)
Be Sure to Go to the Appropriate Chart (or Part of a Chart) for Your
Numbers
When itcomes to GREdata interpretation,carelessly referring to the wrongdata isthe
leading cause ofincorrectanswers. To makesure you don’t committhiserror,point your
finger to the proper line, column, or bar on the screen; put your finger right on it, and
don’t move it until you’re sure you’ve got the right data.
PART IV: Quantitative Reasoning172
ALERT!
Be sure to consult the
appropriate portion of
the chart, graph, or table for
the information you need to
answer a data interpretation
question. Your ability to find
the right data is a big part o f
what’s being tested.
www.petersons.com