Research on hydrothermal carbonization (htc) of paper mill sludge, food and forestry wastes effects of process parameters on properties of hydrochar
Bạn đang xem bản rút gọn của tài liệu. Xem và tải ngay bản đầy đủ của tài liệu tại đây (5.63 MB, 119 trang )
VIETNAM NATIONAL UNIVERSITY, HANOI
VIETNAM JAPAN UNIVERSITY
KARUNASENA DHANUKA NAYOMAL
RESEARCH ON HYDROTHERMAL
CARBONIZATION (HTC) OF PAPER MILL
SLUDGE, FOOD AND FORESTRY WASTES EFFECTS OF PROCESS PARAMETERS ON
PROPERTIES OF HYDROCHAR
MASTER'S THESIS
VIETNAM NATIONAL UNIVERSITY, HANOI
VIETNAM JAPAN UNIVERSITY
KARUNASENA DHANUKA NAYOMAL
RESEARCH ON HYDROTHERMAL
CARBONIZATION (HTC) OF PAPER MILL
SLUDGE, FOOD AND FORESTRY WASTES EFFECTS OF PROCESS PARAMETERS ON
PROPERTIES OF HYDROCHAR
MAJOR: ENVIRONMENTAL ENGINEERING
CODE: 8520320.01
RESEARCH SUPERVISORS:
Associate Prof. Dr. CAO THE HA
Dr. VU NGOC DUY
Hanoi, 2021
ACKNOWLEDGMENTS
The work documented in this report was only possible to achieve with the guidance, support
and patience of a number of people that I have the privilege to interact and learn from.
First of all, I would like to express my sincere gratitude towards Associate Professor Cao
The Ha and Doctor Vu Ngoc Duy for the enthusiastic instructions and encouragement
throughout this current study.
Secondly, I take this opportunity to express my gratitude to all the professors, lecturers and
students at the Environmental Engineering program, VNU Vietnam Japan University for
their inspiration during this project.
Finally, I would like to thank my parents for their support and encouragement during this
long period.
Karunasena Dhanuka Nayomal
TABLE OF CONTENTS
LIST OF TABLES .............................................................................................................. i
LIST OF FIGURES ........................................................................................................... ii
LIST OF ABBREVIATIONS ........................................................................................... v
CHAPTER 1 : INTRODUCTION ................................................................................... 1
1.1
Hydrothermal Carbonization of Lignocellulosic Biomass ................................... 3
CHAPTER 2 : LITERATURE REVIEW ....................................................................... 6
2.1
Historical overview of HTC process .................................................................... 6
2.2
Biomass And Thermochemical Processes ............................................................ 7
2.2.1 Thermochemical processes .............................................................................. 7
2.2.2 Biomass: definition, properties, and comparison ........................................... 12
2.3
Overview of HTC Process .................................................................................. 15
2.3.1 Reaction mechanism of HTC with biomass ................................................... 15
2.3.2 The role of water in HTC ............................................................................... 19
2.3.3 Effect of process parameters .......................................................................... 20
2.3.4 Advantages of HTC........................................................................................ 24
2.3.5 Potential uses of HTC coal ............................................................................. 25
2.3.6 Products of HTC ............................................................................................ 27
CHAPTER 3 : MATERIALS AND METHODS .......................................................... 35
3.1
HTC applicable industries .................................................................................. 35
3.1.1 Food and Beverage industry........................................................................... 35
3.1.2 Paper industry................................................................................................. 36
3.1.3 Forestry........................................................................................................... 38
3.2
Materials ............................................................................................................. 40
3.3
Description of the HTC reactor .......................................................................... 41
3.4
Experimental methods and principles ................................................................ 42
3.4.1 pH ................................................................................................................... 43
3.4.2 Electrical Conductivity (EC) .......................................................................... 44
3.4.3 Total Nitrogen (NCASI Method TNTP-W10900) ......................................... 44
3.4.4 Total phosphorus (NCASI Method TNTP-W10900)..................................... 45
3.4.5 Chemical Oxygen Demand (EPA Method 410.3) ......................................... 46
3.4.6 Sample treatment: Moisture removal ............................................................. 47
3.4.7 Ash content and volatile matter calculation .................................................. 48
3.4.8 Calculating gross calorific value .................................................................... 49
CHAPTER 4 : RESULT AND DISCUSSION .............................................................. 51
4.1
Moisture Removal .............................................................................................. 51
4.2
Hydrochar ........................................................................................................... 54
4.2.1 Restaurant Food waste (RFW/R) hydrochar .................................................. 54
4.2.2 Paper mill sludge (PMS/P) hydrochar ........................................................... 57
4.2.3 Saw dust (SD/ S) hydrochar ........................................................................... 61
4.3
Characteristics of hydrochar process water ........................................................ 66
4.3.1 Restaurant food waste (RFW/ R) process water ............................................ 66
4.3.2 Paper mill sludge (PMS/P) process water ...................................................... 71
4.3.3 Saw dust (SD/ S) process water ..................................................................... 76
CONCLUSION ................................................................................................................ 80
REFERENCES ................................................................................................................ 84
APPENDIX....................................................................................................................... 89
LIST OF TABLES
Table 2.1. Characteristics of biomass torrefaction ............................................................. 8
Table 2.2. Characteristics of biomass pyrolysis ................................................................. 9
Table 2.3. Characteristics of biomass gasification ........................................................... 10
Table 2.4. Characteristics of biomass Hydrothermal carbonization ................................. 12
Table 2.5. Chemical analysis and properties of selected types of biomass (Canzana, 2011)
14
Table 2.6. Saturated steam table (Kruse et al.,2013) ....................................................... 22
Table 2.7. Summary of process parameters for HTC process .......................................... 23
Table 2.8. Comparison of reaction conditions and product distributions (Libra et al.,2011)
28
Table 2.9. Distribution of the carbon fraction in the HTC product phases (Marchetti,
2012) .................................................................................................................................. 29
Table 2.10. Examples of solid yields and elementary compositions of HTC-coal from
different substrates (Libra et al.,2011) .............................................................................. 30
Table 2.11. Composition of the process water resulting from HTC (Robbiani, 2013) .... 33
Table 4.1. Moisture content, Amount of dry solid Volatile, ash and Gross caloric values
calculated by equation (5) of biomass feeds ..................................................................... 51
Table 4.2. Proximate analysis of biomass after the hydrothermal carbonization gross
caloric values were calculated by equation (5) n = 3 ........................................................ 52
Table 4.3. Comparison of gross calorific value from the research with literature review 64
Table 4.4. GCVs of the feed and chosen hydrochar samples from ultimate analysis ...... 64
i
LIST OF FIGURES
Figure 1.1. Garbage dump in Giong Rieng district, Kien Giang province and Binh Tu
landfill, Phan Thiet city, Binh Thuan province.( Ministry of Natural Resources and
Environment. Report, 2019). ............................................................................................... 2
Figure 1.2. Friedrich Bergius .............................................................................................. 6
Figure 2.1. Differences between primary and secondary cell wall in plants .................... 15
Figure 2.2. Degradation products and sub products during hydrolysis of lignocellulosic
biomass (Qadariyah et al.,2011) ........................................................................................ 16
Figure 2.3. Comparison of different energy and carbon exploitation schemes for
carbohydrates (Titrici et al.,2007) ..................................................................................... 25
Figure 2.4. Percentage of each product in HTC process .................................................. 28
Figure 2.5. Van Krevelen diagram (Marchetti, 2012) ...................................................... 31
Figure 2.6. Correlation carbon content and calorific value for different substrates
(Oliveira et al.,2013) .......................................................................................................... 32
Figure 3.1. Food waste collecting site, Canada. .............................................................. 35
Figure 3.2. Paper mill sludge, Peninsular Malaysia ......................................................... 36
Figure 3.3. Forestry waste Terrace Community Forest, Northwest British Columbia .... 38
Figure 3.4. Raw dried restaurant food waste, raw dried paper mill sludge and raw dried
saw dust ............................................................................................................................. 40
Figure 3.5. Hydrothermal carbonization reactor with Teflon inner compartment and
stainless steel outer cover. ................................................................................................. 41
Figure 3.6. Carbolite gero laboratory furnace .................................................................. 42
Figure 3.7. Calibration curve for total nitrogen ................................................................ 45
Figure 3.8. Calibration curve for total phosphorus........................................................... 46
Figure 3.9. Calibration curve for Chemical oxygen demand ........................................... 47
Figure 3.10. Thermal analysis procedure for Biomass fuel (Hydrochar) Fixed solid, Ash,
Volatile solid...................................................................................................................... 49
Figure 4.1. Raw biomass feed samples and subsequent hydrochar samples .................... 53
Figure 4.2. The dependence of yield of RFW hydrochar from dried food waste with
temperature and time (n = 3, triplicate) ............................................................................. 54
Figure 4.3. Percentages of total solid content and moisture content of RWFHC with time
and temperature (n = 3, triplicate) ..................................................................................... 55
Figure 4.4. Percentages of Volatile solid content and ash of RWFHC with time and
temperature (n = 3, triplicate) ............................................................................................ 55
ii
Figure 4.5. Gross calorific values of RFWHC with time and temperature (n = 3, triplicate)
56
Figure 4.6. Percent conversion of PMS hydrochar with time and temperature (n = 3,
triplicate) ............................................................................................................................ 57
Figure 4.7. Total solid content and moisture content of PMSHC with time and temperature
(n = 3, triplicate) ................................................................................................................ 58
Figure 4.8. Percentages of Volatile solid content and ash of PMSHC with time and
temperature (n = 3, triplicate) ............................................................................................ 59
Figure 4.9. Gross calorific values of PMSHC with time and temperature (n = 3, triplicate)
59
Figure 4.10. Yield of SD hydrochar with increasing time and temperature at 220oC (n =
3, triplicate) ........................................................................................................................ 61
Figure 4.11. Total solid content and moisture content of SDHC with time and temperature
at 220oC (n = 3, triplicate) ................................................................................................. 62
Figure 4.12. Percentages of Volatile solid content and ash of SDHC with time and
temperature at 220oC (n = 3, triplicate) ............................................................................. 62
Figure 4.13. Gross calorific values of SDHC with time and temperature at 220oC (n = 3,
triplicate) ............................................................................................................................ 63
Figure 4.14. pH of RFW process water with time and temperature (n = 3, triplicate) .... 66
Figure 4.15. COD of RFW process water with temperature and time (n = 3, triplicate) . 67
Figure 4.16. Electrical conductivity of restaurant food waste process water with
temperature and time (n = 3, triplicate) ............................................................................. 68
Figure 4.17. Total nitrogen of RFW process water with temperature and time (n = 3,
triplicate) ............................................................................................................................ 69
Figure 4.18. Total phosphorus of RFW process water with temperature and time (n = 3,
triplicate) ............................................................................................................................ 70
Figure 4.19. pH of PMS process water with temperature and time (n = 3, triplicate) ..... 71
Figure 4.20. Electrical conductivity of PMS process water with temperature and time (n =
3, triplicate) ........................................................................................................................ 72
Figure 4.21. COD of PMS process water with temperature and time (n = 3, triplicate) .. 73
Figure 4.22. Total nitrogen of PMS process water with temperature and time (n = 3,
triplicate) ............................................................................................................................ 74
Figure 4.23. Total phosphorus of PMS process water with temperature and time (n = 3,
triplicate) ............................................................................................................................ 75
Figure 4.24. pH of SD process water with time and temperature at 220oC (n = 3,
triplicate) ............................................................................................................................ 76
iii
Figure 4.25. Electrical conductivity of SD process water with time and temperature at
220oC (n = 3, triplicate) ..................................................................................................... 77
Figure 4.26. COD of SD process water with time and temperature at 220oC (n = 3,
triplicate) ............................................................................................................................ 78
Figure 4.27. Total nitrogen of SD process water with time and temperature at 220oC (n =
3, triplicate) ........................................................................................................................ 79
iv
LIST OF ABBREVIATIONS
13C-NMR:
ASTM:
COD:
EC:
EDS:
FS:
GC-MS:
GCV:
GHG:
HC:
HHV:
HTC:
MC:
MSW:
NCASI:
P/PMS:
PINI:
PMSHC:
R/RFW:
RFWHC:
RINI:
S/SD:
SDHC:
SEM:
SINI:
TN:
TOC:
TP:
US EPA:
VS:
Carbon-13 Nuclear Magnetic Resonance
American Society for Testing and Materials
Chemical Oxygen Demand
Electrical Conductivity
Energy Dispersive X-ray Spectroscopy
Fixed Solid
Gas Chromatography–Mass Spectrometry
Gross Calorific Value
Greenhouse Gas
Hydrochar
Higher Heating Value
Hydrothermal Carbonization
Moisture Content
Municipal Solid Waste
National Council for Air and Stream Improvement
Paper mill Sludge
Initial Sample of Paper mill Sludge
Paper mill Sludge Hydrochar
Restaurant Food Waste
Restaurant food waste hydrochar
Initial Sample of Restaurant Food Waste
Saw dust
Saw dust Hydrochar
Scanning Electron Microscopy
Initial Sample of Saw dust
Total Nitrogen
Total Organic Carbon
Total Phosphorus
United States Environmental Protection Agency
Volatile Solid
v
CHAPTER 1 : INTRODUCTION
After the Doi Moi resolution, Vietnam sees a prosperous future in its economy. The current
economic boom has attracted more and more people into the cities. In 2009 according to
the General Statistics Office of Vietnam, the population in urban areas was 25.59 million
which accounted for 29.74% (Truong, 2018) of the total population. However, it was
forecasted that, in 2025 half of the total population of Vietnam will be living in cities which
is an outcome of the improvements in people’s living standards and the impressive
achievements of the economy. With this great influx, the environmental management of the
cities especially with the solid waste management will turn into a dire state. When the
subsequent changes in spending habits of people generate more and more solid waste, the
well-being of the cities and their citizens will be endangered.
According to the National State of Environment report published by Ministry of Natural
Resources and Environment in 2011, the urban solid waste generation in 2003 was 6.4
million tonnes and it was increased to 12.8 million tonnes in 2008. While the urban solid
waste generation increased by more than 200% the industrial solid waste also increased by
181%. In the year 2003, the industrial solid waste generation was 2.6 million metric tonnes
and in 2008 it was increased to 4.7 million tonnes. Moreover, this report predicted that there
would be a 42-46 % increase in nationwide urban solid waste generation with 17%
contribution from industries (DoNRE, 2011).
In Hanoi, it was estimated that the daily domestic waste generation is 6,500 tons (Phan,
2019). Domestic waste is a result of ordinary day-to-day activities. The main contributors
to the generation of domestic waste are households, schools, markets, restaurants, and
hotels. According to Vietnamese Department of Natural Resources and Environment in
2011, 500-700 tonnes of industrial waste, 150-200 tonnes of hazardous waste, 1500-2000
tonnes of construction and demolition waste, and 9-12 tonnes of medical waste generated
per day in the city. The majority of this domestic waste consists of organic waste which
1
accounts for 40 - 55% and among them, the recyclable potion counts for 8 – 18% (DoNRE,
2011).
The land fillings are the standard practice of solid waste management in Vietnam. Around
76 – 82% of municipal solid waste is treated in landfill sites all over the country everyday
(Truong, 2018). From the total number of 98 landfills and open dumping sites in the
country 16 of them operate according to the regulations (Truong, 2018). The rest of the
sites follow unhygienic methods which are harmful to people and the environment.
Furthermore, with ever-increasing amounts of solid waste, most of the landfill sites in large
cities operate in their full capacities, and extension of the available land is difficult to
achieve due to scarcity of the land in cities.
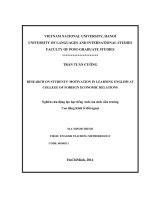
Figure 1.1. Garbage dump in Giong Rieng district, Kien Giang province and Binh Tu
landfill, Phan Thiet city, Binh Thuan province.( Ministry of Natural Resources and
Environment. Report, 2019).
Apart from landfilling, many cities use open burning and incineration to treat solid wastes.
In a few cities, open burning at the landfill site is a common method to reduce the total
volume of waste. Open burning can be seen in rural areas where there aren’t many facilities
to treat or manage the waster. Burning solid waste right in their gardens is a common
practice in many rural houses. However, the open burning of solid waste creates a huge
health risk since it releases pollutants straight into the atmosphere. In some cities, the
2
hospital waste is treated in incinerator facilities. Due to the lack of availability of these
facilities throughout the country, most of the hospital waste ends up in landfills.
In the past decade, solid waste management has undergone numerous changes. According
to the sustainability approach, most of the mentioned waste management practices are
considered to be outdated. Currently, the recycling and recovery of the resources are the
main focus of the waste management systems throughout the world. In that sense, the
organic fraction in municipal solid waste is seen as a source of great potential.
1.1 Hydrothermal Carbonization of Lignocellulosic Biomass
Crude oil is one of the driving factors of current society which is a form of solar energy
captured by plants a long time ago. Due to its finite reserves and environmental difficulties
from emissions of greenhouse gas, (mainly CO2), unstable market prices, limited
availability, and emissions have caused us to look into renewable and alternative energy
sources (Raza, 2011).
Producing energy using biomass is not a new process. Since the beginning of human
civilization starting from wood, humans utilize biomass in various ways to produce energy.
The efficient usage of the organic fraction of solid waste is historically looked upon in
numerous literature reviews. To address this matter a new technology called hydrothermal
processes are being investigated by scientists all over the world. Hydrothermal
carbonization (HTC) has attracted the attention of many countries in past decades. It is a
thermochemical process that converts biomass waste into high valued waste streams. This
process is also known as wet torrefaction due to the usage of wet biomass compared to
other processes like pyrolysis and incineration. The final product is known as hydrochar.
The word hydrochar definition stands for itself. Combination of hydro –water and char
obtained from converting carbon contain organic products into usable products.
Hydrothermal carbonization is a common term used to describe natural phenomena of oil
and coal production by nature in the geological field (Silakova, 2018). It is similar to the
natural process of plants and animal remains turning into coal or crude oil but on a
3
laboratory scale. Moreover, it is one of the suitable processes to manage agricultural,
industrial and municipal waste which contain moisture. The main advantage of this process
is the water use as the thermal reaction medium. In the reactor, the biomass containing
higher moisture content can process without any moisture removal. Thus, able to eliminate
drawbacks such as the need for expensive and energy intensive pretreatment processes,
requirement of the dried feed and necessity of the separate system to treat wet and dry
biomass.
This work is dedicated to hydrothermal carbonization of biomass of three industries that
are responsible for a large percentage of the total solid waste. The restaurant food waste,
paper mill sludge waste and saw dust were treated for improving the properties for use as a
solid fuel. The improved properties of the samples and possibilities of further usage were
also investigated. The influence of the process temperature and reaction time on the
properties of the final product were explored. Consequently, the results of the experimental
work could be further use for the subsequent researches for the possibility of the biomass
for different purposes. Especially hydrothermal carbonization as a method to convert low
valued biomass into solid fuel, the opportunity of the hydrothermal carbonization
application for treating biomass and advantages of such treatment are a handful of them.
The research consists of two parts: a literature study and an experiment. In particular, the
methodologies followed in each section are:
a. Literature study: Chapter 2 has the goal to know how the HTC-process works, what are
its conditions, what are the characteristics of input and output before and after the HTC
carbonization and what are the potential applications and benefits. This section consists of
reading in-depth scientific literature review regarding the global science of HTC process,
the recent researches and the different existent HTC technologies.
b. Experiment: Chapter 3 and 4 mainly focus on the methods that followed in this study to
identify the characteristics of hydrochar and the process water. The novel finding, the
4
reasoning behind some of the observations and the potentiality of the samples as a solid
fuel were also presented.
5
CHAPTER 2 : LITERATURE REVIEW
2.1 Historical overview of HTC process
The history of the HTC process goes back to 1913 when German chemist Friedrich Bergius
(Figure 1.2) described the HTC process for the first time, and it was known as a method to
simulate the natural coal from organic laboratory materials. He, along with Carl Bosch,
received the 1931 Nobel Prize in chemistry as a recognition of their contributions to the
invention and development of high-pressure chemical conversion methods. Specifically,
Bergius explained the effect of hydrogenation on coal and oil formation under high pressure
and temperature (Bergius process). And then, also in 1913, he described the hydrothermal
transformation of cellulose into coal-like materials (Funke et al.,2010).
Figure 1.2. Friedrich Bergius
In the years following the Nobel Prize, other researchers such as Burl and Schmidt also
conducted hydrothermal carbonization experiments on different types of biomass, at
temperatures between 150 °C and 350 °C (Marchetti, 2012). Later, Schuhmacher, who was
also interested in this transition analyzed the effect of pH in HTC reactions and found some
differences, through changes in the basic components (C, H, and O) (Titrici et al.,2007). In
the years that followed, research on this thermochemical process fell into a relatively dim
6
state until the previous decade, when HTC regained much interest as an alternative source
of energy, and hydrothermal carbon conversion processes promise to convert biomass into
sterile fuel (Fink and Andrin, 2011). In fact, in 2006, German scientist Markus Antonietti
looked at the hydrothermal carbonization process in more detail and he and his research
team came up with a simple method for biomass that can be easily converted into coal-like
material when increasing temperature and pressure (Libra et al.,2011). The process
gained popularity among the scientific community as the “black revolution” and
since then researchers have paid much attention to the Hydrothermal carbonization
process. However, despite sudden popularity, the literature on hydrothermal
carbonization and related processes are still limited compared to other thermal
conversion techniques (Libra et al.,2011).
2.2 Biomass And Thermochemical Processes
The process varies from direct burning to converting biomass into some other energy
source. Production of energy using biomass can be categorized into biological treatment
and thermochemical treatment. The biological process involves living organisms such as
bacteria and fungi and the main objective of this process is to oxidize and stabilize the
organic matter and produce valued energy streams (Basso, 2016). The thermal conversion
method mainly weighs on the combustion of the biomass. The main processes are
gasification, pyrolysis, and the co-firing of woody and herbaceous biomass. In thermal
conversion, the content of biomass which is rich in lignocellulose is dried, and use to
generate electricity or convert it into heat by boilers and gasifiers. In the biological process,
the proteins and water-rich biomass turn into compost or energy.
2.2.1 Thermochemical processes
2.2.1.1 Torrefaction
Torrefaction is a thermochemical conversion method that uses biomass as the main input
and produces biochar as the main product while liquid and gases as the byproducts. During
this process, the biochar produced as the organic compound degrades under oxygen-free
7
conditions. Compared with pyrolysis, torrefaction manages to produce higher caloric value
output which can be utilized as high-quality solid fuel (Choo et al.,2020).
Torrefaction can be divided into two categories, namely,
Dry torrefaction
Wet torrefaction
Wet torrefaction is known as the hydrothermal process while dry torrefaction is considered
to be the standard name for torrefaction. During the dry torrefaction, it uses a temperature
range between 200°C and 300°C (Marchetti, 2012), under atmospheric pressure and inert
nitrogen gas atmosphere with the absence of oxygen. This process is also known as the mild
pyrolysis or low-temperature pyrolysis.
Table 2.1. Characteristics of biomass torrefaction
Parameter
Features of torrefaction process
Temperature Range
200oC – 300oC
Reaction time
Several hours to a days
Biomass feed
Any type of dried organic material
Oxidizing agent
No
Advantages
Simple process, less energy intensive
Disadvantages
Low conversion efficiency
Fuel produced
Bio char
2.2.1.2 Pyrolysis
Pyrolysis is another thermochemical process, in which biomass is heated at a temperature
ranging from 450oC to 850oC, in the absence of oxygen and air (Itskos et al.,2016). During
this process, the biomass breaks into different phases and the products coexisting with
solids, liquids, and gasses at the end of the process. The ratio of products is heavily
dependent on the velocity of the process.
8
Conventional pyrolysis is associated with charcoal production. Therefore, it uses a slow
phase to increase the ratio of solid production. When focusing on hydrogen production, it
uses quick exposure to temperature, the process known as fast (or flash) pyrolysis (Choo et
al.,2020), where the biomass is treated in time ranges of few seconds. The main products
are in liquid and/or in the gas phase. Most of these combustible gases can be condensed
into a combustible liquid, called pyrolysis oil (bio-oil), In general, pyrolysis of biomass
produces gaseous permanent gases (CO2, CO, H2, light hydrocarbons). and liquid products
and a solid residue richer in carbon content (Itskos et al.,2016).
Table 2.2. Characteristics of biomass pyrolysis
Parameter
Features of pyrolysis
Temperature Range
450oC – 850oC
Reaction time
From seconds to hours (flash, fast and
slow)
Biomass feed
Small (2mm) dried feed
Oxidizing agent
No
Advantages
Biochar can be used as a soil amendment
or energy carrier, bio-oil can be used as fuel
in engines and turbines.
Disadvantages
High cost of investment, require energy
supply, process water need to post treat
Fuel produced
Bio-oil and biochar
2.2.1.3 Gasification
Gasification is the thermal conversion of organic matter by allowing oxidation and turn
organics into a gaseous product called syngas. The temperature in this process ranges from
high temperatures (>700°C) and the outcome mainly consists of H2, CO, and small amounts
of methane (CH4), water vapor, CO2, N2, and tar (Choo et al.,2020). The oxidant used for
the gasification process can be air, pure oxygen, steam, or a mixture of these gases
9
(Marchetti, 2012). According to the composition of the oxidant, there are two types of
gasifiers and the final product varies with the dimensions of the gasifier.
Air-based gasifiers typically produce a product gas which containing a relatively high
concentration of nitrogen with a low heating value. Oxygen and steam-based gasifiers
produce a product gas containing a relatively high concentration of hydrogen and carbon
monoxide, with a higher heating value (Marchetti, 2012).
Table 2.3. Characteristics of biomass gasification
Parameter
Features of gasification - process
Temperature Range
>700oC
Reaction time
10 – 20 seconds
Biomass feed
Dried and uniform size of feedstock
Oxidizing agent
Air or oxygen
Advantages
High thermal efficiency
Disadvantages
High cost of investment, complex and
sensitive process, biomass feed need to
reduce the its size
Fuel or energy produced
Syngas
2.2.1.4 Hydrothermal conversion processes
All of the hydrothermal processes are performed in a hot compressed water environment.
The main focus of these processes are to maintain the condition that permits the direct
treatment of wet substrates and avoiding any drying pretreatment.
The hydrothermal process is divided into three categories related to the condition
parameters (Basso, 2016).
Hydrothermal liquefaction (HTL)
Hydrothermal gasification (HTG)
Hydrothermal carbonization (HTC)
10
Hydrothermal liquefaction - HTL
Increasing temperature up to 400oC suppresses the amount of solid product and increases
the gas and liquid amounts. These conditions are substantial for hydrothermal liquefaction
where the liquid is the expected outcome. Liquid products resulting from an HTL process
are mainly composed of liquid hydrocarbons and heavy oils.
Hydrothermal gasification – HTG
Further elevation of the temperature favors hydrothermal gasification where the gas is
expected major outcome. The gaseous products are composed of hydrogen (H2), methane
(CH4), carbon dioxide (CO2) and other compounds, that can be both combusted (after a
cleaning procedure, e.g. in a gas turbine, or in a Biomass Integrated Gasification) and used
to produce pure hydrogen (Basso, 2016).
Hydrothermal carbonization – HTC
Hydrothermal carbonization uses temperature between 180oC – 250oC (Marchetti, 2012)
which allows to obtain a very little amount of gas (1-5%) (Basso, 2016) and a larger amount
of solid char. The typical solid products obtained through the chemical decomposition of
the feedstock, resulting in carbon-rich solid material with higher chemical stability.
During the hydrothermal carbonization process, the biomass is completely submerged in
the liquid phase. The entire process undergoes high temperature and autogenous pressure
for several hours. The water remains in liquid form throughout the process due to the higher
pressure along with higher temperatures. When the temperature and pressure rise higher
enough, the water will reach a supercritical state (Marchetti, 2012) in which water behaves
nor a liquid or a gas.
The optimum temperature for the carbonization process revolves around 200 oC which helps
to avoid liquefaction and gasification. Both temperature and pressure have a major
influence during this process. During hydrothermal carbonization, both the oxygen content
(characterized by the O/C ratio) and the hydrogen content (characterized by the H/C ratio)
11
of the material are reduced, leading to an increase in the carbon content (Basso, 2016).
Improving and maintaining the carbon content of the original biomass is a major advantage
of the HTC process.
In summary, the main process conditions for hydrothermal carbonization reactions are
noted as (Marchetti, 2012) :
Biomass surrounded by water in all reactions
The liquid phase water reacts with high pressure (at least saturation pressure).
The temperature range is in the range of 180-250 ° C with a pressure of about 20 bar
The HTC reaction process time is about 1-72 hours.
Table 2.4. Characteristics of biomass Hydrothermal carbonization
Parameter
Features of HTC
Temperature Range
180oC – 220oC
Reaction time
30 minutes to days
Biomass feed
Any type of organic material
Oxidizing agent
No
Advantages
Can use wet biomass without pre-drying,
simple process, the higher conversion
efficiency
Disadvantages
High cost of investment, require energy
supply, process water needs to posttreatment
Fuel produced
Hydrochar
2.2.2 Biomass: definition, properties, and comparison
The definition of biomass according to Encyclopedia of Ecology, 2008 is “The mass of
living organisms, including plants, animals, and microorganisms, or, from a biochemical
perspective, cellulose, lignin, sugars, fats, and proteins”.
12
Biomass is the building block of the fossil fuels and inherits some amount of energy that
later compounds in fossil fuels. Therefore, it can be assumed as a non-fossil organic
material which contains energy. Following are some examples for biomass: plant and
animal matter such as wood from forests, material leftover (by-products) from agricultural
and forestry processes (i.e. rice straw, rice husk, saw dust, sawmill dust, etc.), aquatic plants
and organic industrial, human or animal waste (i.e. MSW, kitchen garbage, animal dung,
excrement, sewage sludge, etc.) (Marchetti, 2012).
This report especially concerns the energy aspect of biomass for the industries such as food
and beverage, forestry and paper in developing countries. These industries build around
biomass and produce organic wastes that don’t have noticeable value and considered as
throw-away material. Depending on the perspective on one hand, the organic waste can be
an annoyance or even a pollutant to the local environment on the other, it can be a renewable
energy source.
With the increasing energy demand of the world, biomass energy has gained much attention
as a renewable energy source. Moreover, it can be redefined as a carbon-neutral energy
source due to the resemblance of natural carbon cycle during the energy extraction process.
When combusted, biomass releases the carbon as CO2 which is absorbed during the growth
of the plant through the photosynthesis and completes the carbon cycle. In addition,
biomass is still the desired provider of energy for basic cooking and heating in rural areas.
In fact, it is the fourth-largest source of energy in the world behind oil, coal, and natural
gas which fulfill 14% of the world's energy demand (Basso, 2016).
As for the environmental benefits of biomass, firstly, it has less effect on the instability of
the carbon cycle since it doesn’t contribute to increasing the amount of CO2 in the
atmosphere, hence global warming. Secondly, its availability as a low-cost energy source.
Thirdly, it can minimize the dependency on fossil fuels, and finally, it has a simple energy
extraction process.
13
The chemical composition of biomass varies with the C, H, O, N, and S levels of the source.
In general, biomass is composed of a mixture of organic molecules, mainly of cellulose (i.e.
glucose polymer), hemicellulose (i.e. a mixture of polysaccharides), and lignin (Marchetti,
2012). Furthermore, each plant species separates itself by the proportion of abovementioned molecules in their cells. For example, hardwoods contain a higher proportion of
cellulose 43-48% and hemicellulose 27-35% while softwoods contain a higher proportion
of lignin 26-33% (Basso, 2016). The following table 2.5 shows the elemental analysis and
the heating value of several biomass sources.
Table 2.5. Chemical analysis and properties of selected types of biomass (Canzana, 2011)
2.2.2.1 Lignocellulosic Biomass
The main constituents of a plant can be divided into four main components cellulose,
hemicellulose, lignin, and water extractives (Raza, 2011). These constituents give structure
integrity for a plant cell and its shape. Among them, cellulose, hemicellulose, and lignin
consist of high molecular weight and larger quantities compared to water extractives. The
relative composition of these constituents varies according to the species of the plant. In
softwood, cellulose content is higher than the grass-type biomass while both cellulose and
hemicellulose are higher in hardwoods.
14
Figure 2.1. Differences between primary and secondary cell wall in plants
The figure 2.1 shows the basic structure of plant cells. The cell wall consists of several
layers that are typical for the plant cell. The middle lamella fills the gaps between layers
and works as a binding agent. Towards inside the primary wall and secondary wall can be
identified. The secondary cell wall consists of three layers namely outer layer – S1, middle
layer – S2, and inner layer – S3 (Raza, 2011).
The outer layer microfibers are structured following a cross-helical pattern (S helix and Z
helix), Moreover, the middle layer and inner layers consist of microfiber and in contrast,
the middle layer has a relatively higher thickness than the outer. In some cases, the
microfibers of the inner layer are replaced by a warty layer in some plant cells. some authors
mention that there is a tertiary wall (T) between S3 and W (Raza, 2011).
2.3 Overview of HTC Process
2.3.1 Reaction mechanism of HTC with biomass
The subcritical temperature promotes a series of reactions that are crucial for the HTC
process. Most of these reactions are similar to the reactions that occur during pyrolysis.
Among them, the hydrolysis reaction which breaks the ester and ether bonds of cellulose
(at T > 200°C), hemicellulose (at T > 180°C), and lignin (at T > 200°C) (Basso, 2016) by
adding water molecules is the major reaction. The pathway for the hydrolysis reaction was
15