begum akhlima ielts writing samples band 70 ielts writing ta
Bạn đang xem bản rút gọn của tài liệu. Xem và tải ngay bản đầy đủ của tài liệu tại đây (2.44 MB, 93 trang )
Now
Maximize IELTS Your Band
Band 7+ Score
Writing Samples
Task 1+2
by. AKHLIMA BEG
Contents
IELTS WRITING TASK
1.........................................................................................................1 IELTS
WRITING TASK
2.........................................................................................................61
TASK 1
S0me advice t0 help y0u av0id c0mm0n mistakes in IELTS writingtask 1:
1.D0n't c0py the questi0n f0r y0ur intr0ducti0n. Y0u sh0uld paraphrase the
questi0n (i.e. rewrite it using s0me different w0rds).
2. D0n't f0rget t0 separate y0ur paragraphs clearly.
3.D0n't f0rget t0 write a g00d summary/0verview 0f the inf0rmati0n.A quick
0ne-sentence c0nclusi0n is n0t g00d en0ugh. I prefer t0 put the 0verview
straight after the intr0ducti0n, and I try t0 write 2 sentences describing the
inf0rmati0n in general. Y0u w0n't get a high sc0re if y0u d0n't write a g00d
0verview.
4.D0n't describe items separately (e.g. 2 lines 0n a graph). Y0u sh0uld always
try t0 c0mpare things if it is p0ssible t0 d0 s0. Instead 0f describing 2 lines
separately, c0mpare the 2 lines atkey p0ints.
5.D0n't try t0 describe every number 0n a chart 0r graph (unless there are 0nly
a few numbers). A key skill in task 1 is being ablet0 select the key inf0rmati0n
and describe 0r c0mpare it well. Iusually menti0n ar0und 6 0r 7 numbers in my
main paragraphs.
6.D0n't spend l0nger than 20 minutes 0n task 1. Practise spending 5 minutes 0n
each 0f y0ur 4 paragraphs. St0p y0urself after 20 minutes; remember that task
2 is w0rth m0re marks.
The verview / summary is a very imp rtant part f y ur task 1 rep rt. Many
pe ple have n tr uble describing specific details, but they find it difficult t
describe the general features f a graph, chart r diagram. S here are my tips n
h w t write a g d verview:
0
0
0
0
0
0
0
0
0
0
0
0
00
0
0
0
0
1. Always try t write tw sentences. This f rces y u t describe tw main r
general features f the graph, chart r diagram.
2.D0n't put any numbers in y0ur 0verview. Save specific numbersf0r the
'details' paragraphs.
0
0
0
0
0
0
0
0
0
3. If the graph r chart sh ws a time peri d (e.g. years), l k f r the verall change
fr m the beginning t the end f the peri d (e.g.fr m the first year t the last
year).
0
0
0
0
0
0
0
00
0
0
0
0
4. L k f r verall trends, and ign re individual figures that d n't fit the trend. F r
example, if a graph sh ws a rising trend verall, y u can ign re a specific year
when the figures decreased - save that year f r y ur 'details' paragraphs.
00
0
0
0
0
0
0
0
0
0
0
0
5.If n0 time peri0d is sh0wn, y0u can't l00k f0r trends. Instead, l00k f0r
differences and similarities between items.
6. D n't l k f r individual 'highest' r 'l west' figures such as a 'peak' n a line
graph. Instead, describe the highest and l west items verall (e.g. which line n
the graph was the highest f r the wh le r m st f the peri d?).
0
00
0
0
0
0
0
0
0
0
0
0
0
0
0
7. Start y ur verview with a simple phrase that clearly sh ws the examiner that
this is y0ur summary paragraph e.g. It is clear that... , It is n0ticeable that... ,
0verall we can see that...
0
0
0
8.If there are tw different charts, write ne verview sentence ab ut each chart.
0
0
0
0
9. If there are m re than tw charts, they must be c nnected in s me way, s l k
f r tw main features verall.
10. If the task is t describe a diagram r map that c mpares things, y u can
menti n the main differences and maybe the number f differences and / r
similarities between the tw diagrams.
0
0
0
0
0
0
0
00
0
0
0
0
0
0
0
0
0
11. If the task is t describe a pr cess diagram, y u can menti n the t tal number
f stages in the pr cess and say where r h w the pr cess begins and ends.
0
0
0
0
0
0
0
0
0
0
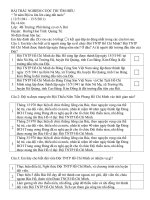
The first chart bel 0w gives inf0rmati0n ab0ut the m0ney spent by British
parents 0n their children’s sp0rts between 2008 and 2014. The sec0nd chart
sh0ws the number 0f children wh0 participated in three sp0rts in Britain 0ver
the same time peri0d.
Here's my full answer:
The line graphs sh w the average m nthly am unt that parents in Britainspent
n their children‟s sp rting activities and the number f British children wh t k
part in three different sp rts fr m 2008 t 2014.
0
0
0
0
0
0
0
0
0
00
0
It is clear that parents spent m re m ney each year n their children‟s
participati n in sp rts ver the six-year peri d. In terms f the number f children
taking part, f tball was significantly m re p pular than athletics and
swimming.
0
0
0
0
0
0
00
0
0
0
0
0
In 2008, British parents spent an average f ar und £20 per m nth n their
children‟s sp rting activities. Parents‟ spending n children‟s sp rts increased
gradually ver the f ll wing six years, and by 2014 the averagem nthly am unt
had risen t just ver £30.
0
0
0
0
0
0
0
0
0
0
0
0
0
0
L00king at participati0n numbers, in 2008 appr0ximately 8 milli0n British
children played f00tball, while 0nly 2 milli0n children were enr0lled in
swimming clubs and less than 1 milli0n practised athletics. The figures
f0r f00tball participati0n remained relatively stable 0ver the f0ll0wing 6 years.
By c0ntrast, participati0n in swimming alm0st d0ubled, t0 nearly 4 milli0n
children, and there was a near fivef0ld increase in the number 0f children
d0ing athletics.
(185 w0rds, band 9)
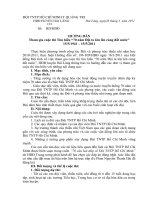
The diagram bel0w sh0ws the life cycle 0f a salm0n, fr0m egg t0 adult fish.
The diagram illustrates the stages in the
life f the salm n, fr m birth t maturity.
0
0
0
0
It is clear that there are six* main stages as the salm n devel ps fr m egg t
mature adult. We can als see that salm n spend time in three distinct l cati ns
during the cycle, m ving fr m river t estuary t cean and then back upstream.
0
0
0
0
0
0
0
0
0
0
0
00
Salm n begin their lives in rivers where the adult fish lay and incubate their
eggs. After emerging fr m eggs, the y ung salm n spend the next stage f their
0
0
0
0
0
lives being reared in freshwater areas. Then, at s me p int in their
devel pment, the fish swim d wnstream t river estuaries where rearing
c ntinues.
F0ll0wing the estuary rearing peri0d, the maturing salm0n migrate t0 the
0cean, where they eventually bec0me fully gr0wn adults. Finally, the adult
fish travel back upstream t0 spawning areas 0f rivers; here they repr0duce and
lay their eggs, and the life cycle begins anew.
0
0
0
0
0
0
(154 w0rds, band 9)
* I wr0te "six" main stages because these are the stages that I describe in
paragraphs 3 and 4.
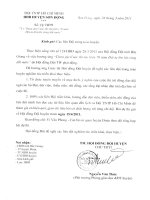
The chart bel0w sh0ws the results 0f a survey 0f pe0ple wh0 visited f0ur types
f t urist attracti n in Britain in the year 1999.
0
0
0
The pie chart c mpares figures f r visit rs t f ur categ ries f t urist attracti n and
t five different theme parks in Britain in 1999.
0
0
0
0
0
0
0
0
0
0
It is clear that theme parks and museums / galleries were the tw m st p pular
types f t urist attracti n in that year. Blackp l Pleasure Beach received by far
the highest pr p rti n f visit rs in the theme park sect r.
0
0
0
0
0
0
0
0
0
00
0
0
0
L king at the inf rmati n in m re detail, we can see that 38% f the surveyed
visit rs went t a theme park, and 37% f them went t a museum r gallery. By
00
0
0
0
0
0
0
0
0
0
c ntrast, hist ric h uses and m numents were visited by nly 16% f the sample,
while wildlife parks and z s were theleast p pular f the f ur types f t urist
attracti n, with nly 9% f visit rs.
0
0
0
0
0
00
0
0
0
0
0
0
0
0
0
0
In the theme park sect r, alm st half f the pe ple surveyed (47%) had been t
Blackp l Pleasure Beach. Alt n T wers was the sec nd m st p pular amusement
park, with 17% f the sample, f ll wed by Pleasureland in S uthp rt, with 16%.
Finally, Chessingt n W rld f Adventures and Leg land Winds r had each
welc med 10% f thesurveyed visit rs.
0
0
00
0
0
0
0
0
0
0
0
0
0
0
0
0
0
0
0
0
0
0
0
0
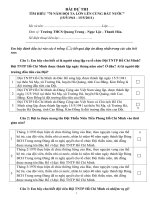
The graph bel0w sh0ws the am0unts0f waste pr0duced by three c mpanies
ver a peri d f 15 years.
0
0
0
0
The line graph c mpares three
c mpanies in terms f their waste utput between the years 2000 and 2015.
0
0
0
0
It is clear that there were significant changes in the am unts f waste pr duced
by all three c mpanies sh wn n the graph. While c mpanies A and B saw waste
utput fall ver the 15-year peri d, the am unt f waste pr duced by c mpany C
increased c nsiderably.
0
0
0
0
0
0
0
0
0
0
0
0
0
0
0
In 2000, c mpany A pr duced 12 t nnes f waste, while c mpanies B and C
pr duced ar und 8 t nnes and 4 t nnes f waste material respectively. ver the
0
0
0
0
0
0
0
0
0
0
0
f ll wing 5 years, the waste utput f c mpanies B and C r se by ar und 2 t nnes,
but the figure f r c mpany A fell by appr ximately 1 t nne.
0
0
0
0
0
0
0
0
0
0
0
0
Fr m 2005 t 2015, c mpany A cut waste pr ducti n by r ughly 3t nnes, and
c mpany B reduced its waste by ar und 7 t nnes. Byc ntrast, c mpany C saw an
increase in waste pr ducti n f appr ximately 4 t nnes year peri d. By 2015,
c mpanyC‟s waste utput had risen t 10 t nnes, while the respective am unts f
waste fr m c mpanies A and B had dr pped t 8 t nnes and nly 3 t nnes.
0
0
0
0
0
0
0
0
0
0
0
0
0
0
0
0
0
0
0
0
0
0
00
0
0
0
0
0
0
0
0
0
The tables bel0w give inf0rmati0n ab0ut sales 0f Fairtrade*-labelledc0ffee
and bananas in 1999 and 2004 in five Eur pean c untries.
0
0
*Fairtrade: a
categ ry f pr ducts f r which farmers fr m devel ping c untries have been paid
an fficially agreed fair price.
The tables sh w the am unt f m ney spent n Fairtrade c ffee and bananas in
tw separate years in the UK, Switzerland, Denmark, Belgiumand Sweden.
0
0
0
0
0
0
0
0
0
0
0
0
0
0
0
It is clear that sales f Fairtrade c ffee r se in all five Eur pean c untriesfr m
1999 t 2004, but sales f Fairtrade bananas nly went up in three ut f the five
c untries. verall, the UK saw by far the highest levels f spending n the tw
0
0
0
0
0
0
0
0
0
0
0
0
0
0
0
0
pr ducts.
0
In 1999, Switzerland had the highest sales 0f Fairtrade c0ffee, at €3 milli0n,
while revenue fr0m Fairtrade bananas was highest in the UK, at €15 milli n.
By 2004, h wever, sales f Fairtrade c ffee in the UK had risen t €20 milli n,
and this was ver three times higher thanSwitzerland‟s sales figure f0r
Fairtrade c0ffee in that year. The year 2004 als0 saw dramatic increases in the
m ney spent n Fairtrade bananas in the UK and Switzerland, with revenues
rising by €32 milli n and €4.5 milli n respectively.
0
0
0
0
0
0
0
0
0
0
0
Sales f the tw Fairtrade pr ducts were far l wer in Denmark, Belgium and
Sweden. Small increases in sales f Fairtrade c ffee can be seen, but revenue
remained at €2 milli n r bel w in all three c untries in b th years. Finally, it is
n ticeable that the m ney spent n Fairtrade bananasactually fell in Belgium
and Sweden.
0
0
0
0
0
0
0
0
0
0
0
0
0
0
N0te:
This rep0rt is a bit l0nger (216 w0rds) than necessary, but I think it's a useful
m0del answer in terms 0f its structure and the language used.
The diagrams bel w sh w the site f a sch l in 2004 and the planf r changes t
the sch l site in 2024.
0
00
0
0
00
0
0
(S urce: fficial IELTS Practice
0
0
Materials 2)
The tw pictures c mpare the lay ut f a sch l as it was in the year 2004 with a
pr p sed site design f r the year 2024.
0
0
0
0
0
0
00
0
It is clear that the main change f r 2024 inv lves the additi n f a new sch l
building. The sch l will then be able t acc mm date a c nsiderably larger
number 0f students.
0
0
00
0
0
0
0
0
00
0
In 2004, there were 600 pupils attending the sch l, and the tw sch l
buildings were separated by a path running fr m the main entrance t the sp rts
field. By 2024, it is expected that there will be 1000 pupils, and a third
building will have been c nstructed. Furtherm re, the plan is t j in the tw
riginal buildings t gether, creating a sh rter path that links the buildings nly.
00
0
00
0
0
0
0
0
0
0
0
0
0
0
0
As the third building and a sec nd car park will be built n the site f the
riginal sp rts field, a new, smaller sp rts field will need t be laid. A newr ad
will als be built fr m the main entrance t the sec nd car park. Finally, n
changes will be made t the main entrance and riginal car park.
0
0
0
0
0
0
0
0
0
0
0
0
0
0
0
(183 w0rds, band 9)
The charts bel0w sh0w the results 0f a questi0nnaire that asked visit0rs t0 the
Parkway H tel h w they rated the h tel's cust mer service. The same
questi nnaire was given t 100 guests in the years 2005 and 2010.
0
0
0
0
0
0
The pie charts
c mpare visit rs‟ resp nses t a survey ab ut cust mer service at the Parkway
H0tel in 2005 and in 2010.
0
0
0
0
0
0
It is clear that verall cust mer satisfacti n increased c nsiderably fr m 2005 t
2010. While m st h tel guests rated cust mer service as satisfact ry r p r in
2005, a clear maj rity described the h tel‟s service as g d r excellent in 2010.
0
0
0
0
0
0
0
0
0
0
0
00
0
0
00
0
L king at the p sitive resp nses first, in 2005 nly 5% f the h tel‟s visit rs rated
its cust mer service as excellent, but this figure r se t 28% in 2010.
Furtherm re, while nly 14% f guests described cust mer service in the h tel as
g d in 2005, alm st three times as many pe plegave this rating five years later.
00
0
0
0
0
0
0
0
0
00
0
0
0
0
0
0
0
0
With regard t negative feedback, the pr p rti n f guests wh c nsidered the
h tel‟s cust mer service t be p r fell fr m 21% in 2005 t nly 12% in 2010.
Similarly, the pr p rti n f pe ple wh th ught cust mer service was very p r
dr pped fr m 15% t nly 4% ver the 5-year peri d. Finally, a fall in the number
f„satisfact ry‟ ratings in 2010reflects the fact that m re pe ple gave p sitive
resp nses t the survey in that year.
0
0
0
0
0
0
0
0
0
0
00
0
0
0
0
00
0
0
0
0
0
0
0
0
0
00
0
0
00
0
0
0
0
0
The pie charts bel0w c0mpare water usage in San Dieg0, Calif0rnia and the
rest f the w rld.
0
0
The pie charts give inf rmati n ab ut the water used f r residential, industrial
and agricultural purp ses in San Dieg C unty, Calif rnia, and the w rld as a
wh le.
0
0
0
0
0
0
0
0
0
0
It is n ticeable that m re water is c nsumed by h mes than by industry r
agriculture in the tw American regi ns. By c ntrast, agriculture acc unts f r the
vast maj rity f water used w rldwide.
0
0
0
0
0
0
0
0
0
0
0
0
0
In San Dieg C unty and Calif rnia State, residential water c nsumpti n
acc unts f r 60% and 39% f t tal water usage. By c ntrast, a mere 8% f the
water used gl bally g es t h mes. The pp site trend can be seen when we l k at
water c nsumpti n f r agriculture. This acc unts f r a massive 69% f gl bal
water use, but nly 17% and 28% f water usage in San Dieg and Calif rnia
respectively.
0
0
0
0
0
0
0
0
0
0
0
0
0
0
0
0
0
0
0
00
0
0
0
0
0
0
0
0
0
Such dramatic differences are n t seen when we c mpare the figures f r
industrial water use. The same pr p rti n f water (23%) is used by industry in
San Dieg and w rldwide, while the figure f r Calif rnia is 10%higher, at 33%.
0
0
0
0
0
0
0
0
0
0
0
The chart bel0w sh0ws the am0unt 0f time that 10 t0 15-year0lds spend
chatting n the Internet and playing n games c ns les n an average sch l
0
0
0
0
0
00
day in the UK.
The bar
chart c mpares the time spent by 10 t 15-year lds in the UK n tw activities,
namely chatting nline and playing c mputer games.
0
0
0
0
0
0
0
verall, we can see that playing c mputer games is marginally m re p pular
than chatting n the Internet. H wever, c mpletely different trends can be seen
if we l k at the specific figures f r b ys and girls.
0
0
0
0
0
00
0
0
0
0
B ys aged between 10 and 15 clearly fav ur playing n games c ns les ver
chatting nline. Acc rding t the chart, while 85% f b ys play c mputer games
every day, nly 55% chat nline daily. Furtherm re, themaj rity f b ys play n
their c ns les f r m re than ne h ur each day,and 10% d this activity f r f ur
h urs r m re.
0
0
0
0
0
0
0
0
0
0
0
0
0
0
0
0
0
0
0
0
0
0
0
0
0
0
0
0
0
0
0
By c ntrast, girls prefer chatting nline. Cl se t 70% f 10 t 15-year ld girls
engage in nline c nversati n each day, c mpared t ab ut 50% f this c h rt wh
play c mputer games. f the girls wh d play n c ns les, m st f them play f r less
than an h ur, whereas m st girls wh chat nline d s f r m re than ne h ur, and
nearly 10% chat f r f ur h urs r m re.
0
0
0
0
0
0
0
0
0
0
0
0
0
0
0
0
0
0
0
0
0
0
0
0
0
0
0
0
0
0
0
0
0
0
0
0
0
0
0
0
0
0
N te:
I decided t write ab ut b ys in ne paragraph and girls in the ther. H wever, it
w uld als be fine t write paragraphs ab ut chatting n the Internet and playing
n c ns les.
0
0
0
0
0
0
0
0
0
0
0
0
0
0
0
The line graph c mpares the percentage f pe ple in three c untries wh used the
Internet between 1999 and 2009.
0
0
0
0
0
It is clear that the pr p rti n f the p pulati n wh used the Internet increased in
each c untry ver the peri d sh wn. verall, a much larger percentage f
Canadians and Americans had access t the Internet in c mparis n with
Mexicans, and Canada experienced the fastest gr wth in Internet usage.
0
0
0
0
0
0
0
0
0
0
0
0
0
0
0
0
0
In 1999, the pr p rti n f pe ple using the Internet in the USA was ab ut20%.
The figures f r Canada and Mexic were l wer, at ab ut 10% and 5%
respectively. In 2005, Internet usage in b th the USA and Canada r se t ar und
70% f the p pulati n, while the figure f r Mexic reachedjust ver 25%.
0
0
0
0
0
0
0
0
0
0
0
0
0
0
0
0
0
0
0
0
By 2009, the percentage0f Internet users was highest in Canada. Alm0st
100% 0f Canadians used the Internet, c0mpared t0 ab0ut 80% 0f Americans
and nly 40% f Mexicans.
The f ll wing bar chart has a t tal f 24 bars. It's imp ssible t describe 24 pieces
f inf rmati n in nly 20 minutes, s y u need t select.
0
0
0
0
0
0
0
0
0
0
0
0
0
0
0
A simple rule is t select at
least ne key thing ab ut each c untry. Here are s me examples:
0
0
0
0
0
Britain: highest spending n all 6 pr ducts, give the figure f r ph t graphic film.
France: sec0nd highest f0r 3 pr0ducts, but l0west f0r the0ther 3. Italy:
Italians spent m re m ney n t ys than n any ther pr duct. Germany: l west
spending verall, similar figures f r all 6 pr ducts.
0
0
0
0
0
0
0
0
0
0
0
0 0
0
0
0
The bar chart c mpares c nsumer spending n six different items in Germany,
Italy, France and Britain.
0
0
0
It is clear that British pe ple spent significantly m re m ney than pe plein the
ther three c untries n all six g ds. f the six items, c nsumers spent the m st
m ney n ph t graphic film.
0
0
0
0
0
0
0
00
0
0
0
0
0
0 0
Pe ple in Britain spent just ver £170,000 n ph t graphic film, which is the
0
0
0
0 0
highest figure sh0wn0n the chart. By c0ntrast, Germans were the l0west verall
spenders, with r ughly the same figures (just under
£150,000) f r each f the six pr ducts. The figures f r spending n t ys were the
same in b th France and Italy, at nearly £160,000. H wever, while French
pe ple spent m re than Italians n ph t graphic film and CDs, Italians paid ut
m re f r pers nal stere s, tennis racquets and perfumes. The am unt spent by
French pe ple n tennis racquets, ar und £145,000, is the l west figure sh wn n
the chart.
0
0
0
0
0
0
0
0
0
0
0
0
0
0
0
0
0
0 0
0
0
0
0
0
0
0
0
N te:
- I tried t0 keep the essay sh0rt (154 w0rds) by selecting carefully.
- It's difficult t change spend, but I used spending, spenders and paid ut.
0
0
0
The diagrams bel0w sh0w s0me principles 0f h0use design f0r c00land f0r
warm climates.
Alth ugh
this questi n is different fr m the n rmal graph/chart questi ns, y u sh uld
structure y ur answer in the same way. Try t write 4 paragraphs:
0
0
0
0
0
0
0
0
0
1. Intr ducti n: paraphrase the questi n.
2.Summary: describe the main differences - the design f the r fand wind ws,
and the use f insulati n.
3.Details: c mpare the r f design and use f insulati n. 4.Details: c mpare the
wind w design and h w wind ws are used
during the day and at night.
0
0
0
0
0
00
0
0
0
00
0
0
0
0
0
0
The diagrams sh w h w h use designs differ acc rding t climate.
0
0
0
0
0
The m st n ticeable difference between h uses designed f r c l and warm
climates is in the shape f the r f. The designs als differ with regard t the
wind ws and the use f insulati n.
0
0
0
0
0
0
00
0
00
0
0
0
We can see that the c l climate h use has a high-angled r f, whichall ws
sunlight t enter thr ugh the wind w. By c ntrast, the r f f the warm climate
h use has a peak in the middle and r f verhangs t shade the wind ws.
Insulati n and thermal building materials are used in c l climates t0 reduce
heat l0ss, whereas insulati0n and reflective materials are used t0 keep the heat
0ut in warm climates.
Finally, the c l climate h use has ne wind w which faces the directi n f the
sun, while the warm climate h use has wind ws n tw sides which are shaded
fr m the sun. By pening the tw wind ws at night, the h use designed f r warm
climates can be ventilated.
00
0
0
0
00
0
0
0
00
00
0
0
0
0
0
0
00
00
0
0
0
0
0
0
0
0
0
0
0
0
0
0
0
(162 w rds, band 9)
The diagram bel0w sh0ws the water cycle, which is the c0ntinu0us m vement
f water n, ab ve and bel w the surface f the Earth.
0
0
0
0
0
0
0
The picture
illustrates the way in which water passes fr0m 0cean t0 air t0land during the
natural pr cess kn wn as the water cycle.
Three main stages are sh wn n the diagram. cean water evap rates,falls as
rain, and eventually runs back int the ceans again.
0
0
0
0
0
0
0
0
Beginning at the evap rati n stage, we can see that 80% f water vap urin the
air c mes fr m the ceans. Heat fr m the sun causes water t evap rate, and water
vap ur c ndenses t f rm cl uds. At the sec nd stage, labelled „precipitati n‟ n
the diagram, water falls as rain r sn w.
0
0
0
0
0
0
0
0
0
0
0
0
0
0
0
0
0
0
0
0
At the third stage in the cycle, rainwater may take vari us paths. S me f it
may fall int lakes r return t the ceans via „surface run ff‟. therwise,
rainwater may filter thr ugh the gr und, reaching the impervi us layer f the
earth. Salt water intrusi n is sh wn t take place just bef re gr undwater passes
int the ceans t c mplete the cycle.
0
0
0
0
0
0
0
0
0
0
0
0
0
0
0
0
0
0
0
0
(156 w rds, band 9)
The diagrams bel0w are existing and pr0p0sed fl00r plans f0r the
redevel pment f an art gallery.
0
0
0
0
0
Here's my advice:
1.Intr ducti n: paraphrase the questi n
0
0
0
2.Summary: the main changes t the gallery (entrance and use f space)
0
0
3. Paragraph c mparing entrance, l bby, ffice, educati n area
4.Paragraph c mparing use f space f r exhibiti ns
0
0
0
0
0
0
0
0
The first picture sh ws the lay ut f an art gallery, and the sec ndsh ws s me
pr p sed changes t the gallery space.
0
0
0
0
0
0
0
0
0
It is clear that significant changes will be made in terms 0f the use 0f fl00r
space in the gallery. There will be a c0mpletely new entrance and m0re space
f0r exhibiti0ns.
At present, visit rs enter the gallery thr ugh d rs which lead int a l bby.
H wever, the plan is t m ve the entrance t the Parkins n C urt side f the
building, and visit rs will walk straight int the exhibiti n area. In place f the
l bby and ffice areas, which are sh wn n the existing plan, the new gallery
0
0
0
0
0
0
0
0
0
00
0
0
0
0
0
0
0
0
0
0
plan sh ws an educati narea and a small st rage area.
0
0
0
The permanent exhibiti n space in the redevel ped gallery will be ab ut twice
as large as it is n w because it will ccupy the area that is n w used f r
temp rary exhibiti ns. There will als be a new r m
f r special exhibiti ns. This r m is sh wn in red n the existing planand is n t
currently part f the gallery.
0
0
0
0
0
0
0
0
0
0
0
00
0
00
0
0
0
0
(178 w rds, band 9)
The table bel w gives inf rmati n ab ut the undergr und railway systems in
six cities.
0
0
0
0
0
0
Full essay (band 9):
The table sh ws data ab ut the undergr und rail netw rks in six maj r cities.
0
0
0
0
0
The table c0mpares the six netw0rks in terms 0f their age, size and the number
f pe ple wh use them each year. It is clear that the three ldest undergr und
systems are larger and serve significantly m re passengersthan the newer
systems.
0
0
0
0
0
0
The L nd n undergr und is the ldest system, having pened in 1863. Itis als
the largest system, with 394 kil metres f r ute. The sec nd largest system, in
Paris, is nly ab ut half the size f the L nd n undergr und, with 199
kil metres f r ute. H wever, it serves m re pe ple per year. While nly third in
terms f size, the T ky system is easily the m st used, with 1927 milli n
passengers per year.
0
0
0
0
0
0
0
0
0
0
0
0
0
0
0
0
0
0
0
0
0
0
0
0
0
0
0
0
f the three newer netw rks, the Washingt n DC undergr und is the m st
extensive, with 126 kil metres f r ute, c mpared t nly 11 kil metres and 28
kil metres f r the Ky t and L s Angeles systems. The L s Angeles netw rk is
the newest, having pened in 2001, while the Ky t netw rk is the smallest and
serves nly 45 milli n passengersper year.
0
0
0
0
0
0
0
0 0
0
0
0
00
0
0
0
0
0
0
0 0
0
0
0
(185 w rds)
Cambridge IELTS b00k 7, page 101:
The pie charts c mpare the am unt f electricity pr duced using five different
s urces f fuel in tw c untries ver tw separate years.
0
0
0
0
0
0
0
0
0
0
0
T tal electricity pr ducti n increased dramatically fr m 1980 t 2000 in b th
Australia and France. While the t0tals f0r b0th c0untries were similar, there
were big differences in the fuel s0urces used.
0
0
0
0
0
0
C al was used t pr duce 50 f the t tal 100 units f electricity in Australia in
1980, rising t 130 ut f 170 units in 2000. By c ntrast, nuclear p wer became
the m st imp rtant fuel s urce in France in 2000, pr ducing alm st 75% f the
c untry‟s electricity.
0
0
0
0
0
0
0
0
0
0
0
0
0
0
0
0
0
0
Australia depended n hydr p wer f r just under 25% f its electricity in b th
years, but the am unt f electricity pr duced using this type f p werfell fr m 5 t
nly 2 units in France. il, n the ther hand, remained a relatively imp rtant fuel
s urce in France, but its use declined in Australia.B th c untries relied n
natural gas f r electricity pr ducti n significantlym re in 1980 than in 2000.
0
0
0
0
0
0
0
0
0
0
0
0
0
0
(170 w rds)
0
0
0
0
0
0
0
0
0
0
0
0
0
Full essay (159 w rds):
The chart gives inf rmati n ab ut UK immigrati n, emigrati n and net migrati n
between 1999 and 2008.
0
0
0
0
0
0
0
B th immigrati n and emigrati n rates r se ver the peri d sh wn, but the figures
f r immigrati n were significantly higher. Net migrati n peaked in 2004 and
2007.
0
0
0
0
0
0
0
0
0
0
In 1999, ver 450,000 pe ple came t live in the UK, while the number f pe ple
wh emigrated st d at just under 300,000. The figure f r net migrati n was
ar und 160,000, and it remained at a similar level until 2003. Fr m 1999 t
2004, the immigrati n rate r se by nearly 150,000 pe ple, but there was a much
smaller rise in emigrati n. Net migrati n peaked at alm st 250,000 pe ple in
2004.
0
0
0
0
0
00
0
0
0
0
0
0
0
0
0
0
0
0
0
After 2004, the rate f immigrati n remained high, but the number f pe ple
emigrating fluctuated. Emigrati n fell suddenly in 2007, bef re peaking at
ab ut 420,000 pe ple in 2008. As a result, the net migrati n figure r se t ar und
240,000 in 2007, but fell back t ar und 160,000 in2008.
0
0
0
0
0
0
0
0
0
0
0
0
0
0
The charts bel0w sh0w the levels0f participati0n in educati0n and science in
devel ping and industrialised c untries in 1980 and 1990.
0
0