The use of oxygen reserve index in one-lung ventilation and its impact on peripheral oxygen saturation, perfusion index and, pleth variability index
Bạn đang xem bản rút gọn của tài liệu. Xem và tải ngay bản đầy đủ của tài liệu tại đây (1.4 MB, 11 trang )
(2021) 21:319
Sagiroglu et al. BMC Anesthesiology
/>
Open Access
RESEARCH
The use of oxygen reserve index in one-lung
ventilation and its impact on peripheral oxygen
saturation, perfusion index and, pleth variability
index
Gonul Sagiroglu1, Ayse Baysal2* and Yekta Altemur Karamustafaoglu3
Abstract
Background: Our goal is to investigate the use of the oxygen reserve index (ORi) to detect hypoxemia and its relation with parameters such as; peripheral oxygen saturation, perfusion index (PI), and pleth variability index (PVI) during one-lung ventilation (OLV).
Methods: Fifty patients undergoing general anesthesia and OLV for elective thoracic surgeries were enrolled in an
observational cohort study in a tertiary care teaching hospital. All patients required OLV after a left-sided doublelumen tube insertion during intubation. The definition of hypoxemia during OLV is a peripheral oxygen saturation
(SpO2) value of less than 95%, while the inspired oxygen fraction (FiO2) is higher than 50% on a pulse oximetry
device. ORi, pulse oximetry, PI, and PVI values were measured continuously. Sensitivity, specificity, positive and negative predictive values, likelihood ratios, and accuracy were calculated for ORi values equal to zero in different time
points during surgery to predict hypoxemia. At Clinicaltrials.gov registry, the Registration ID is NCT05050552.
Results: Hypoxemia was observed in 19 patients (38%). The accuracy for predicting hypoxemia during anesthesia
induction at ORi value equals zero at 5 min after intubation in the supine position (DS5) showed a sensitivity of 92.3%
(95% CI 84.9–99.6), specificity of 81.1% (95% CI 70.2–91.9), and an accuracy of 84.0% (95% CI 73.8–94.2). For predicting hypoxemia, ORi equals zero show good sensitivity, specificity, and statistical accuracy values for time points of
DS5 until OLV30 where the sensitivity of 43.8%, specificity of 64%, and an accuracy of 56.1% were recorded. ORi and
SpO2 correlation was found at DS5, 5 min after lateral position with two-lung ventilation (DL5) and at 10 min after OLV
(OLV10) (p = 0.044, p = 0.039, p = 0.011, respectively). Time-dependent correlations also showed that; at a time point
of DS5, ORi has a significant negative correlation with PI whereas, no correlations with PVI were noted.
Conclusions: During the use of OLV for thoracic surgeries, from 5 min after intubation (DS5) up to 30 min after the
start of OLV, ORi provides valuable information in predicting hypoxemia defined as SpO2 less than 95% on pulse
oximeter at FiO2 higher than 50%.
Keywords: One lung ventilation, Hypoxemia, Oxygen reserve index, Perfusion index, Pleth variability index
Introduction
One‑lung ventilation and thoracic surgeries
*Correspondence:
2
Pendik District Hospital, Clinic of Anesthesiology and Reanimation,
Pendik, 34980 Istanbul, Turkey
Full list of author information is available at the end of the article
There is an ongoing investigation to provide advanced
monitoring techniques during thoracic surgeries that
require one-lung ventilation (OLV). For patients with
© The Author(s) 2021. Open Access This article is licensed under a Creative Commons Attribution 4.0 International License, which
permits use, sharing, adaptation, distribution and reproduction in any medium or format, as long as you give appropriate credit to the
original author(s) and the source, provide a link to the Creative Commons licence, and indicate if changes were made. The images or
other third party material in this article are included in the article’s Creative Commons licence, unless indicated otherwise in a credit line
to the material. If material is not included in the article’s Creative Commons licence and your intended use is not permitted by statutory
regulation or exceeds the permitted use, you will need to obtain permission directly from the copyright holder. To view a copy of this
licence, visit http://creativecommons.org/licenses/by/4.0/. The Creative Commons Public Domain Dedication waiver (http://creativeco
mmons.org/publicdomain/zero/1.0/) applies to the data made available in this article, unless otherwise stated in a credit line to the data.
Sagiroglu et al. BMC Anesthesiology
(2021) 21:319
a possible diagnosis of lung tumor, the surgical team
performs either a video-assisted thoracoscopy (VATS)
or thoracotomy surgical procedures. The anesthesiologists perform OLV in a lateral decubitus position after a
double-lumen tube (DLT) insertion during tracheal intubation. There is usually a request from the surgeon for a
collapsed lung where they perform the operative procedure in a surgical field. The lower, dependent lung is ventilated, whereas the upper, non-dependent lung collapses
when opening the chest. There is perfusion in this lung,
causing a transpulmonary shunt without ventilation. The
transpulmonary shunt in the non-dependent lung is the
main reason for hypoxemia during OLV. This hypoxemia
in the upper deflated lung causes a physiological mechanism called hypoxic pulmonary vasoconstriction (HPV)
which is responsible for diverting blood flow from the
non-ventilated lung to the ventilated lung. Therefore,
HPV causes a decrease in ventilation-perfusion mismatch and improves arterial oxygenation [1–4]. There
are other causes of hypoxemia [2, 3, 5]. Despite the correct placement of the DLT, hypoxemia occurs in approximately 10 to 25% of patients and routine use of flexible
brochoscopy for positioning of the DLT decreased the
incidence of hypoxemia [3, 5].
Definition of hypoxemia during one‑lung ventilation
The definition of hypoxemia during OLV is a peripheral
oxygen saturation (SpO2) value of less than 95% while
the inspired oxygen fraction (FiO2) is 50% or higher on a
pulse oximetry device [4]. Mild hypoxemia is considered
where SpO2 values are between 95 and 90% meanwhile,
arterial partial pressure of oxygen (PaO2) values from
arterial blood gas analysis show values of 75–60 mmHg.
Severe hypoxemia refers to a S
pO2 value of less than 90%
and corresponds to PaO2 values of less than 60 mmHg [3,
4]. A derivative of arterial oxygen saturation can be measured peripherally as SpO2 using a non-invasive monitoring device called pulse oximetry. This device measures
the level of PaO2 in the range of 0 to 100 mmHg where
FiO2 value is equal to 21%. However, a pulse oximetry
device cannot consistently detect desaturation when FiO2
is greater than 50% [2, 3, 5].
Pulse oximetry versus oxygen reserve index for detection
of hypoxemia and hyperoxemia
The Oxygen Reserve Index (ORi) is a multiwavelength
pulse oximeter, and it provides continuous analysis of PaO2 values of moderate hyperoxia at a range of
100–200 mmHg [2–9]. This device can measure several
oximeter-related parameters including; ORi, SpO2, perfusion index (PI), and perfusion pleth variability (PVI). The
multiwave pulse co-oximetry device can provide a calculated ORi for pulse oximetry values greater than 98%. If
Page 2 of 11
we could give an example, it would be an incidence where
a falling PaO2 value approaches 100 mmHg, and a SpO2
value is higher than 98%. The multiwave oximeter device
measures an ORi value that decreases and approaches
a value of 0.24 [9]. This observation in a previous study
provided data that ORi may provide information in both
clinical situations where there is an impending hypoxic
state or an unintended hyperoxic state [6–10]. ORi
parameter offers a value that ranges between “1,” which
shows a significant oxygen reserve, to “0,” which reveals
no oxygen reserve. ORi begins to increase from 0.00 at a
PaO2 value of 100 mmHg and reaches a plateau of 1.00 at
a PaO2 value of 200 mmHg.
Other oximeter parameters: perfusion index (PI), and pleth
variability index (PVI)
PI is an indicator of the relative strength of the pulsatile
signal from a pulse oximetry device. A higher PI value
shows that the pulsatile movement increases, and peripheral circulation at the sensor site improves accordingly.
The PVI is a relative variability in the pleth waveform
and provides a value between 0 and 100 in a noninvasive
measurement from a pulse oximetry device. PVI is an
automatic measurement of the dynamic change in PI that
occurs during a complete respiratory cycle [11, 12].
Main objective of the study
The main objective of this study is to investigate the
effects of ORi parameter on hemodynamical parameters
(heart rate and blood pressure) and oximeter-related
parameters such as; peripheral oxygen saturation, PI, and
PVI during elective thoracic surgeries requiring OLV and
general anesthesia.
Methods
Patients and settings
The investigators performed a prospective observational cohort study in 14 months on patients requiring
elective thoracic surgery for open lung resection via a
thoracotomy or VATS at the Trakya University School
of Medicine Hospital, Edirne, Turkey. The investigators
conducted the study between 2020 and 2021. After the
Hospital Ethics Committee (TÜTF-BAEK 2020/108), the
investigators recruited patients for this clinical study. Out
of a total of 59 patients, 50 patients with a diagnosis of
lung tumor underwent either VATS or open thoracotomy.
The surgical procedures during these operations include;
either lobectomy, pneumonectomy, lung biopsy, or
wedge resection. The Human Research Ethics Committee of Trakya University Medical Faculty, Edirne, Turkey
approved this clinical study protocol. The investigators
collected written informed consent from patients or their
relatives for this clinical study during preoperative visits.
Sagiroglu et al. BMC Anesthesiology
(2021) 21:319
The study is registered in the Clinicaltrials.gov registry,
and our Registration ID is NCT05050552. The pulmonary function tests, including the percentage of expected,
forced expired volume during the first second (FEV1%),
the ratio of FEV1/FVC% (percentage of expected forced
vital capacity to F
EV1) were done in some patients with
a possible diagnosis of severe lung disease because of the
global pandemia in 2020 and 2021. Patients with FEV1
between 30 and 80% and F
EV1/FVC ratio of < 70% were
considered as having a moderate level of chronic obstructive pulmonary disease as per literature. These patients
were included whereas, severely restricted patients were
excluded [2, 3].
Inclusion criteria included; patients at ages between 22
and 80 years old, American Society of Anesthesiologists
Physical Status (ASA-PS) risk groups of 1 to 3, surgical
procedures of either open lung resection with thoracotomy or VATS, general anesthesia including sevoflurane
inhalational anesthesia during maintanence, the use of
DLT and OLV. Exclusion criteria include; refusal to participate in a study, history of severe asthma, preoperative
renal insufficiency (creatinine >
114 umol/L); preoperative liver dysfunction (aspartate amino transferaseAST > 40 U/L, alanine amino transferase-ALT > 40 U/L);
previous history of coronary or vascular disease or heart
failure with an ejection fraction less than 40%, lung function study showing an FEV1 less than 50%, history of
severe chronic respiratory disease of the non-operated
lung, pregnancy, history of previous pulmonary resection
and hemoglobinopathies [8, 9, 13].
The anesthetic management, definition of hypoxemia
and collected data during OLV
The investigators did not administer drugs for premedication to prevent hypoxemia-related events. After admitting a patient to the operating theatre, anesthesiologists
applied electrocardiogram, noninvasive blood pressure
and pulse oximetry monitoring devices, and measured
these parameters continuously. The monitored parameters include; heart rate (HR), mean arterial pressure
(MAP), systolic blood pressure (SBP), diastolic blood
pressure (DBP), and
SpO2. The anesthesiologists provided general anesthesia using intravenous doses of
propofol (Pofol, Fresenius Pharmaceutical, Turkey), 2 to
3 mg/kg, rocuronium (Esmeron, Organon Pharmaceuticals, USA) at a dose of 0.6 mg/kg, and fentanyl (Janssen
fentanyl, Janssen Pharmaceutical, Belgium) at a dose of
2 to 3 mcg/kg. The anesthesiologist placed a 20 Gauge
radial artery catheter on all patients and connected it to
a disposable pressure transducer to provide continuous
monitoring following the induction of anesthesia. During
tracheal intubation, a left Robertshaw DLT was used. The
anesthesiologist used a flexible broncoscopy for correct
Page 3 of 11
positioning of DLT in supine and lateral decubitus positioning. For anesthetic maintenance, anesthesiologists
used inhalational anesthetic of sevoflurane (Sevorane,
Abbott Pharmaceutical, USA) at an end-tidal concentration of 1 to 2% and intravenous fentanyl boluses at a dose
of 0.5 to 1 microgram/kg every hour. The hemodynamical
stability was maintained during the surgical procedures
where keeping HR between 60 and 100 beats/minute and
keeping MAP between 60 and 80 mmHg. During surgery,
intravenous rocuronium was used every hourly at a dose
of 0.05 mg/kg. All patients received an intravenous infusion of lactated Ringer’s solution at a dose of 10 ml/kg/hr.
Hemodynamical and oximeter-related data of HR,
MAP, SBP, DBP, SpO2, PaO2, ORi, PI, and PVI values
were recorded at thirteen different time points during
anesthesia induction and maintenance of the surgery.
Radical-7 Pulse CO-Oximeter is used to measure oximeter parameters of ORi, PI, and PVI (Masimo Inc., Irvine,
CA, USA). During the collection of these parameters,
the investigators measured peripheral oxygen saturation
using a Pulse CO-Oximetry probe. For other oximeterrelated parameters, the Rainbow R1 25-L probe was
used, a product of the same company [8, 9]. Baseline
values of ORi provide data before preoxygenation, and
afterward, patients were pre-oxygenated with 100% oxygen. Therefore, the list of time points for collection of
data include as follows; first, during the patient’s arrival
to the operating room in the supine position breathing
room air (basal), during preoxygenation with 100% oxygen in the supine position (preoxygenation), 5 min after
tracheal intubation during two-lung ventilation in the
supine position (ORiDS5), 5 min after placing the patient
in a lateral position with two-lung ventilation (ORiDL5),
at 1 min after OLV placement (OROLV1), and afterwards; at 2 min (OROLV120), 5 min (OROLV5), 10 min
(OROLV10), 15
min (OROLV15), 30
min (OROLV30),
45 min (OROLV45), 60 min (OROLV60) and 90 min after
OLV placement (OROLV90) [8, 9, 13, 14].
After general anesthesia induction and intubation, the
anesthesiologists provided mechanical ventilation, and
two lung ventilation in the supine position required the
settings of a tidal volume of 8–10 mL/kg, inspiration to
expiration ratio of 1:2, and respiratory rate of 10–12/min,
without positive end-expiratory pressure (PEEP). During
operation, the surgical team provided a lateral decubitus
position before incision and the anesthesiologist initiated
OLV after positioning. The dependent lung was ventilated with a tidal volume of 6–8 mL/kg, I: E ratio of 1:2,
respiratory rate of 12–14/min with an unchanged F
iO2 of
0.5 with an Aestiva 3000 ventilator (Datex-Ohmeda Inc.
Madison, U.S.A.) [6, 15]. During surgery, the anesthesiologists were responsible for the anesthesia maintenance
with the use of anesthetic agents such as; inhalational
Sagiroglu et al. BMC Anesthesiology
(2021) 21:319
anesthesia of sevoflurane, intravenous rocuronium maintenance dose of 0.05 mg/kg every hourly, and intravenous
fentanyl maintenance dose of 1 to 2 mcg/kg.
Hypoxemia during OLV is a S
pO2 value of less than
95% while the F
iO2 is 50% or greater on a pulse oximetry device [4, 5, 9]. The anesthesiologist who conducts the
anesthesia during surgery was responsible for increasing FiO2, using bag-mask ventilation of 100% for a while,
implementing an alveolar recruitment maneuver, or using
continuous positive airway pressure to the collapsed lung
during a desaturation of S
pO2 value less than 95% [2, 3, 8,
9, 11, 13]. A flexible broncoscopy was present during the
whole surgical procedure to detect malpositioning of the
DLT. The investigators recorded the duration of surgery,
anesthesia, and duration of OLV.
The management of hypoxemic events and other
unwanted events during surgery
The anesthesiologists provided oxygen titration depending mainly on the SpO2 values in our study group of
patients. The data collectors were usual residents in anesthesiology. The residents performed a blood gas analysis
at DL5 time point only. The reason for the abscence of
this routine arterial blood gas analysis during thoracic
surgeries was a recent colloborative decision of our hospital and anesthesiology department to decrease medical
costs. In addition, although arterial blood gases analysis
is crucial to document the exact measurement of oxygenation via PaO2 values, it is impractical to obtain real-time
values during an episode of hypoxemia [8, 9].
After induction, patients were routinely ventilated with
50% FiO2 (50% oxygen + 50% air mixture, 1 l/minute
fresh gas flow). The anesthesiologist was responsible for
keeping SpO2 values greater than 94. For this purpose,
necessary adjustments in F
iO2 values and mechanical
ventilation parameters as well as necessary maneuvers
were performed to provide better oxygenation. The incidence of thromboembolic complications, arrhythmias,
pneumonia, the duration of hospital and intensive care
unit stay were recorded [9, 11, 13–18]. Intravenous
ephedrine (Ephedrine, Osel Pharmaceutical, Turkey) at
a dose of 10 mg bolus injections were considered if SBP
was less than 90 mmHg. Hypotension was defined as a
decrease in MAP more significant than 20% after anesthesia induction and treated with intermittent bolus
doses of 5 mg ephedrine. The definition of hypotension
was based on previous studies [12].
Summary of surgical procedure
Surgical resection was performed through a posterolateral thoracotomy. A suspicious tumor was located, and
if possible all necessary frozen section samples were
obtained for pathological evaluation. At the end of the
Page 4 of 11
operation, the suspicious mass was removed from its
location. The necessary suturing, aspiration, and irrigation of fluids and blood were performed [14, 15, 18].
The ethical considerations
Trakya University Faculty of Medicine University Ethical
Committee agreed and approved the study in February
2020. All patients approved the fully informed written
consent to participate in the study. The participants had
confidentially during the study process and were able
to withdraw from the research process at any time. The
investigators discussed any expected benefits or potential
harm for the research in detail.
Statistical analysis
The investigators used an SPSS 15.0 (Statistical Package for Sciences, USA) program to analyze the data of
our clinical study. Data were presented as mean ± SD
and numbers (percentages), as indicated. Normality was
tested with the Kolmogorov-Smirnov test. Some parameters are reported as median (interquartile range [IQR],
25th to 75th percentile). Sensibility, specificity, positive and negative predicted values, likelihood ratios, and
their respective confidence intervals were obtained from
a two-by-two contingency table for the validity of ORi
equals to zero during different moments before and after
OLV was achieved to predict the first hypoxemia (SpO2
value of < 95%) episode after OLV [8, 9, 13]. The proportion of true positives and true negatives in all evaluated
cases was considered to be accurate. The level of statistical significance was a p-value of less than 0.05. For calculation of sample size, a hypoxemia rate of 30% after OLV,
and a 10% precision at 95% confidence intervals, an alpha
error of 0.05, and a power of 80%, the number of patients
for the study was calculated as 28 patients [8, 13, 14].
Results
The investigators performed the clinical study on 50
patients in 14 months duration. The median age of the
whole group was 53 years (22–80). There were 28 males
and 22 females. The data presented in Table 1 provides
demographic information, co-morbidities, pulmonary
function tests of 26 patients with possible moderate to
severe lung disorders, surgical approach and type of surgery. Pulmonary function tests were not obtained from
all patients due to the COVID-19 pandemic. Hemodynamic and oximeter data that are described in methods
section were continuously monitored and collected at
several phases of anesthesia and surgery. The residents
performed arterial blood gas analysis at only one time
point which is DL5 time. The residents were responsible
to record pulse oximetry and other oximeter values for
detection of hypoxemic episodes.
Sagiroglu et al. BMC Anesthesiology
(2021) 21:319
Page 5 of 11
Table 1 Demographic data and operation characteristics of
undergoing elective thoracic surgery with open lung ventilation
Age, (year)
55.46 ± 13.85
Height, (cm)
168.5 ± 8.43
Weight, (kg)
77.76 ± 16.1
Body mass index, (kg/m2)
27.54 ± 6.17
Gender, n (%)
Female
22 (44)
Male
28 (56)
ASA-PS, n (%)
I
5 (10)
II
27,854)
III
18 (36)
FVC, (mL)
2.87 ± 0.68
FEV1
2.3 ± 0.59
Smoking, n (%)
34 (68)
COPD, n (%)
11 (22)
Hypertension, n (%)
17 (34)
Diabetes mellitus, n (%)
8 (16)
Coronary artery disease, n (%)
6 (12)
Right side intervention, n (%)
24 (48)
Surgical approach, n (%)
Thoracotomy
27 (54)
VATS
23 (46)
Type of surgery, n (%)
Lung biopsy
12 (24)
Wedge resection
19 (38)
Lobectomy
14 (28)
Pneumonectomy
5 (10)
Duration of operation, (min)
71.3 ± 37.59
ASA-PS American Society of Anesthesiologists-physical status, BMI Body mass
index, COPD Chronic obstructive pulmonary disease, FVC Forced vital capacity,
FEV1 Forced expiratory volume fist second, VATS Video assisted; thoracoscopic
surgery
Table 2 shows the data analysis of ORi equals to 0 for
predicting hypoxemia at different time points during
anesthesia induction and maintenance. The accuracy for
predicting hypoxemia during anesthesia induction at ORi
value equals zero at DS5 showed a sensitivity of 92.3%
(95% CI 84.9–99.6), specificity of 81.1% (95% CI 70.2–
91.9), and an accuracy of 84.0% (95% CI 73.8–94.2).
The accuracy for predicting hypoxemia during anesthesia induction at ORi equals zero at 5 min after placing the patient in a ORiDL5 showed a sensitivity of
69.2%, specificity of 83.3%, and an accuracy of 76.0%.
The 95% confidence interval (CI) values are presented
in Table 2. In this table, the data analysis shows that;
for predicting hypoxemia, ORi equals to zero show
good sensitivity, specificity and accuracy statistical
values for time points of DS5 until OLV30 where sensitivity of 43.8%, specificity of 64%, and an accuracy of
56.1% were recorded. These findings correlated to the
previous reports that HPV increases and intrapulmonary shunting decreases after the start of OLV within
30 to 60 min [4, 8, 13, 14].
Overall, from a total of 50 patients in the study group,
19 patients (38%) developed hypoxemia defined as S
pO2
values of less than 95% at or higher than FiO2 value of
50% during the surgical procedure. At the time point
of DS5, ORi equals to 0 value was observed in 12 of the
19 patients (63.16%) who presented with hypoxemia. At
other time points this hypoxemia was observed as follows; DL5; 11 patients (22%), OLV1; 8 patients (16%),
OLV2; 9 patients (18%), OLV5 12 patients (24%) and
OLV10 15 patients (30%).
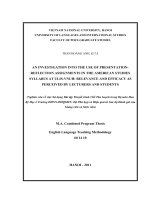
In Fig. 1, data analysis provides representative trends
of ORi and S
pO2 values in a continuous graph at thirteen different time points during the anesthesia induction and maintenance of the surgery. This correlation
showed that; a strong correlation between ORi and S
pO2
was found at time points of DS5 (r = 0.286, p = 0.044),
DL5 (r = 0.293, p =
0.039), and, at OLV10 (r = 0.360,
p = 0.011). Therefore, Fig. 1 also supports the relationship
between SpO2 values and ORi equals to zero values for
predicting hypoxemia during anesthesia induction and
maintanence.
Later, we evaluated the representative trends of the
ORi and PI values and the ORi and PVI values at different time points during anesthesia induction and maintenance of thoracic surgeries. These are represented in
Figs. 2 and 3.
For hemodynamical and oximeter parameters including; HR, MAP, SBP, DBP,
SpO2 values, a correlation
between these parameters were not found in the statistical analysis (p > 0.05). In our study, we demonstrated a
time-dependent correlation between PVI and MAP at
the time point of OLV90, indicating that PVI showed a
relation to MAP at a late stage of the thoracic surgical
procedure.
In our study, we investigated the ORi and PVI values
at different time points during anesthesia induction and
maintenance of thoracic surgery and our findings show
that fluid deficit or fluid overload causes changes in PI
and PVI values. This is observed in our representative
trend graphs in Figs. 2 and 3. Our study provides valuable
data for the investigation of correlations between ORi
and PI, and PVI. Our study provides data that at a time
point of DS5, there is a significant negative correlation
with PI (r = − 0.332, p = 0.019), whereas; no correlations
with PVI were noted.
Table 3 shows the median values and interquartile
range of PI and PVI values at different measurement
points during the study. The analysis of correlations
between these PI and PVI values showed a correlation
between PI and PVI values at the time point of ORiDL5
Sagiroglu et al. BMC Anesthesiology
(2021) 21:319
Page 6 of 11
Table 2 The data analysis of ORi equals to zero and accuracy for predicting hypoxemia during OLV at different time points of surgery
Sensitivity
Specificity
PPV
NPV
PLHR
NLHR
Accuracy
Preoxygenation (95% CI)
0.15 (0.1–0.3)
91.9 (84.3–99.5)
40 (26.4–53.6)
75.6 (63.6–87.5)
1.9 (1.9–5.7)
0.9 (0.8–1)
72 (59.6–84.4)
ORIDS5 = 0
(95% CI)
92.3 (84.9–99.6)
81.1 (70.2–.91.9)
63.2 (49.8–76.5)
96.8 (91.9–100)
4.9 (1.1–10.9)
0.1 (0.1–0.2)
84 (73.8–94.2)
ORIDL5 = 0
(95% CI)
69.2 (56.4–82)
83.3 (73–93.7)
81.8 (71.1–92.5)
71.4 (58.9–84)
4.2 (1.4–9.7)
0.4 (0.2–0.5)
76 (64.2–87.8)
OROLV1 = 0
(95% CI)
63.6 (50.3–77)
75 (63–87)
66.7 (53.6–79.7)
72.4 (60–84.8)
2.6 (1.8–6.9)
0.5 (0.3–0.6)
70 (57.3–82.7)
OROLV2 = 0
(95% CI)
65.2 (52–78.4)
70.4 (57.7–83)
68.2 (55.3–81.1)
70.4 (57.7–83)
2.2 (1.9–6.2)
0.5 (0.4–0.6)
69.4 (56.6–82.2)
OROLV5 = 0
(95% CI)
56.5 (42.8–70.3)
66.7 (53.6–79.7)
59.1 (45.5–72.7)
64.3 (51–77.6)
1.7 (0.7–2.7)
0.7 (0.5–0.8)
62 (48.5–75.5)
OROLV10 = 0
(95% CI)
56 (42.2–70)
64 (50.7–77.3)
60.9 (47.3–74.4)
59.3 (50–72.9)
1.6 (0.6–2.6)
0.7 (0.6–0.8)
60 (46.4–73.6)
OROLV15 = 0
(95% CI)
52.2 (38–66.3)
68 (54.8–81.2)
60 (46.1–73.9)
60.7 (46.9–74.5)
1.6 (0.6–2.7)
0.7 (0.6–0.8)
60.4 (46.6–74.3)
OROLV30 = 0
(95% CI)
43.8 (29.7–57.8)
64 (50.4–77.6)
43.8 (29.7–57.8)
64 (50.4–77.6)
1.2 (0.2–2.2)
0.9 (0.8–1)
56.1 (42.1–70.1)
OROLV45 = 0
(95% CI)
40 (23.3–56.7)
72.2 (57–87.5)
54.5 (37.6–71.5)
59.1 (42.3–75.9)
1.4 (0.3–2.7)
0.8 (0.7–1)
57.6 (40.7–74.4)
OROLV60 = 0
(95% CI)
53.3 (35.8–70.9)
68.8 (52.4–85.1)
61.5 (44.4–78.7)
61.1 (43.9–78.3)
1.7 (0.4–3)
0.7 (0.5–0.8)
61.3 (44.1–78.4)
OROLV90 = 0
(95% CI)
50 (25.5–75)
66.7 (43.6–90)
71.4 (49.3–93.6)
44.4 (20.1–68.8)
1.5 (0.2–4.3)
0.8 (0.5–0.9)
56.3 (31.9–80.6)
ORi Oxygen reserve index, OR Oxygen reserve, OLV One-lung ventilation, PPV Positive predictive value, NPV Negative predictive value, PLHR Positive likelihood
ratio, NLHR Negative likelihood ratio, CI Confidental interval, ORiDS5 ORi under mechanical ventilation 5 min after intubation in supine position, ORiDL5 ORi under
mechanical ventilation 5 min after positioning in the lateral decubitus position, OROLV1 ORi after 1 min of OLV, OROLV2 ORi after 2 min of OLV, OROLV5 ORi after 5 min
of OLV, OROLV10 ORi after 10 min of OLV, OROLV15 ORi after 15 min of OLV, OROLV30 ORi after 30 min of OLV, OROLV45 ORi after 45 min of OLV, OROLV60 ORi after
60 min of OLV, OROLV90 ORi after 90 min of OLV
Fig. 1 The representative trends of oxygen reserve index (ORi) and peripheral oxygen saturation ( SpO2) values at different time points during
surgery
Sagiroglu et al. BMC Anesthesiology
(2021) 21:319
Page 7 of 11
Fig. 2 The oxygen reserve index (ORi) and perfusion index (PI) values at different time points of surgery
Fig. 3 The oxygen reserve index (ORi) and pleth variability index (PVI) values at different time points of surgery
(r = − 0.284, p = 0.046). In other time points, correlations
were not demonstrated (p > 0.05).
Table 4 provides time-dependent correlations between
ORi with S
pO2, PI, and PVI. These correlation analysis
provide data that ORi has significant correlations with
pO2, PI and PVI at some specific time points and these
S
include; at time point of DS5; (r = 0.286, p = 0.044), DL5
(r = 0.293, p = 0.039), and OLV10; ORi has a significant
correlation with SpO2 (r = 0.360, p = 0.011), at time point
of DLS5; ORi has a significant negative correlation with
Sagiroglu et al. BMC Anesthesiology
(2021) 21:319
Page 8 of 11
Table 3 The median values and interquartile range of perfusion
index (PI) and pleth variability index (PVI) values at different
measurement points of surgery
PI (r = − 0.332, p = 0.019), whereas; 3- no correlations
with PVI was noted.
Time (min)
Discussion
The main findings of this study are provided below:
The main conclusion is that ORi is sensitive and specific in predicting hypoxemia defined as S
pO2 values of
less than 95% while the FiO2 is 50% or higher on a pulse
oximetry device at 5 min after intubation in the supine
position (sensitivity of 92.3%, specificity of 81.1% and, an
accuracy of 84.0%) [7–9, 13, 15, 17–21].
There are other time points where there is statistically
good report of sensitivity, specificity and accuracy for
time points at ORiDL5, and during OLV until OLV30
where sensitivity of 43.8%, specificity of 64%, and an
accuracy of 56.1% are recorded. These findings correlated
to the previous reports that HPV increases and intrapulmonary shunting decreases after the start of OLV within
30 to 60 min [4, 8, 13, 14].
In our study group of patients, a total of 19 patients
(38%) developed hypoxemia at various recorded time
points during the surgical procedure. ORi provides information for impending hypoxemia that a change in ORi
value can be detected 5 to 6 min earlier than pulse oximetry value. Therefore, ORi can provide a valuable time
to the anesthesiologist to provide an increase in FiO2
values, to perform necessary mechanical ventilation
adjustments, to perform aspiration or other anesthetic
management techniques to prevent hypoxemia [7–9, 13,
15, 17–21].
Perfusion Index (PI)
Pleth Variability Index
(PVI)
Median
Interquartile
range (IQR)
Median
Interquartile
range (IQR)
Baseline
1.55
0.86–2.3
20.5
14–30.25
Preoxygenation
1.8
1.3–2.6
18.5
13–30.25
DS5
1.6
1–2.5
16
11–21
DL5
1.7
1.28–2.3
17
12–26
OLV1
1.3
0.61–1.3
16.5
11.75–23
OLV2
1.1
0.63–1.93
13.5
10–21.25
OLV5
1.3
0.64–1.93
14
10–20.25
OLV10
1.3
0.71–1.7
17
10.5–22.5
OLV15
1.25
0.76–2.1
15
10.25–21
OLV30
1.1
0.66–2
17
10–22
OLV45
1.3
0.82–2.1
14
8.5–20.5
OLV60
1.2
0.63–2.2
14
10–22
OLV90
1.1
0.73–2
13
8.5–18.75
PI Perfusion index, PVI Pleth variability index, IQR Interquartile range, DLV
Double-lung ventilation, OLV One-lung ventilation, DS5 Under mechanical
ventilation 5 min after intubation in supine position, DL5 Under mechanical
ventilation 5 min after positioning in the lateral decubitus position, OLV1 After
1 min of OLV, OLV2 After 2 min of OLV, OLV5 After 5 min of OLV, OLV10 After
10 min of OLV, OLV15 After 15 min of OLV, OLV30 After 30 min of OLV, OLV45 After
45 min of OLV, OLV60 After 60 min of OLV, OLV90 after 90 min of OLV
Table 4 Time-dependent correlations between oxygen reserve index (ORi) with peripheral oxygen saturation (SpO2), perfusion index
(PI) and pleth variability index (PVI) during surgery
Time (min)
Peripheral Oxygen Saturation (SpO2)
Perfusion Index (PI)
r
r
p
Pleth Variability Index
(PVI)
P
r
p
Preoxygenation
0.121
0.404
0.042
0.774
0.017
0.908
DS5
0.286
0.044*
−0.332
0.019*
0.073
0.617
DL5
0.293
0.039*
OLV1
−0.030
0.834
OLV2
OLV5
−0.087
−0.249
0.158
0.272
0.358
0.360
0.011*
0.099
−0.162
−0.240
−0,247
0.097
0.091
0.313
0.305
0.053
0.129
−0.115
0.529
OLV60
0.092
0.630
OLV90
−0,412
0.113
*
0.540
0.984
0.133
0.241
0.270
0.089
−0.013
0.548
OLV10
OLV30
0.947
0.888
0.081
OLV15
OLV45
−0.010
0.020
−0.179
0.433
0.344
0.094
−0.147
−0.001
−0.058
−0.175
−0.189
0.038
−0.036
−0.167
0.307
0.997
0.692
0.234
0.237
0.837
0.850
0.535
A p-value of less than 0.05 is considered statistically significant.
ORi Oxygen reserve index, SpO2 Peripheral oxygen saturation, PI Perfusion index, PVI Pleth variability index, DLV Double-lung ventilation, OLV One-lung ventilation,
DS5 Under mechanical ventilation 5 min after intubation in supine position, DL5 Under mechanical ventilation 5 min after positioning in the lateral decubitus position,
OLV1 After 1 min of OLV, OLV2 After 2 min of OLV, OLV5 After 5 min of OLV, OLV10 After 10 min of OLV, OLV15 After 15 min of OLV, OLV30 After 30 min of OLV, OLV45 After
45 min of OLV, OLV60 After 60 min of OLV, OLV90 after 90 min of OLV
Sagiroglu et al. BMC Anesthesiology
(2021) 21:319
During OLV, hypoxemia can develop not only by the
intrapulmonary shunt in the non-ventilated lung but
also by the ventilation-perfusion mismatch in the ventilated lung or hemodynamic instability [4, 5]. In our
study, patients with coronary artery disease and an
ejection fraction below 40% were not included into the
study. Patients with heart failure were also excluded.
During OLV, atelectasis occurs during general anesthesia induction, which causes ventilation/perfusion
mismatch even before switching to OLV [5, 6, 10]. During OLV, oxygen delivery to the patient under general
anesthesia occurs during various interactions between
hemoglobin, oxygen saturation, cardiac output, and
normal physiological mechanisms such as HPV and
intrapulmonary shunts [3, 4]. Although the causes of
OLV-induced hypoxemia are multifactorial, early detection of hypoxemia before the onset of OLV allows the
application of different ventilation strategies to improve
oxygenation [3–6]. The role of HPV and intrapulmonary shunting are also discussed earlier [4, 10, 14, 22].
A significant correlation between ORi and S
pO2 was
found at time points of DS5, DL5 and, at OLV10. The
relationship between SpO2 values and ORi equals to
zero values for predicting hypoxemia during anesthesia induction and maintenance is supported by these
statistical findings. There are previous studies that
support these correlations [7–9, 13, 15, 17–21]. In our
study group, hypoxemia episodes were observed at
various time points throughout the surgery however,
the reports were not able to demonstrate a fall of pulse
oximeter values below 95% as FiO2 values were set at
50% and may have been rised up to 70% after anesthesia management throughout the surgical procedures. In
addition to temporary rises in FiO2 throughout surgery,
mechanical ventilation and anesthetic maneuvers were
performed by the anesthesiologists. Because of these
interventions, in our opinion, we were not able to show
a continuous a correlation between ORi and SpO2 values at all measured time points. When ORi which is
an oximeter-related parameter is used along with the
pulse oximeter monitoring, ORi values may present
and record early signs of the downward trend of P
aO2
in comparison to a pulse oximetry value. In a previous
study, at 1 min after start of OLV the measurements
show that; hypoxemia was 27.5% where S
pO2 value was
less than 90% whereas; a negative predictive value was
reported as 12.9% in those patients who did not achieve
an ORi value of 0 at 1 min after the lung collapsed. It
has been reported that median time until desaturation
was approximately 5.5 to 6 min. Therefore, F
iO2 values
should be kept between 50 to 60% to avoid hyperoxemia and its related adverse effects such as atelectasis
[7–9, 13, 17, 18, 20, 21].
Page 9 of 11
Our findings show similarity with a recent study by
Alday and his colleagues [8] however, they also suggested that these values may be used to prevent unnecessary hyperoxemia. In our study, it is clear that during
anesthetic management FiO2 values are kept at a value of
50 to 70% in our patients whereas other studies investigated the use of ORi for hyperoxemia as well [7–9, 13, 17,
18, 20, 21]. In a study by Applegate and his colleagues, a
positive correlation between ORi values and PaO2 values
of 240 mmHg or lower (r = 0.536, p < 0.01) in comparison
to ORi values and P
aO2 values of higher than 240 mmHg
(r = 0.0016, p > 0.05) [9]. In our study, we were not able
to measure PaO2 values on each time point because of
hospital policies to decrease medical costs. In our study,
at the measurement time of arterial blood gas analysis
at DL5, we found that 4 patients had a PaO2 value above
240 mmHg and ORi values showed statistically significant negative correlation (r = − 1.0, p < 0.001). In another
study, 15 patients undergoing elective thoracic surgery
using OLV were evaluated for correlation between PaO2
and ORi parameters throughout the surgical procedure
and showed that ORi has a significant correlation with
PaO2 (r = 0.671, p < 0.001) [18]. There are a few studies
that provide evidence that PaO2 values show positive correlation with ORi values [7, 9, 11, 18, 20, 21].
During pulse oximetry monitoring, there is a sigmoidal relationship between arterial oxygenation in blood
gas value and peripheral oxygenation reported as S
pO2
value on the pulse oximetry device. This relationship
causes no change in pulse oximeter values until PaO2
falls below 80 mmHg. Afterward, there is a sudden drop
in pulse oximetry value; however, the P
aO2 is unacceptable for more than 3 to 5 min. Therefore, there is a
need to investigate a larger scale of several wavelengths
to detect quantitative measurement of methemoglobin,
carboxyhemoglobin, and total hemoglobin, and a newly
presented device achieved this. Masimo Rainbow Signal
Extraction Technology introduced the device [14–16,
19]. ORi is a parameter-driven from this device that is
between 0 and 1 values, and it is sensitive to the changes
in arterial oxygenation in the blood, with the range of 100
to 200 mmHg [2, 7–9, 13, 15, 18, 20, 21]. When oxygenation is in the moderate hyperoxic content showing an
arterial blood oxygenation value of 100–240 mmHg in
arterial blood gas analysis, the pulse oximeter SpO2 value
remains 100%, whereas, there is a decrease in the value
of ORi [2, 7–9, 13, 18, 20, 21]. In our study, Fig. 1 and
Table 4 provides data on time-dependent correlations
between ORi with SpO2.
Increased intrathoracic pressure with respiration leads
to more immediate reductions in peripheral perfusion
in patients with a fluid deficit. In this case, a decrease
in the PI value of the patient is observed. As a result of
Sagiroglu et al. BMC Anesthesiology
(2021) 21:319
these changes with respiration, the highest and lowest
PI ratio corresponds to the PVI. High PVI values are
observed in patients with a high fluid deficit or those
who do not respond to fluid application changes with
changes in the PI [11, 12, 15–17, 23, 24]. In our study,
we investigated the ORi and PVI values at different time
points during anesthesia induction and maintenance
of thoracic surgery and our findings are in correspondence with the previous findings that; fluid deficit or fluid
overload causes changes in PI and PVI values. This can
be observed in our representative trend graphs in Figs. 2
and 3 [16–18, 23, 24].
Our study provides valuable data for the investigation of correlations between ORi and PI, and PVI. OLV
with DLT has significant cardiopulmonary physiological
changes, as has been discussed elsewhere [14, 16, 17, 19].
Our study provides data that at a time point of DS5, there
is a significant negative correlation with PI (r = − 0.332,
p = 0.019), whereas; no correlations with PVI were noted.
This finding is thought to result from anesthesia drugs
that are use during anesthesia induction and especially
the use of opioid medications [3–6, 10, 12].
The use of F
iO2 values higher than 50% during anesthesia is related to hyperoxemia, and this high oxygenation
decreases cardiac output by reducing heart rate and causing systemic vasoconstriction. Furthermore, hyperoxemia is a potent vasoconstrictor stimulus to the coronary
circulation, functioning at the level of the microvascular
resistance vessels [7, 21]. Tsuchiya et al. demonstrated
that the PVI could be used to evaluate hypotension that is
caused secondary to anestethic drugs in patients undergoing general anesthesia without age group classification
[23]. This technique has been used in patients undergoing mechanical ventilation in the intensive care unit to
detect fluid responsiveness through respiratory patterns
and peripheral perfusion changes [11]. There are insufficient data to distinguish the cause of hypotension due
to peripheral vasodilatation and fluid redistribution or
cardiac output decrease after general anesthesia [23, 24].
High PVI values are observed in patients with a high fluid
deficit or those who do not respond to fluid application
changes with changes in the PI [24].
In our study, we demonstrated a time-dependent correlation between PVI and MAP at the time point of OLV90,
indicating that PVI showed a relation to MAP at a late
stage of the surgical procedure. Recently, it is pointed out
in a meta-analysis that PVI is a reliable marker in evaluating a response to fluid management [16].
Limitations
Malpositioning of DLT may cause hypoxemia and, in our
study protocol, we included these patients and therefore,
this is a limitation of our study [8, 9, 13, 25]. Previously,
Page 10 of 11
the arterial blood gas oxygenation results show that
PaO2 values were higher during right-sided OLV than
left-sided OLV. Although it could be predicted that ORi
would decrease before the decrease in S
pO2 during
left-sided OLV, the actual extent of this application of
either right-sided or left-sided OLV needs to be further
evaluated [7, 16, 18, 20, 21]. When oxygenation is in the
moderate hyperoxic range of P
aO2 values between 100
and 240 mmHg, ORi decreases, but SpO2 does not [21].
Therefore, ORi values can be used for detection of hyperoxemia however, as we were not able to measure PaO2
values secondary to hospital protocol to decrease medical costs, we were not able to evaluate these findings.
Conclusions
During use of OLV for thoracic surgeries, from 5 min
after intubation (DS5) up to 30 min after start of OLV,
ORi provides valuable information in predicting hypoxemia defined as SpO2 less than 95% on pulse oximeter at
FiO2 higher than 50%. These findings correlated to the
previous reports that HPV increases and intrapulmonary shunting decreases after the start of OLV within
30 to 60 min. ORi provides information for impending
hypoxemia that a change in ORi value can be detected
5 to 6 min earlier than pulse oximetry value. Therefore,
ORi can provide a valuable time to the anesthesiologist
to provide an increase in FiO2 values, to perform necessary mechanical ventilation adjustments, to perform
aspiration or other anesthetic management techniques
to prevent hypoxemia. Fluid responses and anesthesia
induction medications has influence over changes in PI
and PVI oximeter values. The use of ORi for hyperoxemia during OLV and thoracic surgeries may be useful
however, it is not practical as the P
aO2 values of these
patients usually range between 60 mmHg and 200 mmHg
and patients are not under risk of hyperoxemia related
problems when compared to a higher possible risk of
hypoxemia.
Abbreviations
ASA-PS: American Society of Anesthesiologists Physical Status; CI: Confidental
interval; DBP: Diastolic blood pressure; DLT: Double lumen tube; FiO2: Fraction
of inspired oxygen; IQR: Interquartile range; ORi: Oxygen reserve index; OLV:
One-lung ventilation; PaCO2: Arterial partial pressure of carbon dioxide; PaO2:
Arterial partial pressure of oxygen; PI: Perfusion index; PVI: Pleth variability
index; SpO2: Peripheral oxygen saturation; VATS: Video-assisted thoracoscopy; MAP: Mean arterial pressure; SBP: Systolic blood pressure; SD: Standard
deviation.
Acknowledgments
Authors would like to thank all the patients for their willingness to participate
in the study and their patience.
Authors’ contributions
Concept – G.S., Y.A.K.; Design – G.S., Y.A.K.; Supervision – G.S., Y.A.K.; Data Collection and/or Processing – G.S., Y.A.K.; Analysis and/or Interpretation – G.S.;
Sagiroglu et al. BMC Anesthesiology
(2021) 21:319
Page 11 of 11
A.B.; Literature Review – G.S., Y.A.K., A.B.; Writer – G.S., Y.A.K; A.B.; Critical Review
– G.S., A.B. The author(s) read and approved the final manuscript.
8.
Funding
The authors received no financial support for the research and/or authorship
of this article. This study was done solely by the funding of in Anesthesiology
and Reanimation Department of Trakya University Trakya School of Medicine
Hospital, Edirne, Turkey.
9.
Availability of data and materials
The data is available by permission from Dr. Gonul Sagiroglu, Trakya University,
School of Medicine, Depertment of Anesthesiology, Edirne, Istanbul, email
address: gonul.sagiroglu45@gmail.com. Please contact this address for permission. Administrative permissions are not required to access the raw data. The
authors have agreed to give permission to the data and materials during registration at clinicaltrials.gov.
10.
11.
12.
13.
Declarations
Ethics approval and consent to participate
All procedures performed in studies involving human participants were
in accordance with the ethical standards of the institution and/or national
research committee. Informed consent was obtained from all individual
participants included in the study.
Written informed consent was obtained from all patients.
Consent for publication
Not Applicable.
Competing interests
The authors declared no conflicts of interest with respect to the authorship
and/or publication of this article.
Author details
1
Department of Anesthesiology and Reanimation, Trakya University Faculty
of Medicine, Edirne, Turkey. 2 Pendik District Hospital, Clinic of Anesthesiology
and Reanimation, Pendik, 34980 Istanbul, Turkey. 3 Department of Thoracic
Surgery, Trakya University Faculty of Medicine, Edirne, Turkey.
Received: 18 October 2021 Accepted: 7 December 2021
14.
15.
16.
17.
18.
19.
20.
21.
References
1. Lohser J, Slinger P. Lung injury after one-lung ventilation: a review of the
pathophysiologic mechanisms affecting the ventilated and the collapsed
lung. Anesth Analg. 2015;121:302–18. https://doi.org/10.1213/ANE.00000
00000000808.
2. Campos JH, Sharma A. Predictors of hypoxemia during one-lung ventilation
in thoracic surgery: is oxygen reserve index (ORi) the answer? J Cardiothorac
Vasc Anesth. 2020;4:423–5. https://doi.org/10.1053/j.jvca.2019.08.017.
3. Karzai W, Schwarzkopf K. Hypoxemia during one-lung ventilation: prediction, prevention, and treatment. Anesthesiology. 2009;110:1402–11. https://
doi.org/10.1097/ALN.0b013e31819fb15d.
4. Yoon S, Kim BR, Min SH, Lee J, Bahk JH, Seo JH. Repeated intermittent
hypoxic stimuli to operative lung reduce hypoxemia during subsequent
one-lung ventilation for thoracoscopic surgery: a randomized controlled
trial. PLoS One. 2021;16(4):e0249880. https://doi.org/10.1371/journal.pone.
0249880.
5. Hahm TS, Jeong H, Ahn HJ. Systemic oxygen delivery during one-lung
ventilation: comparison between propofol and sevoflurane anaesthesia in
a randomised controlled trial. J Clin Med. 2019;8:1438. https://doi.org/10.
3390/jcm8091438.
6. Liu TJ, Shih MS, Lee WL, et al. Hypoxemia during one-lung ventilation for
robot-assisted coronary artery bypass graft surgery. Ann Thorac Surg.
2013;96:127–32. https://doi.org/10.1016/j.athoracsur.2013.04.017.
7. Chen ST, Min S. Oxygen reserve index, a new method of monitoring oxygenation status: what do we need to know? Chin Med J (Engl).
2020;133:229–34. https://doi.org/10.1097/CM9.0000000000000625.
22.
23.
24.
25.
Alday E, Nieves JM, Planas A. Oxygen reserve index predicts hypoxemia during one lung ventilation. An observational diagnostic study. J Cardiothorac
Vasc Anesth. 2020;34:417–4. https://doi.org/10.1053/j.jvca.2019.06.035.
Applegate RL 2nd, Dorotta IL, Wells B, Juma D, Applegate PM. The relationship between oxygen reserve index and arterial partial pressure of oxygen
during surgery. Anesth Analg. 2016;123:626–33. https://doi.org/10.1213/
ANE.0000000000001262.
Marongiu I, Spinelli E, Mauri T. Cardio-respiratory physiology during onelung ventilation: complex interactions in need of advanced monitoring. Ann
Transl Med. 2020;8:524. https://doi.org/10.21037/atm.2020.03.179.
Scheeren TWL, Belda FJ, Perel A. The oxygen reserve index (ORi): a new tool
to monitor oxygen therapy. J Clin Monit Comput. 2018;32:379–89. https://
doi.org/10.1007/s10877-017-0049-4.
Loupec T, Nanadoumgar H, Frasca D, et al. Pleth variability index predicts
fluid responsiveness in critically ill patients. Crit Care Med. 2011;39:294–9.
https://doi.org/10.1097/CCM.0b013e3181ffde1c.
Durkin C, Romano K, Egan S, Lohser J. Hypoxemia during one-lung ventilation: does it really matter? [published online ahead of print, 2021 Jul 7]. Curr
Anesthesiol Rep. 2021:1–7. https://doi.org/10.1007/s40140-021-00470-5.
Nagendran J, Stewart K, Hoskinson M, Archer SL. An anesthesiologist’s guide
to hypoxic pulmonary vasoconstriction: implications for managing singlelung anesthesia and atelectasis. Curr Opin Anaesthesiol. 2006;19:3. https://
doi.org/10.1097/01.aco.0000192777.09527.9e.
Yuksek A. Utility of the pleth variability index in predicting anesthesiainduced hypotension in geriatric patients. Turk J Med Sci. 2021;51:134–9.
https://doi.org/10.3906/sag-1912-132.
Jia FJ, Yan QY, Sun Q, Tuxun T, Liu H, Shao L. Liberal versus restrictive
fluid management in abdominal surgery: a meta-analysis. Surg Today.
2017;47:344–56. https://doi.org/10.1007/s00595-016-1393-6.
Tusman G, Bohm SH, Suarez-Sipmann F. Alveolar recruitment maneuvers
for one-lung ventilation during thoracic anesthesia. Curr Anesthesiol Rep.
2014;4:160–9. https://doi.org/10.1007/s40140-014-0054-9.
Koishi W, Kumagai M, Ogawa S, Hongo S, Suzuki K. Monitoring the oxygen
reserve index can contribute to the early detection of deterioration in
blood oxygenation during one-lung ventilation. Minerva Anestesiol.
2018;84:1063–9. https://doi.org/10.23736/S0375-9393.18.12622-8.
Ishida Y, Okada T, Kobayashi T, Uchino H. ORi™: a new indicator of
oxygenation. J Anesth. 2021;35(5):734–40. https://doi.org/10.1007/
s00540-021-02938-4.
Yoshida K, Isosu T, Noji Y, et al. Usefulness of oxygen reserve index (ORi™), a
new parameter of oxygenation reserve potential, for rapid sequence induction of general anesthesia. J Clin Monit Comput. 2018;32:687–91. https://
doi.org/10.1007/s10877-017-0068-1.
Yoshida K, Isosu T, Noji Y, et al. Adjustment of oxygen reserve index (ORi™) to
avoid excessive hyperoxia during general anesthesia. J Clin Monit Comput.
2020;34(3):509–14. https://doi.org/10.1007/s10877-019-00341-9.
Habre W, Peták F. Perioperative use of oxygen: variabilities across age. Br J
Anaesth. 2014;113(Suppl 2):ii26–36. https://doi.org/10.1093/bja/aeu380.
Tsuchiya M, Yamada T, Asada A. Pleth variability index predicts hypotension
during anesthesia induction. Acta Anaesthesiol Scand. 2010;54:596–602.
https://doi.org/10.1111/j.1399-6576.2010.02225.x.
Canneson M, Desebbe O, Rosamel P, et al. Pleth variability index to monitor
the respiratory variations in the pulse oximeter plethysmographic waveform
amplitude and predict fluid responsiveness in the operating theatre. Br J
Anaesth. 2008;101(2):200–6. https://doi.org/10.1093/bja/aen133.
Inoue S, Nishimine N, Kitaguchi K, Furuya H, Taniguchi S. Double lumen tube
location predicts tube malposition and hypoxaemia during one lung ventilation. Br J Anaesth. 2004;92:195–201. https://doi.org/10.1093/bja/aeh055.
Publisher’s Note
Springer Nature remains neutral with regard to jurisdictional claims in published maps and institutional affiliations.