Combination of classical and statistical approaches to enhance the fermentation conditions and increase the yield of Lipopeptide(s) by Pseudomonas sp. OXDC12: its partial
Bạn đang xem bản rút gọn của tài liệu. Xem và tải ngay bản đầy đủ của tài liệu tại đây (6.52 MB, 16 trang )
Turkish Journal of Biology
Turk J Biol
(2021) 45: 695-710
© TÜBİTAK
doi:10.3906/biy-2106-59
/>
Research Article
Combination of classical and statistical approaches to enhance the fermentation
conditions and increase the yield of Lipopeptide(s) by Pseudomonas sp. OXDC12: its
partial purification and determining antifungal property
Vivek CHAUHAN, Vivek DHIMAN, Shamsher Singh KANWAR*
Department of Biotechnology, Himachal Pradesh University, Summer Hill, India
Received: 27.06.2021
Accepted/Published Online: 26.11.2021
Final Version: 14.12.2021
Abstract: Around 200 different lipopeptides (LPs) have been identified to date, most of which are produced via Bacillus and Pseudomonas
species. The clinical nature of the lipopeptide (LP) has led to a big surge in its research. They show antimicrobial and antitumor activities
due to which mass-scale production and purification of LPs are beneficial. Response surface methodology (RSM) approach has emerged
as an alternative in the field of computational biology for optimizing the reaction parameters using statistical models. In the present
study, Pseudomonas sp. strain OXDC12 was used for production and partial purification of LPs using Thin Layer Chromatography
(TLC). The main goal of the study was to increase the overall yield of LPs by optimizing the different variables in the fermentation broth.
This was achieved using a combination of one factor at a time (OFAT) and response surface methodology (RSM) approaches. OFAT
technique was used to optimize the necessary parameters and was followed by the creation of statistical models (RSM) to optimize the
remaining variables. Maximum mycelial growth inhibition (%) against the fungus Mucor sp. was 61.3% for LP. Overall, the combination
of both OFAT and RSM helped in increasing the LPs yield by 3 folds from 367mg/L to 1169mg/L.
Key words: Fermentation, optimization, purification, TLC, antifungal activity, statistical evaluation
1. Introduction
In recent times, Lipopeptides (LPs) have gained a lot of
attention from the science community respective of their
vast applications. Lipopeptides have turned out to be one
of the most important secondary metabolites produced
by microorganisms leading to growing research interest
in them. With more than 200 different LPs identified to
date, they are structurally diverse compounds (Kumar et
al., 2021). The high structural variability is the resultant
of frequently occurring amino acid substitutions. This
characteristic feature of LPs in turn gives them the ability
to decrease interfacial and surface tension. Structurally,
they are low molecular weight compounds that consist of
a fatty acid acyl chain (hydrophobic) attached to a peptide
head (hydrophilic) (Mukherjee et al., 2021). The fatty acid
chain does not exceed more than 17 carbons in length,
whereas the number of amino acids ranges anywhere
between 7 and 35. Most documented LPs are produced
from Pseudomonas- (Proteobacteria) and Bacillus(firmicutes) strains. Other strains reported to produce LPs
are Streptomyces (Nielsen et al., 2000) and some fungal
strains (Verma et al., 2019).
Vastly studied LPs obtained from Bacillus strains
are characterized as iturin, surfactin, lichenysin, and
fengycin, and those produced by Pseudomonas strains
are tensin, surfactin, viscosin, massetolid, arthrofactin,
pseudodesmin,
syringomicin,
xantholysin,
and
pseudofactin. In most cases, the difference among the
structures of different lipopeptide (LP) is due to the
rearrangement of amino acids or the addition or removal
of carbon atoms in the fatty acid chains (Koumoutsi et
al., 2004). These LPs find applications in different sectors,
including pharmaceuticals, agriculture, textile, and
petroleum. Studies show that many LPs can act as excellent
antimicrobial and antifungal agents against different
pathogenic micro-organisms (Chauhan et al., 2021). Thus,
LPs can help in the production of biomedicines against
ever-evolving pathogenic strains which are antibioticresistant (Matsui et al., 2020). LPs have also proven their
worth as a xenobiotic compound that can be used to
degrade petroleum products and help in bioremediation
(Zhu et al., 2020).
Different LPs can be produced upon alteration of
nutrient conditions in the growth environment (Morikawa
et al., 2000). Many nitrogenous and carbon sources have
*Correspondence:
This work is licensed under a Creative Commons Attribution 4.0 International License.
695
CHAUHAN et al. / Turk J Biol
been reported to affect the production of different LPs
mainly iturins, surfactins, and fengycins (Vigneshwaran
et al., 2021). Nowadays, a variety of cheap counterparts
such as rice bran, soybean, potato-peels, molasses, etc. are
used for LPs production to tackle the production cost. In
addition, various metal ions as Mn2+ and Fe2+ are known
to enhance LP production (Rangarajan et al., 2012). In
a study, addition of manganese to the growth medium
increased LPs yield from 0.33 to 2.6 g/L (Matsui et al.,
2020). Further, the presence of MnSO4, FeCl3, and ZnSO4
in the growth medium for Bacillus subtilis increased
surfactin production (Zhu et al., 2020).
The major limitation in LPs production is high
production cost and low yield. Diverse applications of
LPs have bided scientists to harness ways to enhance
its production. This is done by optimizing different
growth parameters to achieve enhanced LP production.
Conventionally one factor at a time (OFAT) method is
used in which a single parameter or factor is examined
at a time while keeping other parameters to constant.
OFAT has certain shortcomings as it is a time-consuming
process, requires more data for analysis, and studying the
interaction between different factors or variables is quite
cumbersome. Due to these limitations of OFAT many
different approaches are looked upon to provide the
desired results. Response surface methodology (RSM) is
one such approach that is explored by scientists to reach
an optimal value obtained by interaction among different
variables. RSM is a statistical tool that comprises statistical
and mathematical techniques for model fitting, preparing
an experimental design, optimization, and validation of a
few selected physicochemical factors. By using different
statistical tools available in RSM, an experiment can be
designed using the desired variable or factors. In RSM,
different variables act as an input, and their interaction
will result in an optimized output (Nair, 2013). Central
composite design (CCD) and Plackett–Burman design
(PBD) are the two most noteworthy experimental designs
used for optimization in a microbial fermentation process
(Khusro et al., 2016). PBD acts as the (first) screening step
of RSM process. Here, all the variables are screened and
selected on the basis of their ability to positively affect
the optimization process. Selected factors later serve as
an input to create CCD where interaction among them is
studied to get optimal results. As only minimum process
knowledge is required for RSM, it is both cost- and timeeffective (Palvannan et al., 2010).
A noteworthy limitation to models developed through
RSM is that it is accurate only for a narrow range of inputs
process parameters and the development of higherorder RSM models requires a larger time, numerous
experiments to be performed, and they are costly. Keeping
this limitation in view a combination of OFAT and RSM
techniques was used to determine LP production for the
696
present study. The present study is aimed at enhancing the
LP production in fermentation broth from Pseudomonas
sp. OXDC12 is a strain isolated from the soil sample
in HPU, Shimla. Interaction of different independent
variables were analysed using both OFAT and RSM
approach to maximize LP production by the Pseudomonas
strain.
2. Materials and methods
2.1. Chemicals, microorganisms, and culture media:
The bacterial strain OXDC12 used in the study was
isolated from the field soil of spinach cultivation and
was identified as a Pseudomonas sp. by 16s rDNA gene
sequencing (MN336228) (Shruti et al., 2021), and the
identifier was a mucor sp. isolated from capsicum annum
plant and identified using 18s-RNA (Meena et al., 2018).
All chemicals used for the study were of analytical grade
Sigma-Aldrich (Steinheim, Germany). The solid media
used for antifungal experiments contained Luria-Bertani
agar for bacteria (LBA: yeast extract, 5g; peptone, 10g;
agar, 18g; NaCl, 10g; and distilled water, 1L), and potato
dextrose agar (PDA: agar, 18g; glucose, 20g; potato, 200g;
and distilled water, 1L) was used for fungi. The liquid
medium used for fermentation tests was LB medium
(prepared with the same components as present in LBA
but without agar). To activate the strain OXDC12 single
colonies of the strain were transferred from plates to 30mL
liquid LB activation medium in 100mL flasks as the seed
culture. The flasks were incubated with shaking at 160 rpm
for 14h at 37°C.
2.2. Time profile of the growth of Pseudomonas sp.
OXDC12 and antifungal activity:
Pseudomonas sp. strain OXDC12 was initially inoculated
on LB agar slant and then transferred to 500mL (2L flask)
of LB medium by shaking at 130 rpm at 37°C for 24h. A
5mL equivalent fraction of the culture was collected every
two hours from 0 to 78h. Optical density (OD) was read
at each time point. Thereafter, to access the antimicrobial
activity, 5mL of the culture was centrifuged at 13,500g for
1 min to obtain the cell-free supernatant. The antifungal
test was conducted over mucor sp. using 100μL of this
cell-free supernatant by the well-diffusion method (Tagg,
1971). For this, 24h-old spore of test pathogens cultures
in potato dextrose broth (PDB) at 30°C was spread over
Potato dextrose agar (PDA) plate. Test culture was then
poured in the wells created using agar hole puncture 8mm
diameter and checked for % inhibition after 3 days (Meena
et al., 2018).
2.3. Extraction and mass concentration calculation of
LPs:
Pseudomonas sp. strain OXDC12 from a seed culture (6h)
was incubated in a 250mL Erlenmeyer flask containing
100mL of LB medium with shaking at 180 rpm for 24h
at 30°C. After cultivation, the culture was centrifuged at
CHAUHAN et al. / Turk J Biol
10000 rpm for 15 min. and the cells pellet was discarded.
The pH value of the cell-free supernatant was adjusted to
2.0 using 6M HCl and stored overnight at 4°C for acid
precipitation (Yao et al., 2012). Further, the precipitate
was collected by centrifugation at 9500g for 15min at 4°C.
The supernatant was discarded, and the pallet/residue
was extracted using the minimal amount of methanol
under shaking conditions. The crude product was tested
for LP presence and antimicrobial activity. Methanol was
evaporated from the crude LP in an oven at 60°C (Cao et
al., 2012). The residue was weighed and used to calculate
the mass concentration.
2.4. Assays for lipopeptide(s):
2.4.1. Quantification of peptide and lipid contents:
The different assays were performed to check the peptide
and the lipid moiety of the extracted LPs. Peptide
quantification was done using the Bradford test (Bradford,
1976), while the presence of lipid moiety in the extract was
checked using the Sudan IV test (Patel et al., 2015). Sudan
IV (Red) was added in methanol to make a 1mg/mL stock
solution. A total of 1mL of the sample was taken and five
drops of Sudan IV stock solution were added to it. In the
presence of lipid moiety, color of Sudan IV changes from
red to orange.
2.4.2. Thin-layer chromatography (TLC) analysis of LP:
A 5μL of sample (LP) sterilized with 0.22-micron
membrane was applied onto a TLC plate (Silica gel 60/
UV254, SDFCL, thickness: 0.2 mm and 1 cm × 25 cm). TLC
plate was then transferred into the solvent/mobile phase.
The mobile phase consisting of chloroform: methanol:
water (65:25:4) was used in the analysis. The TLC plate
was developed by uniformly spraying the TLC plate with
ninhydrin solution (0.25% in ethanol) and was placed in
an oven at 110ºC for 20 min. This was then used to detect
the peptide moiety of LP. Similarly, the lipid moiety of the
LP was detected by uniformly spraying the TLC plate with
water and analyzing it under UV light (Razafindralambo
et al., 1993). Rf value of the extracted LP was calculated by
the following formula);
Rf = Distance traveled by solute from the origin (cm) /
Distance traveled by solvent from the origin (cm)
2.4.3. Analysis of the antifungal activity of LPs:
Antifungal activity assay was performed for isolated
lipopeptide(s). The assay was performed using agar well
diffusion method (Tagg, 1971) on freshly prepared potato
dextrose agar (PDA) Petri-plates. The test fungus culture
(Mucor sp.) was inoculated in the middle of the PDA plates
and to the peripheral wells (diameter 6 mm), methanol
(30µL) was loaded in the control petri-plate whereas
lipopeptide preparation extracted using methanol (30µL)
was loaded aseptically in the test petri-plate. These petriplates were then incubated at 30ºC and growth inhibition
(%) was recorded against the fungal pathogen after 1 and 3
days, respectively. The following equation was used for the
calculation of the zone of inhibition:
% = Dc – Dt / Dc 100
Where Dt: Average diameter of mycelial colony treated
with LPs. Dc: Average diameter of control mycelial colony.
2.5. Optimization of fermentation conditions to enhance
LPs production:
2.5.1. Conventional one factor at a time (OFAT) approach:
Initial tests were performed using LB medium containing
no extra carbon or nitrogen sources at pH = 6, 37°C
agitated at 130rpm. One factor at a time (OFAT) approach
was employed to optimize various physio-chemical
parameters like culture medium, inoculum size, inoculum
age, initial pH value, nitrogen source, carbon source,
and effect of different metal ions for enhancing the LP
production. Different nitrogenous sources (peptone,
ammonium sulphate, urea, sodium nitrate, yeast extract,
ammonium nitrate, beef extract, and ammonium
chloride) at a concentration of 1% (w/v) were added to
the production media separately to study their effect on
lipopeptide(s) production. Similarly, different carbon
sources (glucose, sorbitol, lactose, galactose, maltose,
sucrose, mannitol, fructose, and starch) were also studied
for optimal LP production. The effect of pH (4, 5, 6, 7, 8,
and 9) and agitation rate (50, 80, 100, 130, 160, 190, and
210rpm) was tested separately for the production of LP
in the fermentation broth. The effect of different metal
ions (Fe3+, Zn2+, Mg2+, Na+, Mn2+, and K+) was checked.
The yield of the LP obtained in each case was determined
and recorded which further helped in assessing different
parameters for designing the RSM models. The best
response/factor providing optimal LP yield served as the
center point around which the RSM model was designed.
For each setup, three parallel tests were conducted.
2.6. Response surface methodology (RSM) analysis
for the statistical optimization of LP production by
Pseudomonas sp. strain OXDC12:
OFAT optimization method was followed by the RSM
approach to enhance LP production in the fermentation
broth. RSM analysis was done by combining two different
model designs i.e., the Plackett–Burman Design (PBD)
and Composite Center Design (CCD).
2.6.1. Plackett–Burman
The experimental design for PDB is based upon the 1st
order model which assumes that there is no interaction
amongst fermentation medium constituents and the
parameters under study (xi).
697
CHAUHAN et al. / Turk J Biol
Y=β0+∑βixi,
(1)
where, Y = estimated target function
βi= was the regression coefficient
For the construction of the PBD model, eight production
variables were used which had an independent effect on
the fermentation broth. The screening of these variables
was based upon responses at two levels, i.e. minimum
and maximum. In general, PBD is a fractional factorial
design, which is used to measure the difference between
the averages of observations at the maximum (+1) and the
minimum level (–1) of the factors (Diwaniyan et al., 2011;
Nair, 2013). For this study, PBD was prepared using eight
selected parameters (beef extract, glucose, production
time, pH value, centrifugation rate, centrifugation time,
temperature, and MnSO4). Software Design expert 12.0
was used to prepare the experimental designs which
suggested 12 different experimental runs with contrasting
values for the selected parameters. The study was carried
in 12 runs, and the observations were fed into the same
software (Design expert) for statistical analysis.
As PDB is only used as a screening tool, it cannot be
used as the only design tool to efficiently carry out the
RSM optimization process. Hence, the screened variables
were further selected for the CCD study.
2.6.2. Central composite design:
Central composite design (CCD) was then employed
to measure the relation between selected variables to
further assist in the optimization of LP production. CCD
measures the interdependence of variables where the
experiment is designed on the basis of 2n factorial and 2n
axial runs. Centre runs are used to calculate experimental
error, which helps in proofreading the created design.
Here, 2n factorial was coded by +1 and –1 level and each
independent variable/factor was investigated for these
two levels. Test runs are proportional to the number of
variables (n) and increase rapidly when the number of
variables increases. Thus, the experiment was designed
using the CCD model for optimizing the LP growth from
Pseudomonas sp. OXDC12. Four variables (beef extract,
production time, glucose concentration, and production
temperature) were screened out as beneficial for LP
production and were used for experimental design. The
effect of 30 runs was generated and recorded for further
analysis. Both designing of the experiment and data
analysis was done using Design Expert, Version 12.0.0
(Stat-Ease Inc., Minneapolis, MN). The three-dimensional
surface (3D)-plots were also obtained for the CCD which
gives the information about the main effect and interactive
effects of the independent variables used in the experiment
(Meena et al., 2018).
698
2.6.3. Proofreading of PBD and CCD:
Proofreading is necessary to check the authenticity of
experimental runs obtained from PBD and CCD designing
techniques for LP optimization in the fermentation broth.
ANOVA and the lack of fit test are used to check the
authenticity of the experimental design. The desired model
is one that has a significant value for the ANOVA test and
a non-significant value for the Lack of fit test. Also, the
perturbation plot created in the case of CCD helped in the
validation of the test.
2.7. Statistical analysis:
All experiments were done in triplicate, and the average
concentration of LP was considered as a response. The
statistical analysis of OFAT data was done using Microsoft
Excel (MS Office 2019), whereas ANOVA and lack of fit
test to prove the credibility of PDB and CCD were done
(Gangadharan et al., 2008) using Design-Expert software
package (version 12.0.0, State-Ease Inc., USA).
3. Results
3.1. Generation of growth curve vs. antifungal activity
curve
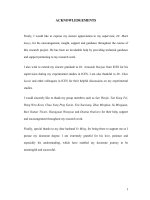
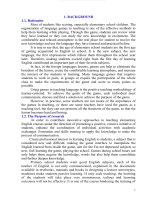
The growth curve of Pseudomonas sp. OXDC12 is shown
in Figure. 1. The bacteria grew well in LB medium, with
the logarithmic phase appearing at 14h to 22h. Using the
same LB medium, the antifungal activity at different time
points in the culture was measured, and the relevant curve
was generated (Figure 1). The antifungal activity peaked
at 60h (58.31 ± 0.24) and was in the stationary phase of
the culture. Based on the generated curve, 60h old cultures
were considered as optimum for detecting the antifungal
activity for the crude LPs.
3.2. Analytical tests for LPs confirmation and Partial
purification
Crude LPs sample was subjected to Bradford analysis to
detect protein content and presence of protein moiety.
1.21mg/mL of protein content was found in the crude
sample. Sudan IV test confirmed the lipid moiety in the
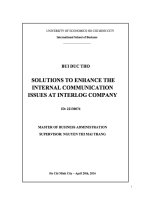
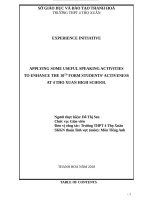
crude sample. Initial screening was followed by TLC
analysis. A large spot was visible on the TLC plate when
sprayed with water and examined under UV having
Rf values of 0.77 and 0.71 (Figure 2a, 2b). When seen
under normal light it appeared to be white indicating the
lyophilic nature of the compound. Further, LPs presence
was confirmed when the other half of the plate was tested
with ninhydrin for the presence of amino acids. A brown
spot emerged with the same Rf value when the plate was
uniformly sprayed with ninhydrin solution (0.25% in
ethanol) and placed in an oven at 110°C for 20 min.
3.3. Antifungal test
Antifungal activity was tested for LPs against mucor strain.
No distinctive difference was found in the maximum
CHAUHAN et al. / Turk J Biol
70
2.5
60
2
1.5
40
30
1
Cell growth (A620)
LP activity %
50
Cell growth (A620)
LP activity (%)
20
0.5
10
0
0
10
20
30
40
50
60
70
80
0
Time (h)
Figure 1. Growth curve of Pseudomonas sp. OXDC12 vs. antifungal activity.
activity achieved in both cases. Maximum mycelial growth
inhibition (%) against the fungus Mucor sp. (Figure 2c, 2d)
was 61.3% for LPs.
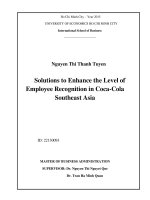
3.4. OFAT optimization
Prior to the RSM approach, the OFAT technique was used
to optimizing essentials parameters affecting fermentation
conditions. Effects of culture conditions, including
inoculum size, initial Ph value, agitation rate, carbon
source, nitrogen source, and metal ions were investigated
(Figure 3). Glucose (142 ± 2.68 mg/mL) was considered
as the best carbon source (Figure 3d), whereas beef
extract (143 ± 3.22 mg/mL) emerged as the best nitrogen
source (Figure 3e). Mn2+ (98.66 ± 4.04 mg/mL) showed
an enhancement in LPs production in the fermentation
broth (Figure 3f). It was worth noting that LPs production
changes drastically when moving away from neutral pH.
Initial pH value of 6 to 7 (148.66 ± 1.86 mg/mL) showed
maximum production (Figure 3b). Eight-hour old
inoculum at 6% v/v showed the best production (112.33 ±
2.23 mg/ml, Figure 3a). LPs productions increased with an
increase in agitation rate to a point (160rpm, 145.33 ± 3.14
mg/mL) after which it attained constant and did not show
any further increase (Figure 3c).
3.5. RSM approach
3.5.1. Plakett-Burman experimental design
Based upon the OFAT approach effect of eight independent
variables (beef extract, glucose, production time, pH value,
centrifugation rate, centrifugation time, temperature, and
MnSO4) was observed on the production of extracellular
LPs from Pseudomonas sp. OXDC12. A 12 run model was
created using the Plackett-Burman design, which showed
the yield in a range of 146-623mg/L for different runs (Table
1). Upon analysis of Plackett-Burman design using Pareto
chart (Figure 4), it was observed that five factors (beef
extract, glucose, production time, production temperature,
and pH value) showed a positive effect in enhancing LPs
production in the fermentation broth (Table 1). Usually, a
model with a p-value of <0.05 is significant. To measure
the authenticity of the model ANOVA was performed and
the P-value of positive variables (beef extract, glucose,
production time, production temperature, and pH value)
was 0.0001, whereas for the whole model (8 variables) was
0.0037 (Table 2). The difference between Predicted R² and
the Adjusted R² was less than 0.2.
3.5.2. Central composite design (CCD)
Based upon the results of Plakett–Burman analysis four
variables (beef extract, glucose, production time, and
temperature) were considered for central composite design
(CCD). These variables were tested for optimum level and
their combined effect in enhancing the LPs production.
CCD model with 30 different runs was prepared for
analysis of the variables (Table 3). The responses obtained
from the experimental runs served as an input for the
design matrix, and the predicted response by the design
matrix was presented (Table 3). From the responses, it was
699
CHAUHAN et al. / Turk J Biol
A
C
B
D
Figure 2. Analytical results for LPs confirmation and partial purification. a. Sudan IV test [test] Sudan IV added to crude sample (LPs in
methanol) [control] Sudan IV in methanol (red colour; 1mg/mL). b. TLC analysis of the sample. [L1] uniformly sprayed with ninhydrin
solution (0.25% in ethanol). [L2] Sprayed with water detected under UV light. Antifungal activity of LPs against Mucor sp. c. 1 day and
d. 3 days after inoculation. [Control] methanol (30µL) [Test] LPs (30µL).
concluded that four variables working together positively
affect the LPs production and at the concentration of beef
extract 2.75% (w/v), glucose 2.75% (w/v), temperature
32.5°C, and the production time of 57h showed the highest
yield (1168mg/L) of LPs.
ANOVA of CCD results was performed, and four
process orders were observed by the design expert model.
Quadratic process order proved to be the best and the
same was processed for further analysis. The ANOVA of
quadratic regression model demonstrated that the model
was highly significant, which was evident from the Fisher’s
F test (F model, mean square regression/mean square
residual = 16.45) with a very low probability value [(P
model >F) = 0.0001]. The model fit was expressed using a
coefficient of determination, R2, which was 0.8742 for the
model indicating 87% of the variability in the responses
700
can be explained by this model. Adjusted R2 and Predicted
R2 values had a difference of less than 0.2.
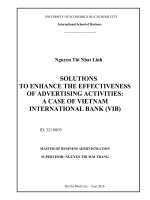
RSM approach of media optimizations is based upon
the fact that different variables interact with each other
to produce the best possible outcome. The interaction
between the variables was studied using a 3D response
surface plot (Figure. 5). 3D response model is generated
from the regression analysis keeping two factors at
constant and changing the other two factors with different
concentrations. Using this plot, optimum levels and the
interaction between variables could be understood. Four
variables interacted with each other to give the best result,
i.e. LPs production when the concentration of beef extract,
glucose, production time, and production temperature
were 2.97mg/100mL, 2.43mg/100mL 70h and 33°C,
respectively (Table 4, Figure. 5)
CHAUHAN et al. / Turk J Biol
Figure 3. OFAT approach for parameter optimization in the fermentation broth. a. Inoculation size (7w/v, %). b. pH value (7).
c. Agitation rate (160). d. Carbon source (glucose, 1%w/v). e. Nitrogen source (beef extract, 1%w/v). f. metal ions (MnSO4).
4. Discussion
Time and again it has been concluded that LPs have crucial
applications in the environmental, agricultural, food, and
pharmaceutical fields, efficient production of LPs is critical
(Maksimov et al., 2020). Hence, increased heed is being paid
to the quantitative and qualitative analysis of lipopeptides.
Though, numerous literature is present for bacillus LPs a
few known studies have shown effective LPs obtained from
Pseudomonas sp. In the present study, an attempt has been
made to extract LPs from Pseudomonas sp. OXDC12 and
enhance its production using a combination of OFAT and
RSM techniques. The strain was isolated from the soil, and
it was identified as Pseudomonas sp. OXDC12 using 16S
rDNA sequencing using nucleotide sequence homology
and phylogenetic analysis.
The Bradford analysis and the Sudan IV test confirmed
the presence of protein and lipid moiety respectively, in
the crude sample (Smyth et al., 2010; Fang et al., 2014).
701
CHAUHAN et al. / Turk J Biol
Table 1. Plakett–Burman experimental design for evaluating the influence of various independent variables on LPs production via
Pseudomonas sp. OXDC12.
Run
Response
Glucose extract Beef extract Production pH
Temperature Centrifugation Centrifugation
MnSO4
(mg/L)
(g/100mL)
(g/100mL) time (h)
(mM) °C
rate (g)
time (min)
1
5
5
24
7
40
20000
10
0.5
526
2
5
0.5
90
7
25
20000
20
5
324
3
5
5
90
6
25
9500
20
0.5
498
4
0.5
0.5
24
7
25
20000
20
0.5
146
5
5
5
90
6
40
20000
20
0.5
625
6
5
5
24
6
25
20000
10
5
314
7
5
0.5
24
6
40
9500
20
5
289
8
0.5
0.5
24
6
25
9500
10
0.5
138
9
0.5
5
90
7
25
9500
10
5
361
10
5
0.5
90
7
40
9500
10
0.5
462
11
0.5
0.5
90
6
40
20000
10
5
214
12
0.5
5
24
7
40
9500
20
5
281
Pareto Chart
ln(R1)
10.49
A: Glucose
A-Glucose
B-Beef Extract
B: Beef Extract
C: Production Time
D: pH
E: Temperature
F: Centrifugation Rate
8.39
G: Centrifugation time
C-Production Time
H: MnSO4
Bonferroni Limit 7.70406
J: J
L: L
Positive Effects
Negative Effects
t-Value of |Effect|
K: K
6.30
E-Temperature
4.20
D-pH
t-Value Limit 3.18245
2.10
F-Centrifugation Rate
H-MnSO4
G-Centrifugation time
0.00
1
2
3
4
5
6
7
8
9
10
11
Rank
Figure 4. Plackett-Burman design (Pareto chart) showing the effect of different factors on the production of LPs by Pseudomonas
sp. OXDC12.
However, TLC analysis is used in many past studies as
et al., 2008; Alajlani et al., 2016). In this study, TLC was
an efficient method for the purification of the LPs (Das
done which confirmed the presence of LPs. Rf value of
702
CHAUHAN et al. / Turk J Biol
Table 2. Statistical analysis of RSM moldels.
Sr. No Test name
F- value
p-value
Predicted R² Adjusted R²
ANOVA-PBD (for positive {5} variables)
70.22
<0.0001** 0.9215*
0.9692*
ANOVA-PDB (for all {8}variables)
54.40
0.0037**
0.8838*
0.9749*
ANOVA-CCD
15.48
<0.0001** 0.7064*
0.8749*
** “significant”.
* “values in difference of less than 0.02, hence model is relevant”.
Table 3. Central composite design (CCD) response for selected variables.
1
Beef extract Glucose extract Temperature Production Response
(g/100mL) (g/100mL)
(°C)
time (h)
(mg/L)
0.1
2.75
32.5
57
923
2
5
0.5
40
90
689
3
7.25
2.75
32.5
57
756
4
2.75
2.75
32.5
57
1168
5
5
5
25
24
412
6
2.75
2.75
32.5
8
256
7
5
0.5
40
24
522
8
5
5
40
90
766
9
0.5
5
40
24
389
10
0.5
0.5
25
24
345
11
2.75
7.25
32.5
57
689
12
0.5
5
40
90
672
13
0.5
5
25
90
482
14
2.75
2.75
17.5
57
98
15
0.5
0.5
40
24
355
16
2.75
2.75
32.5
57
980
17
0.5
5
25
24
367
18
2.75
2.75
32.5
57
1102
19
2.75
2.75
32.5
123
886
20
5
5
25
90
554
21
2.75
2.75
47.5
57
178
22
2.75
2.75
32.5
57
1145
23
5
5
40
24
456
24
2.75
0.1
32.5
57
926
25
5
0.5
25
90
498
26
2.75
2.75
32.5
57
1124
27
0.5
0.5
25
90
459
28
0.5
0.5
40
90
733
29
5
0.5
25
24
482
30
2.75
2.75
32.5
57
1167
Run
0.77 and 0.84 was observed. Rf values ranging from 0.68
(Sivapathasekaran et al., 2010; Geissler et al., 2017). LPs
to 0.88 have been obtained in many past studies for LPs
are known to possess antimicrobial activity against various
703
CHAUHAN et al. / Turk J Biol
Factor Coding: Actual
3D Surface
Design Points
98
1168
X1 = A: Beef extract
X2 = B: Glucose
Actual Factors
C: Temperature = 33.25
1400
D: Production Time = 72.86
1200
1000
800
R1
600
400
200
0
5
5
4.1
4.1
3.2
3.2
2.3
2.3
B: Glucose (g/100mL)
1.4
A: Beef extract (g/100mL)
1.4
0.5
0.5
Factor Coding: Actual
3D Surface
Design Points
98
1168
X1 = B: Glucose
X2 = D: Production Time
Actual Factors
A: Beef extract = 2.975
1400
C: Temperature = 33.25
1200
1000
800
R1
600
400
200
0
90
5
79
4.1
68
3.2
57
2.3
46
D: Production Time (h)
1.4
35
24
704
0.5
B: Glucose (g/100mL)
CHAUHAN et al. / Turk J Biol
Factor Coding: Actual
3D Surface
Design Points
98
1168
X1 = B: Glucose
X2 = C: Temperature
Actual Factors
A: Beef extract = 2.975
1400
D: Production Time = 72.84
1200
1000
800
R1
600
400
200
0
40
5
37
4.1
34
3.2
31
C: Temperature (°C)
2.3
28
B: Glucose (g/100mL)
1.4
25
0.5
Factor Coding: Actual
3D Surface
Design Points
98
1168
X1 = A: Beef extract
X2 = C: Temperature
Actual Factors
B: Glucose = 2.435
1400
D: Production Time = 72.84
1200
1000
800
R1
600
400
200
0
40
5
37
4.1
34
3.2
31
C: Temperature (°C)
2.3
28
1.4
25
A: Beef extract (g/100mL)
0.5
Figure 5. 3D response surface plot for CCD experiment showing interaction between different variables in fermentation broth. The plot
examines the interaction between two variables with each other when to enhance LPs production other variables are kept constant a.
Temperature (33.25°C) and production time (70.86h). b. Glucose (2.43g/100mL) and production time (72.84h) were optimum. c. Beef
extract (2.97g/100mL) and production time (72.84h). d. Beef extract (2.97g/100mL) and temperature (33.25°C) gave the optimum yield.
705
CHAUHAN et al. / Turk J Biol
Table 4. Summary of different models used in the LPs production.
Model Used
OFAT
Factors optimized
LPs Production
(mg/mL)
Inoculation size
112.33 ± 2.23
Agitation rate
145.33 ± 3.14
Carbon source (Glucose)
142 ± 2.68
Nitrogen source (Beef extract)
143 ± 3.22
Metal ion (Mn2+)
98.66 ± 4.04
pH value (6 to 7)
148.66 ± 1.86
beef extract, glucose, production time, pH value, centrifugation rate, centrifugation time,
625
Placket–Burman
temperature, and MnSO4
beef extract, glucose, production time
CCD
1168
temperature
pathogenic fungi and bacteria. In the present study
antimicrobial activity was tested for LPs. LPs in many
different studies have been found to have good antibiotic
activity against pathogenic microorganisms like Sclerotinia
sclerotiorum, Staphylococcus aureus, and Pseudomonas
aeruginosa (Fang et al., 2014). Purified LPs obtained
from Pseudomonas sp. DSS73 showed antifungal activity
against Serratia marcescens (Anderson et al., 2003). LPs
obtained from Pseudomonas sp. CMR12a was successful in
inhibiting the growth of R. solani. A study concluded that
different types of LPs obtained from Pseudomonas sp. are
capable of providing antimicrobial activity against many
common pathogens (Raaijmakers et al., 2010; Geudens
et al., 2018). A novel LPs isolated from Pseudomonas sp.
UCMA 17988 showed antimicrobial resistance against
Listeria monocytogenes, Staphylococcus aureus, and
Salmonella enterica (Schlusselhuber et al., 2020).
OFAT approach was pursued for optimization with
a view to develop a suitable and economical system
for LPs production. Optimization of components of
fermentation broth by OFAT approach involves changing
one independent variable while keeping other factors
constant. By using this process, several important factors
were optimized. The pH value of 6–7 showed maximum
production of LPs, which was in accordance with the
previous studies where pseudomonas showed maximum
production of LPs in the pH value ranging from 6 to 8
(Zhao et al., 2014; Biniarz et al., 2018).
Glucose enhanced the LPs production when added
to fermentation broth as a carbon source (Hmidet et
al., 2017). Many previous studies have shown that LPs
production is vastly affected by the addition of a carbon
source. A medium enriched with glucose (10.0g/L) showed
maximum LPs produce (439.0mg/L) by B. subtilis ATCC
21332 (Fonseca et al., 2007). A glucose concentration of
2.5g/L was found optimum for production of lipopeptide
706
biosurfactant from B. subtilis MTCC 2423 (Eswari et al.,
2016). Pseudofactin (PF) lipopeptide from Pseudomonas
fluorescens BD5 showed that the addition of nitrogen
sources [Leu, Glu, amino acid mixture and (NH4)2SO4],
as well as citrate and succinate as the sole carbon sources,
resulted in increased production up to 120-fold, i.e. 1187
± 13.0 mg/L (Biniarz et al., 2018).
Amongst nitrogen sources, beef extract elevated
the produced amount of LPs in the fermentation broth.
Nitrogenous sources like yeast extract and beef extract
have enhanced LPs production when present in high
concentrations in the broth (Biniarz et al., 2018). Different
studies have highlighted the importance of metal ions in
enhancing the LPs yield when added to the fermentation
broth. For this study, the effect of different metal ions
was tested and Mn2+ (1mM) showed positive results.
The study was in accordance with many previous studies
where Mn2+ have effectively increased LPs yield when
added to the fermentation broth (Janek et al., 2016).
In a study, maximum production of LPs was obtained
from Pseudomonas aeruginosa S2 in presence of MgSO4
and FeSO4 (Chen et al., 2007). For the production of an
extracellular secondary metabolite, it is important for the
fermentation broth to be in motion. Hence, the rate of
change in agitation rate was measured. LPs productions
increased with an increase in agitation rate to a point
(160rpm) after which it attained constant and did not show
any further increase. This observation was quite similar to
a study where agitation rate after reaching a thrashed point
did not affect LPs production (Zhao et al., 2014).
Even though the OFAT system is economical, it often
fails to locate a region of optimum response model. This is
due to the fact that in the OFAT system combined effects
of factors on the response are not measured (Zhao et al.,
2014). The RSM approach was, thus, applied as an alternate
statistical tool, which helped in the evaluation of combined
CHAUHAN et al. / Turk J Biol
effects of all independent variables in a fermentation
process, which may have resulted due to their interaction
with each other. In the present study, eight variables (beef
extract, glucose, production time, Ph value, centrifugation
rate, centrifugation time, temperature, and MnSO4) were
considered for the RSM approach based upon results
obtained in OFAT optimization. The RSM approach is a
two-step process; firstly Plakett-Burman experimental
design is used to screen out the most important variables.
This model is used as a screening tool where LPs yieldenhancing variables were screened out based upon their
interaction with each other in the medium. Based upon
the 12-run model showing the yield ranging from 138–
625mg/L five variables (beef extract, glucose, production
time, production temperature, and pH value) showed
a positive effect in LPs production. The remaining three
variables (Mn2+, centrifugation rate, and centrifugation
time) showed a neutral to slightly negative effect when in
LPs production. Zheng et al. (2013) used RSM to improve
the lipopeptide production from Bacillus subtilis NEL01 strain. A five-level three-factor CCD was employed
to determine the effects of temperature, pH value, and
culture cycle, determining that the maximum lipopeptide
yield (1079.56mg/L) can be achieved at 34.81°C and for
a 49.26h culture cycle. Pareto-Chart analysis helped in
concluding the result of Plakett-Burman experiment. The
second phase of RSM is to thoroughly examine the role
of screened-out variable by use of the CCD model. Here,
four variables (beef extract, glucose, production time,
and production temperature) that were highly effective in
enhancing LPs yield were optimized using a 24 factorial
CCD design. Deepika et al. (2016) observed the following
significant values of optimized conditions: Karanja oil
(23.85g/L), sodium nitrate (9.17g/L), pH value (7.8),
which yielded an average LPs production of 5.9072g/L at
48h, and 37°C temperature on Pseudomonas aeruginosa
strain KVD-HR42. The maximum yield achieved using
RSM was obtained in the fermentation broth containing
yeast extract (2.75 mg/L) and glucose (2.75mg/L) when
subjected to fermentation for 60 h at 32.5°C. In the present
study, a maximum yield of 1168 mg/L was achieved.
Rocha et al. (2007) were able to optimize lipopeptide yield
in Pseudomonas aeruginosa (ATCC 10145) of 3860mg/L
using cashew apple juices (1g/L) and peptone (5g/L) as
carbon and nitrogen sources respectively. Wu et al. (2008)
achieved Rhamnolipid yield of 8.63g/L with effective use
of NaNo3 in P. aeruginosa EM1. Paul M (2020) enhanced
the production of xylanase from Pseudomonas mohnii
using RSM.
No such system can be used in the biological process
if not backed by statistical studies (Myers et al., 2016;
Lee et al., 2019). In order to check the authenticity of the
optimization process, both stages of the RSM process were
statistically tested using ANOVA. An ANOVA test is used
to find out if the results of an experimental or a survey
are significant or not (Kim et al., 2017). Both models were
significant for ANOVA and nonsignificant for lack of fit
test, which is desired for assuring the authenticity of an
experimental model. Overall, using the combination of
both OFAT and RSM helped in increasing the LPs yield by
3 folds from 367mg/L to 1169mg/L.
5. Conclusion
The main aim of the study was to find an alternative
time and cost-effective approach to increase the yield of
important biomolecules. RSM has emerged as an important
tool in scientific-analytical studies. In combination, OFAT
and RSM served as an important duo to bring down the
optimization cost and give reliable results. In the present
study, OFAT was used as an initial model for optimization.
For RSM two models (Plakett–Burman and CCD) were
used. The maximum produce using Plakett–Burman
design was 526mg/L, and four factors were selected
for further optimization. The maximum produce of
biomolecule (LP) obtained in CCD design was 1168mg/L,
which was nearly 3-folds in amount to the initially
obtained value. The highly effective nature of the process
encourages researchers to use it for the production and
activity optimization of different biological molecules. In
the future, a standardized approach can be made where a
combination of classical approaches (OFAT) and statistical
approach (RSM) can be used as an efficient method for
the optimization process (production and activity) of
biological molecules.
Acknowledgement and/or disclaimers, if any
The authors are thankful to CSIR, New Delhi as well as
DBT, New Delhi for continuous financial support to
the Department of Biotechnology, Himachal Pradesh
University, Shimla (India).
Funding
This work has been funded by Council for Scientific and
Industrial Research, New Delhi, under a CSIR-NET Senior
Research Fellowship [File No. 09/237(0161)/2017-EMR-1]
awarded to one of the authors (VC).
Conflict of interest
Authors declare that they have no conflict of interest with
each other or with the parent institute.
707
CHAUHAN et al. / Turk J Biol
References
Alajlani M, Shiekh A, Hasnain S, Brantner A (2016). Purification of
bioactive lipopeptides produced by Bacillus subtilis strain BIA.
Chromatographia 79 (21): 1527-1532. doi: 10.1007/s10337016-3164-3
Andersen JB, Koch B, Nielsen TH, Sørensen D, Hansen M, Nybroe
O, Christophersen C, Sørensen J, Molin S, Givskov M (2003).
Surface motility in Pseudomonas sp. DSS73 is required for
efficient biological containment of the root-pathogenic
microfungi Rhizoctonia solani and Pythium ultimum.
Microbiology 149 (1): 37-46. doi: 10.1099/mic.0.25859-0
Biniarz P, Coutte F, Gancel F, Łukaszewicz, M (2018). Highthroughput optimization of medium components and culture
conditions for the efficient production of a lipopeptide
pseudofactin by Pseudomonas fluorescens BD5. Microbial Cell
Factories 17 (1): 1-18. doi: 10.1186/s12934-018-0968-x
Bradford MM (1976). A rapid and sensitive method for the
quantitation of microgram quantities of protein utilizing the
principle of protein-dye binding. Analytical Biochemistry 72
(1-2): 248- 254. doi: 10.1016/0003-2697(76)90527-3
Cao Y, Xu Z, Ling N, Yuan Y, Yang X et al. (2012). Isolation and
identification of lipopeptides produced by B. subtilis SQR 9 for
suppressing Fusarium wilt of cucumber. Scientia Horticulturae
135 (2012): 32-39. doi: 10.1016/j.scienta.2011.12.002
Chauhan V, Kanwar SS (2021). Lipopeptide(s) associated with
human microbiome as potent cancer drug. Seminars in cancer
biology. 70: 128-133. doi: 10.1016/j.semcancer.2020.06.012
Chen SY, Lu WB, Wei YH, Chen WM, Chang JS (2007). Improved
production of biosurfactant with newly isolated Pseudomonas
aeruginosa S2. Biotechnology Progress 23 (3): 661-666. doi:
10.1021/bp0700152.
Das P, Mukherjee S, Sen R (2008). Antimicrobial potential of a
lipopeptide biosurfactant derived from a marine Bacillus
circulans. Journal of Applied Microbiology 104 (6): 1675-1684.
doi: 10.1111/j.1365-2672.2007.03701.x
Deepika KV, Kalam S, Sridhar PR, Podile AR, Bramhachari PV
(2016). Optimization of rhamnolipid biosurfactant production
by mangrove sediment bacterium Pseudomonas aeruginosa
KVD-HR42 using response surface methodology. Biocatalysis
and Agricultural Biotechnology 5 (2016): 38-47. doi: 10.1016/j.
bcab.2015.11.006
Diwaniyan S, Sharma KK, Kuhad RC (2011). Laccase from an
alkalitolerant basidiomycetes Crinipellis sp. RCK-1: production
optimization by response surface methodology. Journal of
Basic Microbiology 52 (4): 1–11. doi: 10.1002/jobm.201100018
Fang FR, Zhong S, Dong Y, Gong LJ (2014). Extraction and
antifungal activity of a lipopeptide biosurfactant. Advanced
Materials Research 936: 669-673. doi: 10.4028/www.scientific.
net/AMR.936.669
708
Fonseca RR, Silva AJR, De Franỗa FP, Cardoso VL, Sộrvulo EFC
(2007). Optimizing carbon/nitrogen ratio for biosurfactant
production by a Bacillus subtilis strain. In: Mielenz JR, Klasson
KT, Adney WS, McMillan JD. (editors). Applied Biochemistry
and Biotechnology: ABAB Symposium. Humana Press, pp.
471-486. doi: 10.1007/978-1-60327-181-3_40
Gangadharan D, Sivaramakrishnan S, Nampoothiri KM, Sukumaran
RK, Pandey A (2008). Response surface methodology for
the optimization of alpha amylase production by Bacillus
amyloliquefaciens. Bioresource Technology 99 (11): 4597-4602.
doi: 10.1016/j.biortech.2007.07.028
Geissler M, Oellig C, Moss K, Schwack W, Henkel M (2017).
High- performance thin-layer chromatography (HPTLC)
for the simultaneous quantification of the cyclic lipopeptides
surfactin, iturin A and fengycin in culture samples of Bacillus
species. Journal of Chromatography B 1044 (2017): 214-224.
doi: 10.1016/j.jchromb.2016.11.013
Geudens N, Martins JC (2018). Cyclic lipodepsipeptides from
Pseudomonas spp.–biological swiss-army knives. Frontiers in
Microbiology 1867. doi: 10.3389/fmicb.2018.01867
Eswari JS, Anand M, Venkateswarlu C (2016). Optimum culture
medium composition for lipopeptide production by Bacillus
subtilis using response surface model-based ant colony
optimization. Sadhana 41 (1): 55-65. doi: 10.1007/s12046-0150451-x
Hmidet N, Ben Ayed H, Jacques P, Nasri M (2017). Enhancement
of surfactin and fengycin production by Bacillus mojavensis
A21: application for diesel biodegradation. BioMed Research
International doi: 10.1155/2017/5893123
Janek T, Rodrigues LR, Gudiña EJ, Czyżnikowska Ż (2016). Structure
and mode of action of cyclic lipopeptide pseudofactin II with
divalent metal ions. Colloids and Surfaces B: Biointerfaces 146:
498–506. doi: 10.1016/j.colsurfb.2016.06.055
Khusro A, Kaliyan BK, Al-Dhabi NA, Arasu MV, Agastian P
(2016). Statistical optimization of thermo-alkali stable
xylanase production from Bacillus tequilensis strain ARMATI.
Electronic Journal of Biotechnology 22 (2016): 16–25. doi:
10.1016/j.ejbt.2016.04.002
Kim TK (2017). Understanding one-way ANOVA using conceptual
figures. Korean Journal of Anesthesiology 70 (1): 22. doi:
10.4097/kjae.2017.70.1.22
Koumoutsi A, Chen XH, Henne A, Liesegang H, Hitzeroth G et
al. (2004). Structural and functional characterization of gene
clusters directing nonribosomal synthesis of bioactive cyclic
lipopeptides in Bacillus amyloliquefaciens strain FZB42. Journal
of Bacteriology 186: 1084-1096. doi: 10.1128/JB.186.4.10841096.2004
CHAUHAN et al. / Turk J Biol
Kumar PS, Ngueagni PT (2021). A review on new aspects of
lipopeptide biosurfactant: Types, production, properties and its
application in the bioremediation process. Journal of Hazardous
Materials 407: 124827. doi: 10.1016/j.jhazmat.2020.124827
Patel R, Dadida C, Sarker K, Sen DJ (2015). Sudan dyes as lipid
soluble aryl-azo naphthols for microbial staining. European
Journal Pharmaceutical and Medical Research 2 (3): 417-419.
Lee KJ, Moreno-Betancur M, Kasza J, Marschner IC, Barnett AG et
al. (2019) Biostatistics: a fundamental discipline at the core of
modern health data science. The Medical Journal of Austalia
211 (10): 444. doi: 10.5694/mja2.50372
Paul M, Nayak DP, Thatoi H (2020). Optimization of xylanase from
Pseudomonas mohnii isolated from Simlipal biosphere reserve,
Odisha, using response surface methodology. Journal of
Genetic Engineering and Biotechnology 18 (2020): 1-19. doi:
10.1186/s43141-020-00099-7
Maksimov IV, Singh BP, Cherepanova EA (2020). Prospects and
applications of lipopeptide-producing bacteria for plant
protection. Applied Biochemistry and Microbiology 56 (1):
15–28. doi: 10.1134/S0003683820010135
Raaijmakers JM, De Bruijn I, Nybroe O, Ongena, M (2010). Natural
functions of lipopeptides from Bacillus and Pseudomonas:
more than surfactants and antibiotics. FEMS Microbiology
Reviews 34 (6): 1037-1062.
Matsui K, Kan Y, Kikuchi J, Matsushima K, Takemura M et al.
(2020). Stalobacin: Discovery of novel lipopeptide antibiotics
with potent antibacterial activity against multidrug-resistant
bacteria. Journal of Medicinal Chemistry 63 (11): 6090-5. doi:
10.1021/acs.jmedchem.0c00295
Rangarajan V, Dhanarajan G, Kumar R, Sen R, Mandal M (2012).
Time‐ dependent dosing of Fe2+ for improved lipopeptide
production by marine Bacillus megaterium. Journal of
Chemical Technology & Biotechnology 87 (12): 1661-1669.
doi: 10.1002/jctb.3814.
Meena KR, Tandon T, Sharma A, Kanwar SS, (2018). Lipopeptide
antibiotic production by Bacillus velezensis KLP2016. Journal
of Applied Pharmaceutical Science 8 (3): 91-98. doi: 10.7324/
JAPS.2018.8313
Razafindralambo H, Paquot M, Hbid C, Jacques P, Destain J et al.
(1993). Purification of antifungal lipopeptides by reversedphase high-performance liquid chromatography. Journal
of Chromatography A 639 (1): 81-85. doi: 10.1016/00219673(93)83091-6
Morikawa M, Hirata Y, Imanaka T (2000). A study on the structure–
function relationship of lipopeptide biosurfactants. Biochimica
et Biophysica Acta–Molecular and Cell Biology of Lipids 1488
(3): 211-8. doi: 10.1016/S1388-1981(00)00124-4
Mukherjee D, Rooj B, Mandal U (2021). Antibacterial biosurfactants.
In: Inamuddin, Ahamed MI, Prasad R (editors). Microbial
Biosurfactants, Environmental and Microbial Biotechnology.
Springer, Singapore, pp. 271-291. doi: 10.1007/978-981-156607-3_13
Myers RH, Montgomery DC, Anderson-Cook CM (2016). Response
surface methodology: process and product optimization using
designed experiments. John Wiley & Sons.
Nair SS (2013). Experimental investigation of multipass tig welding
using response surface methodology. International Journal of
Mechanical Engineering and Robotics Research 2 (3): 242–254.
Nielsen TH, Thrane C, Christophersen C, Anthoni U, Sørensen
J (2000). Structure, production characteristics and fungal
antagonism of tensin–a new antifungal cyclic lipopeptide
from Pseudomonas fluorescens strain. Journal of Applied
Microbiology 89 (6): 992-1001. doi: 10.1046/j.13652672.2000.01201.x
Shruti G, Kanwar SS (2021). Optimization of growth conditions
for oxalate decarboxylase production from Pseudomonas
sp. OXDC12 and in vitro inhibition of calcium oxalate
crystallization by oxalate decarboxylase. Current Biotechnology
10:2021. doi: 10.2174/2211550110666210726154149
Palvannan T, Kumar PS (2010). Production of laccase from Pleurotus
florida NCIM 1243 using plackett–burman design and
response surface methodology. Journal of Basic Microbiology
50 (4): 325–335. doi: 10.1002/jobm.200900333
Rocha MVP, Souza MCM, Benedicto SCL, Bezerra MS, Macedo
GR et al. (2007). Production of biosurfactant by Pseudomonas
aeruginosa grown on cashew apple juice. In: Mielenz JR,
Klasson KT, Adney WS, McMillan JD (editors). Applied
Biochemistry and Biotechnology. ABAB Symposium. Humana
Press. pp 37-140.
Schlusselhuber M, Godard J, Sebban M, Bernay B, Garon D et al.
(2020). Corrigendum: characterization of Milkisin, a novel
lipopeptide with antimicrobial properties produced by
Pseudomonas sp. UCMA 17988 isolated from bovine raw
milk. Frontiers in Microbiology. 11: 1323. doi: 10.3389/
fmicb.2020.01323
Sivapathasekaran C, Das P, Mukherjee S, Saravanakumar, J, Mandal
M et al. (2010). Marine bacterium derived lipopeptides:
characterization and cytotoxic activity against cancer cell lines.
International Journal of Peptide Research and Therapeutics 16
(4): 215-222. doi: 10.1007/s10989-010-9212-1
Smyth T, Perfumo A, McClean S, Marchant R, Banat I (2010).
Isolation and analysis of lipopeptides and high molecular
weight biosurfactants. In: Timmis KN (editors) Handbook of
Hydrocarbon and Lipid Microbiology. Springer, Berlin, pp.
3688-3704. doi: 10.1007/978-3-540-77587-4_290
Tagg J (1971). Assay system for bacteriocins. Applied Microbiology
21 (5): 943.
Verma P, Yadav AN, Khannam KS, Mishra S, Kumar S et al.
(2019). Appraisal of diversity and functional attributes of
thermotolerant wheat associated bacteria from the peninsular
zone of India. Saudi journal of biological sciences 26 (7): 18821895. doi: 10.1016/j.sjbs.2016.01.042
709
CHAUHAN et al. / Turk J Biol
Vigneshwaran C, Vasantharaj K, Krishnanand N, Sivasubramanian
V (2021). Production optimization, purification and
characterization of lipopeptide biosurfactant obtained from
Brevibacillus sp. AVN13. Journal of Environmental Chemical
Engineering 9 (1): 104867. doi: 10.1016/j.jece.2020.104867
Wu JY, Yeh KL, Lu WB, Lin CL, Chang JS (2008). Rhamnolipid
production with indigenous Pseudomonas aeruginosa EM1
isolated from oil-contaminated site. Bioresource Technology
99 (5): 1157-1164. doi: 10.1016/j.biortech.2007.02.026
Yao D, Ji Z, Wang C, Qi G, Zhang L et al. (2012). Co-producing iturin
A and poly-γ-glutamic acid from rapeseed meal under solid
state fermentation by the newly isolated Bacillus subtilis strain
3-10. World Journal of Microbiology and Biotechnology 28 (3):
985-991. doi: 10.1007/s11274-011-0896-y
710
Zhao X, Han Y, Tan XQ, Wang J, Zhou ZJ (2014). Optimization of
antifungal lipopeptide production from Bacillus sp. BH072 by
response surface methodology. Journal of Microbiology 52 (4):
324-332. doi: 10.1007/s12275-014-3354-3
Zheng ZM, Wang TP, Wu Q (2013). Optimization of culture
conditions for biosynthesis of lipopeptide by Bacillus Subtilis
with starch. In: Tang X, Chen X, Dong Y, Wei X, Yang Q
(editors). Applied Mechanics and Materials. Trans Tech
Publications Ltd, pp. 225-229. doi: 10.4028/www.scientific.net/
AMM.291-294.225
Zhu Z, Zhang B, Cai Q, Ling J, Lee K et al. (2020). Fish waste based
lipopeptide production and the potential application as a biodispersant for oil spill control. Front. Bioeng Biotechnol. 8: 734.
doi: 10.4028/www.scientific.net/AMM.291-294.225