Measuring the market risk for the selected asean countries a value at risk approach
Bạn đang xem bản rút gọn của tài liệu. Xem và tải ngay bản đầy đủ của tài liệu tại đây (1.64 MB, 88 trang )
MINISTRY OF EDUCATION & TRAINING
HO CHI MINH CITY OPEN UNIVERSITY
-----------------------------------------------
DANG TUONG THUAN
MEASURING THE MARKET RISK FOR THE
SELECTED ASEAN COUNTRIES:
A VALUE-AT-RISK APPROACH
THESIS OF MASTER OF FINANCE AND BANKING
HCMC – May 2018
MINISTRY OF EDUCATION & TRAINING
HO CHI MINH CITY OPEN UNIVERSITY
-----------------------------------------------
DANG TUONG THUAN
MEASURING THE MARKET RISK FOR THE
SELECTED ASEAN COUNTRIES:
A VALUE-AT-RISK APPROACH
Major:
Finance and Banking
Major Code:
60 34 02 01
THESIS OF MASTER OF FINANCE AND BANKING
Academic Supervisor:
Dr. VO HONG DUC
DECLARATION
I hereby declare, that this thesis, “Measuring the market risk for the selected
ASEAN countries: A Value-at-Risk approach” is written and submitted by me
in fulfillment of the requirements for Master of Finance and Banking Program in
Ho Chi Minh City Open University. I further proclaim that this work is my original
result which is drawn on material collected by me. It has not been submitted for any
other subjects or equivalent course.
HCMC, May 2018
Dang Tuong Thuan
i
ACKNOWLEDGEMENT
I would like to thank all those whose assistance proved to be a milestone in the
accomplishment of my end goal.
First and foremost, I would like to express a special appreciation to my academic
advisor – Dr. Vo Hong Duc, for his supports, guidance and patience. It is obviously
a privilege of mine.
I would like to thank my dear friends for their encouragements. Especially, I want
to give back a whole meaning of thank you to my fellow friend Pham Ngoc Thach
for his countless supports on along the writing process.
Finally, I would like to thank my family, my parents, sisters and brother, who are
always behind me unconditionally on the road I have been.
ii
ABSTRACT
One of the key concepts of risk measurements in financial and industrial sector
is the probability-based risk measurement method known as Value-at-Risk or VaR.
The results produced by a VaR model are simple for all levels of staff from all areas
of an organization to understand and appreciate. That is why VaR has been adopted
so rapidly. While VaR is an important issue for banks since its adoption as a primary
risk metric in the Basel Accords, there has been little investigation of industry based
VaR or CVaR metrics in to the author’s knowledge.
This study is designed to achieve two main objectives. First, determining and
measuring a relative level of market risk for each of the all industries of selected
countries, including Vietnam, Singapore, Malaysia and Thailand from 2007-2016.
Second, the estimates of Beta in CAPM are then compared with the relative level
of risk exhibited by key industries obtained from the VaR and CVaR techniques.
The findings are noticeable. First, by both historical and parametric VaR, finance
and real estate are ranked to be the highest risk industries in Vietnam throughout
the 10-year period. However, there are differences of industry risk rakings in other
countries, being Singapore, Thailand and Malaysia. Second, by CAPM, energy
businesses face a relatively higher risk in comparison with the market as the whole,
following by finance, material and estate. This result is somehow consistent with
VaR. However, the divergence is that the relatively rankings of Utility sector by
two method are completely opposite.
Keywords: Value at Risk, Conditional Value at Risk, industry risk, CAPM,
ASEAN
iii
“Research is formalized curiosity. It is poking and prying with a purpose.”
Zora Neale Hurston
iv
TABLE OF CONTENTS
DECLARATION .................................................................................................... i
ACKNOWLEDGEMENT .................................................................................... ii
ABSTRACT .......................................................................................................... iii
TABLE OF CONTENTS ...................................................................................... v
ABBREVIATIONS .............................................................................................. vii
LIST OF FIGURES ............................................................................................ viii
LIST OF TABLES ................................................................................................ ix
CHAPTER 1: INTRODUCTION ........................................................................ 1
1.1. Problem statement ...................................................................................... 1
1.2.
Research objectives .................................................................................. 3
1.3.
Research questions ................................................................................... 3
1.4.
Contribution of thesis .............................................................................. 4
1.5.
Structure of thesis .................................................................................... 5
CHAPTER 2: LITERATURE REVIEW ............................................................ 6
2.1.
Theoretical ................................................................................................ 6
2.1.1.
Risk: Definitions and classifications ................................................ 6
2.1.2.
Market risk measurements............................................................... 7
2.1.2.1.
Value-at-Risk .................................................................................. 7
2.1.2.2.
Conditional Value at Risk ........................................................... 19
2.1.2.3.
CAPM ........................................................................................... 19
2.2.
Empirical studies .................................................................................... 21
2.2.1.
Value-at-Risk ................................................................................... 21
2.2.2.
Conditional Value-at-Risk .............................................................. 23
v
2.2.3.
CAPM - Beta .................................................................................... 23
CHAPTER 3: RESEARCH METHODOLOGY AND DATA ........................ 28
3.1. Data ............................................................................................................. 28
3.2.
Research methodology – the Models .................................................... 32
3.3.
Hypothesis ............................................................................................... 38
CHAPTER 4: RESEARCH RESULTS AND DICUSSION ............................ 41
4.1.
VaR and CVaR ....................................................................................... 41
4.1.1.
Vietnam ............................................................................................ 41
4.1.2.
Malaysia – Singapore – Thailand .................................................. 49
4.1.3.
Market risk by VaR and CVaR among countries ........................ 52
4.1.4.
Test results ....................................................................................... 58
4.2.
Beta estimation ....................................................................................... 60
4.3.
Comparison in Vietnam ........................................................................ 64
CHAPTER 5: CONCLUSION AND IMPLICATIONS ................................. 67
5.1.
Concluding remark ................................................................................ 67
5.2.
Implications ............................................................................................ 68
5.2.1.
For Vietnamese government .......................................................... 68
5.2.2.
For investors .................................................................................... 69
5.2.3.
For academic purposes ................................................................... 70
5.3.
Limitations and further research ......................................................... 70
REFERENCES .................................................................................................... 71
vi
ABBREVIATIONS
AEC
ASEAN Economic Community
ASEAN
Association of Southeast Asian Nations
BCBS
Basel Committee on Banking Supervision
CAPM
Capital Asset Pricing Model
CVaR
Conditional Value-at-Risk
LAD
Least Absolute Deviations
OLS
Ordinary Least Square
VaR
Value-at-Risk
vii
LIST OF FIGURES
Figure 2.1. Three pillars of Basel II ........................................................................ 8
Figure 2.2 Distribution of daily return of QQQ (Variance – Covariance) ............ 13
Figure 2.3 Distribution of daily return of QQQ (Historical) ................................. 14
Figure 2.4 Distribution of daily return of QQQ (Monte Carlo) ............................ 16
Figure 4.1 Historical VaR and CVaR in Vietnam (2007-2016) ............................ 44
Figure 4.2 VaR rankings shift in Vietnam............................................................. 47
Figure 4.3. CVaR rankings shift in Vietnam ......................................................... 49
viii
LIST OF TABLES
Table 1. Comparison of VaR ................................................................................. 17
Table 2. Sector breakdown .................................................................................... 28
Table 3. Daily market price movements in 4 countries (Vietnam, Malaysia,
Singapore and Thailand) ........................................................................................ 30
Table 4. Matrix Variance-Covariance Calculation for a Two-Asset Portfolio .............. 37
Table 5. VaR and CVaR summary over 10-year period in Vietnam .................... 42
Table 6. VaR results over periods: in crisis and post-crisis in Vietnam ............... 45
Table 7. VaR rankings changes in Vietnam .......................................................... 47
Table 8. CVaR rankings changes in Vietnam ....................................................... 48
Table 9. VaR results of three other countries over whole study period ................ 51
Table 10. VaR rankings of 4 countries in comparison in the GFC period ............ 53
Table 11. CVaR rankings of 4 countries in comparison in the GFC period ......... 54
Table 12. VaR rankings of 4 countries in comparison in the post-GFC period .... 56
Table 13. CVaR rankings of 4 countries in comparison in the post-GFC period . 57
Table 14. Hypothesis testing Using the Spearman Rank Correlation Test ........... 59
Table 15. Hypothesis testing Using the Kruskal-Wallis Test ............................... 60
Table 16. Beta estimates Using CAPM (period 2007 – 2009) .............................. 62
Table 17. Beta estimates Using CAPM (period 2010 – 2016) .............................. 63
Table 18. Comparison between Beta and VaR ...................................................... 65
ix
CHAPTER 1: INTRODUCTION
1.1. Problem statement
The Association of Southeast Asian Nations (the “ASEAN”) is a regional
organization comprising ten Southeast Asian nations. The organization promotes
inter-governmental cooperation and facilitates economic integration amongst its
members. Since its formation on the August 8th, 1967 on the initiatives of
Indonesia, Malaysia, the Philippines, Singapore, and Thailand. The organization's
membership has since then expanded to include Brunei, Cambodia, Laos, Myanmar
(Burma), and Vietnam. Its principal aims accelerating economic growth, social
progress, and sociocultural evolution among its members, alongside with regional
stability and the provision of a mechanism for member countries to resolve
differences on the ground of peace and respect. Since the establishment and
expansion, the members in the ASEAN have integrated deeper and wider in all
aspects, especially on economic aspect in which most of tariffs have been removed
to ease the flows of goods and services among members in the region (Worldatlas,
2016).
In particular, in recent time, the establishment of the ASEAN Economic
Community (the “AEC”) in December 2015 is a major milestone in the regional
economic integration agenda within the ASEAN, offering opportunities in the form
of a huge market of US$2.6 trillion and over 622 million people. Having grounded
on a ‘smallest common denominator’ approach that emphasized harmonious
relations and respect of national sovereignties, the ASEAN countries have also
developed trade through ambitious economic treaties and free-trade agreements
for the Southeast Asia region. In 2014, the AEC was collectively the third largest
economy in the Asia region and the seventh largest in the world (ASEAN Economic
Community, 2016).
However, it is generally argued that every coin has two sides. Economic
integration could potentially bring opportunities to the ASEAN countries; however,
it could also cause challenges such as higher costs related to implementing
economic integration across such economically and culturally diverse members of
the organization. The ASEAN is an economic organization which has diverse
1
patterns of economic growth and each country is at different level of the economic
development. Most ASEAN countries are considered low-middle income countries,
whereas a few such as Singapore and Brunei are better positioned economically.
The prevailing income inequality within some of the ASEAN countries could
become even wider post AEC integration. Some ASEAN countries have exhibited
high inflation. The disparity of income could result in dissimilar price levels and
unequal purchasing power across the ASEAN country members. Different
purchasing power will no doubt provide some members with the capacity to
purchase more goods from another member country. Also, different levels of
inflation could result in different levels of investment due to different responses
from monetary policies. This could inadvertently lead to some sectors and
industries incurring economic losses and to some workers in the less economically
stable countries to consider migrating to more economically prosperous member
countries.
The ASEAN economies are currently in vastly different stages of
development, with large differences between high-saving economies, such as
Brunei, Malaysia, and Singapore, and low-saving economies, such as Cambodia,
Laos, and the Philippines. A survey by the American Chamber of Commerce
located in Singapore in Dec 2015 presented that multinational companies in the
ASEAN planned their expansion on a variety of reasons including some “pull
factors” in relation to the attractiveness of the market, the relative absence of risk
in the relevant markets, including political, corruption and security risks (Asian
Development Bank, 2016).
Vietnam, with its stable economic development together with other member
countries, is going to be a next young Tiger in the Asian region for the next decade
or so. Consequently, the participation of both foreign individual investors and
multinational corporations recently in Vietnam has been significantly increasing
over the last two decades. The increase in the foreign capital inflow to the country
indicates a good signal in relation to the attractiveness of the Vietnamese economy
in general, and the Vietnamese financial market in particular. As always, new
investors need information to determine their investment decisions. Needless to say,
assessing a level of risk given a level of rate of expected return is no doubt essential,
2
particular when all industries are relevant, and as such, considered for their
investment. As a result, a risk measurement to provide guidance to investors is
necessarily required in the context of the Vietnamese financial market.
In addition, the formation of the ACE in the region has put forward a credible
threat to various industries in Vietnam because Vietnam and other ASEAN
members share relative strengths of some sectors in comparison with the other
sectors in the economy. As such, assessing and measuring the risks of various key
industries from Vietnam are indeed important to provide timely recommendations
for policy makers.
In response to the above mentioned opportunities and challenges arisen from
the formation of the ACE in December 2015, and for any other economic and
financial agreements Vietnam may pursue in the near future, including the TPP if
this agreement comes to term under the new American President regime, the study
entitled “Measuring the market risk for the ASEAN: A Value-at-Risk
approach” is conducted.
1.2. Research objectives
This study is conducted in order to achieve the following two key objectives:
First, determining and measuring a relative level of market risk for each of
the all industries of selected countries where data are publicly available for
an extended period of time of 10 years or so, being Vietnam, Thailand,
Singapore, and Malaysia of the ASEAN region on the ground of the stateof-the-art in the international financial market using VaR and CVaR
techniques.
Second, a conventional market risk, known as Beta in the capital asset
pricing model, is also estimated using quantile regression. The estimates
are then compared with the relative level of risk exhibited by key industries
obtained from the VaR and CVaR techniques.
1.3. Research questions
In order to achieve the above mentioned objectives, the following research
questions have been raised:
3
How substantial does the level of the market risk change between the
periods of pre-crisis and post-crisis in the 2008/2009 global financial crisis
using VaR and CVaR?
What are the currently prevailing levels of the market risk for all industries
in selected countries in the ASEAN, being Vietnam, Thailand, Singapore,
and Malaysia?
Whether or not the market risk level of all industries obtained from the
VaR and CVaR techniques and the conventional Beta are consistent?
1.4.
Contribution of thesis
The theory and practice of risk management have developed enormously since
the pioneering work of Harry Markowitz in the 1950s. The theory has developed to
the point where risk management is now regraded as a distinct subfield of the theory
of finance. At the heart of this subfield is the notion of good risk management
practice, and above thing else this requires an awareness of the qualitative and
organizational aspects of risk management: a good sense of judgement, an awareness
of “things can go wrong”, an appreciation of market history and so on. Therefore,
the main purpose of this study is measuring the market risks via new approaches –
VaR and CVaR, which could provide the key contributions as follows:
First, acknowledging the subsequent adoption of VaR over the world, VaR
concept is first-time applied on Vietnam securities in 2 levels: (i) calculate
VaR for 10 industries for the period of 10 years; (ii) calculate CVaR – an
extended concept of VaR – for all above industries. These two group of
results will contribute the empirical evidence for Vietnamese Government
to proceed as well as optimize the privatization and equitization. Moreover,
the results of this study provide investors the historical proofs that could
help them make the investment decisions.
Second, this study use conventional Beta as a critical factor. The values of
VaR and CVaR obtained would be compared with Betas, whether they are
consistent. This will also support a guidance to investors in using the risk
measurement techniques and making their investment decisions.
4
Third, due to the lack of the study associated with new risk measurements
which could have a number of significant attractions over the traditional
measures, this study may turn on the light for further research in Vietnam.
1.5.
Structure of thesis
This study is constructed as follows. The first chapter is Introduction. Chapter
2 presents the summary of literature relating to the risk measurements, especially
Value at Risk and Conditional Value at Risk approach. This section also reviews
some related previous empirical studies. Data description, research method and
model are presented in Chapter 3. After that, Chapter 4 presents the empirical
results. As the final section, Chapter 5 will summarize the main results along. Some
implications are supposed based on the results obtained from the previous chapter.
5
CHAPTER 2: LITERATURE REVIEW
This section will illustrate the theoretical background and empirical studies
applying relevant methods.
2.1.
Theoretical
This elective part cover one of the core concern of finance, namely risks. For
most kinds of activity, risk is unavoidable as long as the outcome is uncertain.
Therefore, a large proportion of the role of finance – the actions of the financial
specialist and the operations of the financial department within firms – is devoted
to handling, controlling and profiting from risk.
2.1.1. Risk: Definitions and classifications
The concept of risk as the risk associated with financial outcomes of one sort
or another, but the term “risk” itself is very difficult to pin down precisely. It evokes
notions of uncertainty, randomness and probability. The random outcomes to which
it alludes might be good or bad. The notions of “risk” in its broadest sense therefore
has many facets, and there is no single definition of risk that can be completely
satisfactory in every situation. There are multiple definitions of risk. Everyone has
a definition of what risk is, and everyone recognizes a wide range of risk. As
discussed in Apostolik (2015), some of the more widely discussed definitions of
risk include the following: (i) The likelihood an undesirable event will occur; (ii)
The magnitude of loss from an unexpected event; (iii) The probability that “things
will not go well”; and (iv) The effect of an adverse outcome. In the close view,
Jordio (2007) defined risk can be as the volatility of unexpected outcomes,
generally the value of assets or liabilities of interest.
Firms are exposed to various types of risks, which can be broadly classified
into business and nonbusiness risks. Business risks are those which corporations
willingly assume to create a competitive advantages and add values for
shareholders. Business, or operating, risk pertains to the product market in which a
firm operates and includes technological innovations, product design, and
marketing. Business activities also include exposure to macroeconomic risks, which
result from economic cycles, or fluctuations in incomes and monetary policies.
Other type of risks, over which firms have no control, can be grouped into
6
nonbusiness risks. These include strategic risk, which result from fundamental
shifts in the economy or political environment. These risks are difficult to hedge,
except by diversifying across business lines and countries. Finally, financial risks
can be defined as those which relate to possible losses in financial markets, such as
losses due to interest rate movements or default on financial obligations. Exposure
to financial risks can be optimized carefully so that firms can concentrate on what
they to best – manage exposure to business risks.
2.1.2. Market risk measurements
The main concern in this study is the measurement of one particular form of
financial risk – namely, market risk, or the risk of loss (or gain) arising from
unexpected changes in market prices or market rates. Market risks, in turn, can be
classified into interest rate risk, equity risk, exchange rate risk, commodity price
risk, and so on, depending on whether the risk factor is an interest rate, a stock price
or another random variable. Market risk can also be distinguished from other form
of financial risk, particularly credit risk and operational risk.
There are several techniques of market risk measurement have developed over
years. However, this study delineate three objective tools that are used.
2.1.2.1.
Value-at-Risk
Value at Risk is probably the most widely used risk measure in finance. It
has become the classic measurement that financial executives use to quantify
market risk.
Basel II
In 1988, the Basel I Capital Accord represented the first step toward risk-based
capital adequacy requirements. The accord was an agreement by the members of
the Basel Committee on Banking Supervision (BCBS) with respect to minimum
regulatory capital for credit risk. Credit risk is the possibility of a loss as a result of
a situation that those who owe money to the bank may not fulfil their obligation.
Regulatory capital refers to the risk-based capital requirements under the Capital
Accord. The purpose of regulatory capital is to ensure adequate resources are
available to absorb bank-wide unexpected losses (Bank of International Settlement,
2006).
7
In January 2001, the BCBS released its proposal for a new Accord which is
the successor of the Basel I Capital Accord, called the Basel II Capital Accord. The
Basel II Capital Accord attempts to improve the Basel I Capital Accord in the
following grounds: (i) In the Basel II, Capital Accord banks are granted a greater
flexibility to determine the appropriate level of capital to be held in reserve
according to their risk exposure; (ii) the Basel II Capital Accord focuses on the
enhancement of the stability and reliability of the international financial system;
and (iii) the Basel II Capital Accord stimulates the improvement of risk
management.
The Basel I Capital Accord focused only on minimum regulatory capital
requirements. The Basel II Capital Accord broadens this focus by describing the
supervisory process in the Basel II Capital Accord by the “three pillars”:
-
Pillar 1 - Minimal regulatory capital requirements;
-
Pillar 2 - Supervisory review of capital adequacy;
-
Pillar 3 - Market discipline and disclosure;
The focus of the paper lies in the measurement of credit risk, which is
extensively described in Pillar 1. Contents of the Pillars are briefly discussed in the
section credit risk measurement.
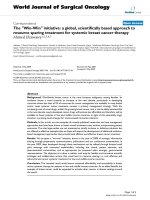
Source: Bank of International Settlement
Figure 2.1.
Three pillars of Basel II
8
Pillar 1 - Minimum Regulatory Capital Requirements
For the first pillar of the Basel II Capital Accord the Basel Committee
proposed capital requirements associated with three categories of risk:
Market Risk
Market Risk is the risk that the value of an investment will decrease due to
moves in market factors. Within the Basel II Capital Accord, there are two methods
to measure market risk: The Standardized Approach and the Internal Models
Approach.
Operational Risk
Operational risk is defined in the Basel II as the risk of loss resulting from
inadequate or failed internal processes, people and systems, or from external events.
Three different methods can be used to measure operational risk: The Basic
Indicator Approach, the Standardized Approach and the Advanced Measurement
Approach.
Credit Risk
Credit risk is the possibility of a loss as a result of a situation that those who
owe money to the bank may not fulfil their obligation. The following methods can
be used to determine credit risk: The Standardized Approach, The Foundation
Internal Rating Based Approach and the Advanced Rating Based Approach. The
Standardized Approach provides improved risk sensitivity compared to Basel I. The
two IRB approaches, which rely on banks’ own internal risk ratings, are
considerably more risk sensitive.
Pillar 2 - Supervisory review of capital adequacy
The second pillar of Basel II is a supervisory review of capital adequacy. The
second pillar notes that national supervisors must ensure that banks develop an
internal capital assessment process and set capital targets consistent with their risk
profiles. Furthermore it encourages the bank’s management to develop risk
management techniques and their use within capital management. The supervisors
are responsible for evaluating how well banks are assessing their capital adequacy
9
needs relative to their risks. Internal processes of the bank are subject to supervisory
review and intervention. In the Netherlands the role of supervisor is fulfilled by the
Dutch Central Bank, “De Nederlandsche Bank” (DNB).
Pillar 3 - Market discipline and disclosure
The third pillar of the Basel II Capital Accord is about market discipline and
disclosure. The main goal of this pillar is to promote the development of financial
reporting about risks. In this way market participants can get a better understanding
of banks risks profiles and the adequacy of their capital position by disclosure. Pillar
3 in the Basel II Capital Accord sets out disclosure requirements and
recommendations in several areas. These requirements apply to all banks and when
a bank cannot meet these requirements it can be constrained in the way it manages
capital. For example the bank may not use any of the advanced techniques under
Pillar 1.
The concept of VaR has now been incorporated in the Basel II Capital Accord.
Understanding VaR and its application in risk management is essential for
understanding the Basel II Capital Accord (Munniksma, 2006).
Value at Risk
The groundbreaking 1988 Basel Capital Accord (Basel I), originally signed by
Group of Ten (G10), but since largely adopted by over 100 countries, requires
Authorized Deposit Taking Institution to hold sufficient capital to provide a cushion
against with unexpected losses. Value at Risk (VaR) is a procedure designed to
forecast the maximum expected loss over a target horizon, given a confidence limit.
Initially, the Basel Accord stipulated a standardized approach which all institutions
were required to adopt in calculating the capital required for market and credit risk.
This approach suffered from several deficiencies, the most notably of which were
its conservatism and its failure to reward institution with superior risk management
expertise.
In recent years, the tremendous growth of trading activity, together with the
well-publicized trading losses of well-known financial institution (see Jorion, 2007)
has led financial regulators and supervisory committees to favor using quantitative
techniques to appraise possible losses that these institutions can incur. Of these
10
techniques, VaR has become one of the most popular as it provide the simple
answer to the following question with a given confidence level (say 95 or 99
percent), what is the predicted financial loss over given a time horizon? Loosely
speaking, VaR of a portfolio is the maximum loss may suffer in the course of
holding period, during which the composition of the portfolio remains unchanged
(Huang, 2004). The other definition and methodology is described in several
references, for examples, the research of Choudhry (2004), Harper (2004) and
Danielsson & De Vries, (2000).
As Danielsson and De Vries, (2000), the VaR form the basic determination of
market risk capital. The formal definition of Value at Risk is easily given implicitly:
𝑃𝑟[∆𝑃∆𝑡 ≤ 𝑉𝑎𝑅] = 𝜋
(1)
where ∆𝑃∆𝑡 is a change in the market value of portfolio over time horizon ∆𝑡
with probability π. Equation (1) states that a loss equal to, or larger than the specific
VaR occurs with probability 𝜋. Or conversely, (1) for a given probability 𝜋 losses,
equal to or larger than the VaR, happen. In this latter interpretation, the VaR is
written as s function of the probability π. Let F(∆𝑃∆𝑡 )be the probability distribution
of ∆𝑃∆𝑡 , then:
𝐹 −1 (𝜋) = 𝑉𝑎𝑅
(2)
where 𝐹 −1 (𝜋) denotes the inverse of F(π). The major problem in implement
VaR analysis is the specification of the probability distribution F(π) which is used
in the calculation (1).
As generally presented, there are 3 methods to calculating VaR: (i) the
Variance-Covariance method estimate VaR an assumption of normal distribution;
(ii) the Historical method classifies historical losses in categories from the worst to
the best, on the assumption of history repeating itself; and (iii) Monte Carlo
Simulation simulates multiple random scenarios.
Each of these methods is
discussed in turn below.
Variance-Covariance
This method is base on an assumption of normally distributing. This approach
is well-documented by Choudhry (2004), in which VaR is calculated by the mean
and standard deviation of a single asset. When calculating VaR, it is usual practice
11
to not use actual asset figures, but the logarithm of the ratio of price relatives,
obtained by using the following calculation:
Rate of return = ln(
𝑃𝑡
)
𝑃𝑡−1
It means the logarithm of the ratio between today’s price and the previous
price. This is the initially formula used by RiskMetrics (J.P Morgan & Reuter,
1996), who introduced and popularized VaR. The normal distribution assumption
that is generally assumed to apply to financial time series observations implies
extreme negative values which are not observed in practice with share prices. Thus,
the lognormal distribution is considered more suitable for measuring share prices,
removing the probability of negative prices (Choudhry, 2004). The fact that,
investors usually compare asset performance in terms of returns, and it is the
simplest to assume these returns are normally distributed. It follows that the price
is lognormally distributed, i.e. ln(Pt/ Pt-1) is normally distributed and (Pt/ Pt-1) is
lognormally distributed (Alexander, 2001).
This paper quoted the obvious example of Harper (2004) to illustrate three
methods of calculating VaR. VaR was used to evaluate the risk of a single index
that traded like a stock: the NASDAQ 100 Index, which traded under the ticker
QQQ. The QQQ was a very popular index of the largest non-financial stocks that
traded on the NASDAQ exchange.
12
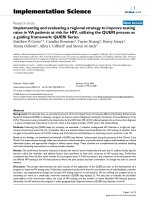
Source: Investopedia
Figure 2.2 Distribution of daily return of QQQ (Variance – Covariance)
The idea behind the variance-covariance that we used the familiar curve
instead of actual data. The advantage of the normal curve was that we automatically
know where the worst 5% and 1% lay on the curve. They were a function of our
desired confidence and the standard deviation (σ):
Confidence
VaR based on SD (σ)
95%
-1.65 x σ
99%
-2.33 x σ
According to the histogram, the blue curve above was based on the daily
standard deviation of the QQQ, which was 2.64%. Therefore,
-
With 95% confidence level, an investment portfolio amounting $100 has
VaR equivalent $4.36 (-1.65 x 2.64% x 100)
-
Similarly, with 99% confidence and the same previous portfolio, VaR
equivalent $6.15 (-2.33 x 2.64% x 100)
Historical
13
This approach groups the daily data from worst to best. For an example, at
95% confidence level, it will ascertain the lowest 5% of returns. Assume 250
observations, 5% = 12.5 observations. VaR will be the smallest of the losses
experienced in the 12.5 days. At 99% confidence level, the number of observations
is 2.5 (Choudhry, 2004). The problem with this approach is that the relative
weightings of assets could have been changing over the historical period. To
overcome this, a method called the historical simulation is used (Choudhry, 2004).
The 95th percent lowest value will be VaR at a confidence level 95% and the 99th
percent lowest value will be VaR at 99% confidence. For 50,000 simulations, this
will be 2,500th lowest number at 95% confidence and 500th lowest number at 99%
confidence level (Choudhry, 2004).
Following the instance above of QQQ in NASDAQ, the author put them in a
histogram that compared the frequency of return ‘buckets’. Specifically, at the
highest point of the histogram (the highest bar), there were more than 250 days
when the daily return was between 0% and 1%. At the far right, it can be barely
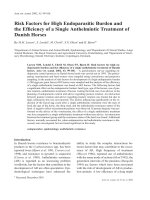
seen a tiny bar at 13%.
Source: Investopedia
Figure 2.3 Distribution of daily return of QQQ (Historical)
14