Synthesis, structural characterization, and antimicrobial efficiency of sulfadiazine azo-azomethine dyes and their bi-homonuclear uranyl complexes for chemotherapeutic use
Bạn đang xem bản rút gọn của tài liệu. Xem và tải ngay bản đầy đủ của tài liệu tại đây (1.34 MB, 14 trang )
Turk J Chem
(2015) 39: 267 280
ă ITAK
c TUB
Turkish Journal of Chemistry
/>
doi:10.3906/kim-1409-21
Research Article
Synthesis, structural characterization, and antimicrobial efficiency of sulfadiazine
azo-azomethine dyes and their bi-homonuclear uranyl complexes for
chemotherapeutic use
1
Abdalla M. KHEDR1,2,∗, Fawaz A. SAAD1
Chemistry Department, College of Applied Sciences, Umm Al-Qura University, Mecca, Saudi Arabia
2
Chemistry Department, Faculty of Science, Tanta University, Tanta, Egypt
Received: 19.09.2014
•
Accepted/Published Online: 16.11.2014
•
Printed: 30.04.2015
Abstract: Two sulfadiazine azo-azomethine dyes containing two active coordination centers and their bi-homonuclear
UO 2 (II)-complexes were synthesized for potential chemotherapeutic use. The ligands were prepared, starting from
the coupling of sulfadiazine dizonium salt with acetylacetone, followed by condensation with ethylenediamine and
1,6-hexanediamine (HL I and HL II ) using a modified literature procedure. The structures of the ligands and their
UO 2 (II)-complexes were elucidated by conventional and thermal gravimetric analyses, molar conductivity, magnetic
susceptibility, and IR, UV-Vis,
1
H NMR, and mass spectra. The analytical and spectral data supported the binuclear
formulation of the complexes with a 2:1 metal to ligand ratio and octahedral geometry. The molar conductance values
of the UO 2 (II)-complexes revealed their nonionic character. The ligands and their complexes were screened for their
antibacterial activities towards the gram-positive Staphylococcus aureus and the gram-negative Escherichia coli, as well as
their antifungal activities against Aspergillus niger and Candida albicans, in order to assess their antimicrobial potential.
The results showed that metallization increases antimicrobial activity compared with the free ligands.
Key words: Sulfadiazine, azo-azomethine dyes, bi-homonuclear UO 2 (II)-complexes, antimicrobial activities
1. Introduction
Sulfadiazine is a sulfonamide antibiotic and it is well known as one of the World Health Organization’s List
of Essential Medicines. It eliminates bacteria that cause infections by stopping the production of folate inside
the bacterial cell, and is commonly used to treat urinary tract infections (UTIs). 1 Colorants, which include
chromophores of dyes usually consisting of N=N, C=N, C=C aromatic and heterocyclic rings, containing oxygen,
nitrogen, or sulfur, have been widely used as dyes owing to their versatility in various fields including high
technology, such as biological staining, liquid crystalline displays, inkjet printers, textiles, and plastics, and in
specialized applications, such as food, drug, cosmetic, and photochemical production. 2−5 Azo dyes are widely
used in the textile industry and are the largest and most versatile group of synthetic organic dyes, with a
tremendous number of industrial applications. 6 Schiff bases have also been shown to exhibit a broad range
of biological activities, including antifungal, antibacterial, antimalarial, antiproliferative, anti-inflammatory,
antiviral, and antipyretic properties. 7,8 Schiff base metal complexes have the ability to reversibly bind oxygen
in epoxidation reactions, 9 biologically active compounds, 10 and catalytic hydrogenation of olefins. 11 Uranium
∗ Correspondence:
267
KHEDR and SAAD/Turk J Chem
is a symbolic element as it is the last natural element and it is the most common element of actinides and
has unique properties. Polynuclear metal complexes find wide applications in catalysis and materials science
as well as biological applications. 12−16 Such complexes usually display unique spectroscopic and magnetic
properties. 17−22 Keeping in mind the above facts, and in continuance of our interest in designing new ligands and
complexes, 19−28 the synthesis, characterization, and antimicrobial efficiency of two sulfadiazine azo-azomethine
dyes and their bi-homonuclear UO 2 (II)-complexes are reported. The compounds are expected to combine
the antibacterial activity of sulfadiazine azo-azomethine derivatives and antimicrobial activity of the metal ions,
which constitute an important field of research due to their pronounced antimicrobial and fungicidal activities. 29
2. Results and discussion
The structures of the ligands (HL I and HL II ) and corresponding UO 2 (II)-complexes were elucidated based
on IR, UV-Vis, 1 H NMR, and mass spectra; molar conductivity; magnetic susceptibility; and conventional and
thermal gravimetric analyses (Table 1).
Table 1. Physical and analytical data of sulfadiazine azo-azomethines (HL I and HL II ) and their UO 2 (II)-complexes a
(I and II).
Molecular formula
(Empirical formula)
Mol. Wt.
(Cal.
Mol. Wt.)
Color
(∆m )
HLI
(C17 H21 N7 O3 S)
[(UO2 )2 LI (AcO)3 (H2 O)]·H2 O
(C23 H33 N7 O15 SU2 ) (I)
HLII
(C21 H29 N7 O3 S)
[(UO2 )2 LII (AcO)3 (H2 O)]·H2 O
(C27 H41 N7 O15 SU2 ) (II)
403.00
(403.46)
1155.00
(1155.60)
459.00
(459.57)
1211.00
(1211.78)
Yellow (—)
(—)
Buff
(5.85)
Yellow
(—)
F.buff
(6.55)
Analytical data
Found% (Calcd.)
%Hydrated %Coordinated
H2 O
H2 O
—
—
%AcO−
%M
—
—
1.52
(1.56)
1.51
(1.56)
15.29
(15.33)
40.96
(41.20)
—
—
—
—
1.44
(1.49)
1.43
(1.49)
14.53
(14.62)
39.11
(39.29)
The synthesized complexes decompose without melting above 278 ◦ C.
The yield of the synthesized compounds was 80%–84%.
Mol. Wt. is the molecular weight obtained from mass spectra.
∆m is the molar conductance measured in Ohm−1 cm2 mol−1 .
a
2.1. Solubility and molar conductance
The metal chelates [(UO 2 )2 L I (AcO) 3 (H 2 O)] ·H 2 O (I) and [(UO 2 )2 L II (AcO) 3 (H 2 O)] ·H 2 O (II) are stable in
air and soluble in DMF and DMSO but insoluble in water and common organic solvents. Single crystals of the
metal chelates could not be isolated from any organic solution. The molar conductance values of the complexes
equal 5.85 and 6.55 Ω−1 cm 2 mol −1 for I and II, respectively, indicating that they are nonelectrolytes. This
confirms that the anions are inside the coordination sphere of the metal ion. 30
2.2. Conventional and thermal analyses
The thermal analysis results of the complexes I and II are in good agreement with the theoretical calculations.
The uranium contents in the complexes were identified gravimetrically using the standard method. 31 A weighed
268
KHEDR and SAAD/Turk J Chem
quantity of complex (0.4 ∼ 0.5 g) was treated with a few drops of conc. H 2 SO 4 and 1 mL of conc. HNO 3 . It
was heated until the organic matter decomposed and sulfur trioxide fumes came out. The same process was
repeated three to four times to decompose the complex completely. Then it was dissolved in water and the
resulting solution was used for analysis of the metal ion percentage. Uranium was precipitated as ammonium
diuranate, followed by sufficient ignition to its respective oxide. The nature and contents of water molecules
and acetate groups attached to the central metal ion were determined by conventional thermal decomposition
studies.
In a conventional thermal analysis, UO 2 (II)-complexes I and II were heated at four temperatures (100
◦
C, 200 ◦ C, 300 ◦ C, and 1000 ◦ C) in a muffle furnace for ≈50 min. The resulting weights were determined.
The weight loss at 100 ◦ C can be attributed to loss of lattice water from the complexes. The weight loss at 200
◦
C is due to loss of coordinated water. The weight loss at 300 ◦ C can be attributed to the removal of acetate
groups. The weight of the final product after heating at 1000 ◦ C corresponds to the formation of the metal
oxide as a final product. 32
Confirmation of the proposed molecular structure of the investigated complexes was carried out using
TGA from which information on their properties, nature of intermediate, and final products of their thermal
decomposition were obtained. 33 TGA curves were obtained for UO 2 (II)-complexes I and II. The mass losses
were calculated for the different decomposition steps and compared with those theoretically calculated for
the suggested formula based on analytical and spectral results as well as molar conductance measurements.
The results of TGA indicate the formation of metal oxide as the end product from which the metal content
is calculated and compared with that obtained from analytical determination. The results obtained for the
thermal decomposition patterns are presented in Table 2. The thermal decomposition of the complexes occurs
through four steps. The water of hydration was removed within the 50–99 ◦ C temperature range, while the
coordinated water molecules were removed within the 130–178 ◦ C range. The number of water molecules
was determined from the percentage weight losses at these steps. The removal of coordinated acetate groups
was observed within the 210–286 ◦ C range. The complete decomposition of the organic ligands occurred at
temperatures higher than 306 ◦ C. The final product was the metal oxide. 34
Table 2. Data obtained from TGA curves of UO 2 (II)-complexes I and II.
[(UO2 )2 LI (AcO)3 (H2 O)]·H2 O (I)
[(UO2 )2 LI (AcO)3 (H2 O)]
[(UO2 )2 LI (AcO)3 ]
% Loss in
weight
found (calcd.)
1.65 (1.56)
1.49 (1.56)
15.12 (15.33)
Temperature
range (◦ C)
55–95
130–168
210–280
[(UO2 )2 LI ]
31.84 (32.05)
310–1000
[(UO2 )2 LII (AcO)3 (H2 O)]·H2 O (II)
[(UO2 )2 LII (AcO)3 (H2 O)]
[(UO2 )2 LII (AcO)3 ]
1.81 (1.49)
1.32 (1.49)
14.88 (14.62)
50–99
130–178
220–286
[(UO2 )2 LII ]
34.97 (35.19)
306–1000
Compound
Assignment
(thermal process)
Loss of hydrated H2 O
Removal of coordinated H2 O
Elimination of coordinated acetate groups
Complete decomposition of the complex
and formation of metal oxide as a final
product
Loss of hydrated H2 O
Removal of coordinated H2 O
Elimination of coordinated acetate groups
Complete decomposition of the complex
and formation of metal oxide as a final
product
269
KHEDR and SAAD/Turk J Chem
2.3. TOF-mass spectral studies
Mass spectra are used in order to confirm the constitutions and purities of the prepared ligands and UO 2 (II)complexes. The mass spectra of sulfadiazine azo-azomethine dyes showed accurate molecular ion peaks at m/z
403 and 459 for HL I and HL II , respectively, matched with the theoretical values. Moreover, the spectra of
[(UO 2 )2 L I (AcO) 3 (H 2 O)] ·H 2 O and [(UO 2 )2 L II (AcO) 3 (H 2 O)]· H 2 O displayed accurate molecular ion peaks
at m/z 1155 and 1211, respectively, corresponding to the parent ion [ML] + . Successive degradation of the target
compound and appearance of different peaks due to various fragments are good evidence for the molecular
structure of the investigated complexes. 19 The mass spectrum of complex I showed peaks at m/z 1155, 1137,
1119, 1060, 1001, and 942 corresponding to [(UO 2 )2 L I (AcO) 3 (H 2 O)] ·H 2 O (the molecular weight of complex
cation), [(UO 2 )2 L I (AcO) 3 (H 2 O)] (loss of the hydrated water molecule), [(UO 2 )2 L I (AcO) 3 ] (loss of two water
molecules), [(UO 2 )2 L I (AcO) 2 ] (loss of two water molecules and one acetate group), [(UO 2 )2 L I (AcO)] (loss of
two water molecules and two acetate groups), and [(UO 2 )2 L I ] (loss of two water molecules and three acetate
groups). New good evidence confirms the proposed structure of the complexes comes from the decomposition
of complexes I and II via abstraction of the ligand, which give rise to the presence of a molecular ion peak
attributable to [L] + (Scheme 1). This is common behavior for metal ion complexes containing different ligands
(ML) that decompose through cleavage of the metal–ligand bond during the spray ionization process. 35
[(UO2)2LII(AcO)]
m/z 1057.00 (1057.67)
-2H2O,
-2AcO
-2H2O,
[(UO2)2LII(AcO)2]
m/z 1116.00 (1116.71)
-AcO
demetallization [(UO ) LII(AcO) (H O)].H O - H2O [(UO2)2LII(AcO)3(H2O)]
LII
2 2
3 2
2
m/z 1193.00 (1193.77)
m/z 1211.00 (1211.78)
m/z 459.00 (459.57)
-2H2O,
- 2H2O
3AcO
[(UO2)2LII]
m/z 988.00 (988.62)
[(UO2)2LII(AcO)3]
m/z 1175.00 (1175.75)
Scheme 1. Fragmentation pathways of [(UO 2 )2 L II (AcO) 3 (H 2 O)] · H 2 O (II).
2.4. FT-IR spectral studies
A comparative study between the FT-IR spectra of the free ligands (HL I and HL II ) and those of their UO 2 (II)complexes I and II was conducted in order to investigate the mode of binding in the formed complexes (Table
3). The metal ions usually form bonds with Schiff base derivatives of sulfa-drugs through the Schiff base center
or the sulfonamide part for mononuclear complexes, while for binuclear ones both centers contribute. 36 IR
spectra of HL I and HL II displayed strong bands at 3423 and 3426 cm −1 , which can be attributed to the
stretching vibration of OH, confirming enolization of C=O through keto-enol tautomerism (Scheme 2). 19 IR
spectra of complexes I and II showed broad bands at 3426 cm −1 , which can be assigned to ν (OH) of water
associated with complexes. The presence of water renders it difficult to confirm the deprotonation of the OH
groups on complex formation from the stretching vibration. 37 Stretching vibration bands of aliphatic ν (C=N)
appeared at 1581 cm −1 , whereas aromatic ν (C=N) bands appeared at 1630 and 1612 cm −1 in the spectra of
HL 1 and HL 2 , respectively. These bands have invariable shifts in the spectra of complexes I and II, indicating
the coordination of the aromatic and aliphatic azomethine nitrogens to the metal ion in chelate formation. 38
270
KHEDR and SAAD/Turk J Chem
Sharp bands appeared around 1325 and 1155 cm −1 in the spectra of HL I and HL II , due to νas (SO 2 N)
and νs (SO 2 N), respectively. These bands shifted slightly to higher or lower frequencies upon coordination
to UO 2 (II). 38 νas (OCO) and νs (OCO) of the acetate group in the uranyl complexes I and II are observed
around 1495 and 1442 cm −1 , respectively. This revealed monodentate coordination of this group [ ∆ (OCO)
= νas (OCO) – νs (OCO) < 100 cm −1 )]. 39 The medium intensity bands that appeared around 3356, 3259,
3041, 2938, 1651, 1409, 1261, and 683 cm −1 can be assigned to ν (NH 2 ) , ν (NH), ν (CH-aromatic), ν (CH 2 ),
ν (C=O), ν (N=N), ν (S=O), and ν (C-S), respectively. These observations are supported by the appearance
of two new nonligand bands at 640 cm −1 and around 502 cm −1 due to ν (M–O) and ν (M–N), 40 respectively.
The characteristic νas (UO 2 ) band appeared near 843 cm −1 in the spectra of UO 2 (II)-complexes I and II. 41
The previous studies, 19,20,36,37 and the IR spectral studies revealed that the ligands coordinate to the metal
via a nitrogen atom of the pyrimidine ring, the oxygen atom of sulfonamide group, azomethine-N, and enolic
OH formed through a keto–enol tautomerism of the C=O group (Scheme 2).
Table 3. IR spectral data (cm −1 ) of HL I , HL II , and their UO 2 (II)-complexes I and II.
No
HLI
I
HLII
II
ν(OH)
[ν(NH)]
3423
[3355]
3426
[3358]
3426
[3357]
3426
[3358]
ν(NH2 )
[ν(CHarom )]
3257
[3038]
3258
[3042]
3259
[3039]
3262
[3041]
ν(C=Narom )
[ν(C=Nazom )]
1630
[1581]
1623
[1594]
1612
[1582]
1623
[1594]
C
N
1325,
1156
1326,
1155
1325,
1155
1326,
1155
C
N
ν(M-O)
[ν(M-N)]
—
[—]
640
[503]
—
[—]
640
[502]
(CH2)nNH2
CH3
N
C
νas (UO2 )
[νs (C-S]
—
[683]
843
[682]
—
[684]
843
[683]
ν(SO2 N)
N
CH
CH3
νas (OCO)
[νs (OCO)]
—
[—]
1495
[1442]
—
[—]
1494
[1442]
(CH2)nNH2
CH3
N
ν(N=N)
[ν(S=O)]
1409
[1261]
1410
[1263]
1409
[1262]
1409
[1263]
N
C
C
O
OH
CH3
Scheme 2. Keto-enol tautomerism in sulfadiazine azo-azomethine dyes (HL I and HL II ) .
2.5. Electronic absorption spectra and magnetic susceptibility data
UV-Vis spectral results of sulfadiazine azo-azomethine dyes and their UO 2 (II)-complexes in DMF solution are
presented in Table 4. The spectra of HL I and HL II showed three bands. The first band appeared within the
292–304 nm range and can be attributed to the low energy π − π * transition corresponding to 1 L b ←1 A state
of the phenyl ring. The second band appeared within the 360–390 nm range due to the n − π * transition. The
third band appeared at the 440–462 nm range due to charge transfer transitions within the whole molecule. 42
The spectra of UO 2 (II)-complexes I and II displayed a weak band at 478 nm and a highly intense band
271
KHEDR and SAAD/Turk J Chem
3
near 303 nm, which are attributed to 1 Σ+
g → πu transitions and charge transfer overlapping with π − π *
transition, respectively. 43 The band occurring near 355 nm can be assigned to uranyl moiety because apical
oxygen→ f o (U) transition is being merged with the ligand band due to n→ π * transition as evident from
broadness and intensity. 44 As expected, magnetic susceptibility data prove that UO 2 (II)-complexes I and II
are diamagnetic. 45
Table 4. UV-Vis and
No
HLI
I
HLII
II
2.6.
1
1
1
H NMR spectral data of HL I , HL II , and their UO 2 (II)-complexes I and II.
UV-Vis spectra
(λmax , nm)
292, 390, 440
303, 356,478
304, 360, 462
302, 355, 478
1
H NMR spectra
δOH
δCH−N
11.13 7.03
—
—
11.21 7.28
—
—
δAr−H
7.71–7.62
8.02–7.92
7.92–7.80
7.96–7.86
δN H
9.95
10.45
10.05
10.28
δN H2
9.23
9.70
9.44
9.55
δ of CH3 groups
4.13
4.61
4.58
4.90
H NMR spectral studies
H NMR spectra of HL I and HL II were studied and compared with those of their UO 2 (II)-complexes (I and
II), in order to determine the center of chelation and replaceable hydrogen upon complex formation (Table
4). The
1
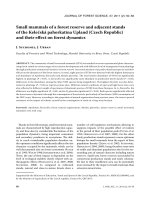
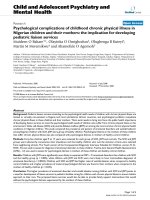
H NMR spectra of HL I and HL II and their UO 2 (II)-complexes (I and II) are shown in Figures
1–4. Signals at 11.13 and 11.21 ppm due to δOH in the spectra of HL I and HL II , respectively, support the
presence of OH produced from keto–enol tautomerism as concluded from IR spectra (Scheme 2). Furthermore,
the aliphatic –CH—N– proton appeared as a singlet at 7.03 and 7.28 ppm in the spectra of free ligands. These
signals disappeared in the
1
H NMR spectra of the complexes, denoting that complex formation occurs via
deprotonation of the OH group. 46 The signals that appeared at 9.95; 10.05, 9.23; 9.44, 8.47; 8.64, 7.71–7.62;
7.92–7.80, 4.13; 4.58 and 3.25; 4.05 ppm due to δN H , δN H2 , δpyrimidine−H , δbenzene−H , δCH3 , and δCH2 in
the free ligand spectra have downfield shifts in the spectra of the complexes due to increased conjugation on
coordination, supporting coordination of ligands to UO 2 (II) ion. The downfield shift of these signals is due
to deshielding by UO 2 (II), giving further support for the presence of the metal ions. 47 The 1 H NMR spectra
of UO 2 (II)-complexes I and II showed two new nonligand signals at 2.23 and 2.02 and 3.12 and 3.00 ppm for
water and CH 3 from acetate, respectively. 20
2.7. In vitro antibacterial and antifungal assay
The antimicrobial activity of any compound is a complex combination of steric, electronic, and pharmacokinetic
factors. The action of the compound may involve the formation of a hydrogen bond through —N=C of
the chelate or the ligand with the active centers of the cell constituents, resulting in interference with the
normal cell process. The microbotoxicity of the compounds may be ascribed to the metal ions being more
susceptible toward the bacterial cells than ligands. 48 The in vitro antimicrobial activities of the prepared
sulfadiazine azo-azomethine dyes (HL I and HL II ) and their UO 2 (II)-complexes (I and II) were screened
against E. coli, S. aureus, A. flavus, and C. albicans using the modified Kirby–Bauer disc diffusion method. 49
Standard drugs amphotericin B and tetracycline were tested for their antibacterial and antifungal activities in
the same conditions and concentrations. UO 2 (II)-complexes showed significant antimicrobial activities against
the tested organisms compared with the free ligands (Table 5). Complexes I and II displayed high activity
272
KHEDR and SAAD/Turk J Chem
Figure 1.
Figure 2.
1
H NMR spectrum of ligand HL I .
1
H NMR spectrum of complex I.
against different types of tested bacteria. Moreover, complexes I and II exhibited moderate activity against A.
flavus. Sulfadiazine azo-azomethine ligands (HL I and HL II ) and complexes are inactive against C. albicans.
Complexes I and II were less active compared with tetracycline and amphotericin B. The data prove the
potential of complexes I and II as broad spectrum antibacterial agents. Furthermore, complexes I and II can
be used as effective antifungal agents against multicellular fungi. The improved activities of the metal complexes
273
KHEDR and SAAD/Turk J Chem
Figure 3.
1
Figure 4.
H NMR spectrum of ligand HL II .
1
H NMR spectrum of complex II.
compared with the free ligand can be explained on the basis of chelation theory. 50 This theory states that a
decrease in the polarizability of the metal could enhance the lipophilicity of the complexes. This leads to a
breakdown of the permeability of the cells, resulting in interference with normal cell processes. 51 This indicates
that chelation tends to make the Schiff bases act as more powerful and potent antimicrobial agents, inhibiting
the growth of bacteria and fungi more than the parent Schiff bases. 52 Therefore, it is claimed that the process of
274
KHEDR and SAAD/Turk J Chem
chelation dominantly affects the biological activity of compounds that are potent against microbial and fungal
strains. S. aureus was selected to represent gram-positive bacteria, whereas E. coli was selected as the backbone
of gram-negative bacteria. C. albicans represented the unicellular fungi, while A. flavus was selected as a higher
fungus representing multicellular fungi. Therefore, the selected organisms represent a broad spectrum of test
organisms. The obtained results prove the usefulness of complexes I and II as broad spectrum antimicrobial
agents.
Table 5. Antibacterial and antifungal activities of HL I , HL II , and their UO 2 (II)-complexes I and II.
Compound
Control: DMSO
Tetracycline
(Antibacterial agent)
Amphotericin B
(Antifungal agent)
HLI
Complex I
HLII
Complex II
Inhibition zone diameter (mm mg−1 sample)
E. coli (G− ) S. aureus (G+ ) A. flavus (fungus)
0.0
0.0
0.0
C. albicans (fungus)
0.0
33.0
30.0
—
—
—
—
20.0
20.0
15.0
18.0
13.0
20.0
16.0
20.0
16.0
21.0
0.0
10.0
0.0
11.0
0.0
0.0
0.0
0.0
3. Experimental
3.1. Materials and measurements
All chemicals used in the synthesis were of reagent grade and used without further purification. All solvents were
of reagent grade and purified according to the standard procedure. The thermal gravimetric analysis (TGA) of
UO 2 (II)-complexes was performed using a Shimadzu TG-50 thermal analyzer from ambient temperature up to
800 ◦ C under nitrogen as atmosphere with a heating rate of 10 ◦ C/min. Molar conductance of the complexes
was determined in DMSO (10 −3 M) at room temperature using a Jenway (model 4070) conductivity meter.
Matrix Assisted Laser Desorption/Ionization Time-of-Flight (MALDI-TOF) mass spectra were obtained by the
aid of a BRUKER Auto flex II LRF20 spectrometer using dithranol as a matrix. Infrared spectra of the ligand
and its metal complexes were recorded on a FT-IR Bruker Tensor 27 spectrophotometer, within 4000–400 cm −1
range as KBr discs (at Central Laboratory, Tanta University, Egypt). The electronic spectra were recorded on a
Shimadzu 240 UV-Visible spectrophotometer. Magnetic susceptibility measurements of the metal complexes in
powder form were carried out on a Guoy balance using mercuric tetrathiocyanato-cobaltate(II) as the magnetic
susceptibility standard.
1
H NMR spectra were measured using a Bruker DMX 750 (500 MHz) spectrometer
in DMSO-d 6 as the solvent and tetramethylsilane as the internal standard. Chemical shifts of 1 H NMR were
expressed in parts per million (ppm, δ units), and the coupling constant was expressed in hertz (Hz).
3.2. Preparation of sulfadiazine azo-azomethine dyes
Sulfadiazine azo-azomethine dyes (HL I and HL II ) were prepared according to the following procedures. 4-(3Pentyl-2,4-dione)-N-pyrimidin-2-yl-benzenesulfonamide was synthesized according to a modified procedure. 53
To a solution of acetylacetone (1.00 g, 10 mmol) in 30 mL of ethanol was added sodium acetate (3.0 g). The
mixture was cooled to 0 ◦ C for 10 min and a cooled solution of sulfadiazine dizonium chloride (prepared from
10 mmol of sulfadiazine (2.50 g) and the appropriate quantities of HCl and NaNO 2 ) was added under stirring.
275
KHEDR and SAAD/Turk J Chem
The stirring was continued for 1 h after which the solid was collected, washed with 2 × 10 mL of water and 2
× 10 mL of ethanol, and dried in air. The obtained sulfadiazine azo dye was recrystallized several times from
ethanol.
HL I and HL II were prepared using a procedure taken from the literature 53 and modified. A mixture
of 10 mmol of 4-(3-pentyl-2,4-dione)-N-pyrimidin-2-yl-benzenesulfonamide (3.61 g) and ethylenediamine (0.60
g) or 1,6-hexanediamine (1.16 g) was dissolved in absolute ethanol (50 mL) with a few drops of piperidine as a
catalyst. The mixture was refluxed at 80 ◦ C for 10–12 h. The resulting solid product was collected by filtration
and washed several times with hot ethanol. The different synthetic procedures for preparation of HL I and
HL II are presented in Scheme 3.
N
N
O
O
N
N
NH2
S
N
H
NaNO2
HCl, H2O
N
S
H
O
N2+Cl
CH3
O
C
EtOH,
CH3COONa
O
CH2
C
O
CH3
CH3
N
O
N
C
N
N
S
H
O
CH
N
C
+
two drops of
piperidine
N
EtOH,
reflux
S
H
O
(CH2)nNH2
CH3
O
N
O
CH3
H2N(CH2)nNH2
N
O
C
N
N
N
CH
C
O
CH3
Scheme 3. Procedures for preparation of sulfadiazine azo-azomethines dyes [HL I (n = 2) and HL II (n = 6)].
3.3. Synthesis of the metal complexes
UO 2 (II)-complexes I and II were synthesized using the well-known reflux-precipitation method. Uranyl acetate
dihydrate solution (2 mmol in 50 mL of water/ethanol mixture (50%, V/V)) was added dropwise to an ethanolic
276
KHEDR and SAAD/Turk J Chem
solution of sulfadiazine azo dye HL I or HL II (1 mmol in 50 mL of ethanol). Then the resulting mixture was
refluxed for 14–16 h on a water bath. The complexes precipitated during the reaction were filtered off and washed
several times with hot ethanol, and then dried in a vacuum over anhydrous calcium chloride. The reaction yield
was found to be 80%–84%. The purities of the complexes were checked by TLC and melting point constancy.
The various synthetic reactions for the preparation of UO 2 (II)-complexes I and II are summarized in Scheme
4.
(CH2)nNH2
CH3
N
N
O
N
S
H
O
N
C
N
CH
N
C
O
CH3
2 UO2(CH3COO)2.2H2O EtOH, reflux, 14-16 h.
AcO
O
OAc
N
(CH2)nNH2
CH3
U
O
C
OAc
N
O
N
N
S
H
O
N
N
C
U
O
C
O
.H2O
O
H2O
CH3
Scheme 4. Procedures for synthesis of UO 2 (II)-complexes I and II (n = 2 complex I and n = 6 for complex II).
3.4. In vitro antibacterial and antifungal assay by the Kirby–Bauer method
Antimicrobial activities of the investigated sulfadiazine azo-azomethines dyes and UO 2 (II)-complexes were
determined using a modified Kirby–Bauer disc diffusion method, 54 at the micro-analytical unit of Cairo
University. First 100 µ L of the test bacteria/fungi were grown in 10 mL of fresh media until they reached
106 cells mL −1 for bacteria and 105 cells mL −1 for fungi. 49 Then 100 µ L of microbial suspension was spread
onto agar plates corresponding to the broth in which they were maintained. Isolated colonies of each organism
that might play a pathogenic role were selected from primary agar plates and tested for susceptibility by the
disc diffusion method. 55 From the many media available, the NCCLS recommends Mueller–Hinton agar since it
results in good batch-to-batch reproducibility. The disc diffusion method for filamentous fungi used the approved
standard method (M38-A) developed by the NCCLS 56 for evaluating the susceptibilities of filamentous fungi to
antifungal agents. The disc diffusion method for yeasts used the approved standard method (M44-P) developed
by the NCCLS. 57 Plates inoculated with the filamentous fungus A. flavus NRRL 6554 were incubated at 25
◦
C for 48 h, plates inoculated with gram-positive bacteria as S. aureus NCTC 6356 and gram-negative bacteria
as E. coli NRRL-B-3704 were incubated at 35–37 ◦ C for 24–48 h, and plates inoculated with the yeast C.
277
KHEDR and SAAD/Turk J Chem
albicans ATCC 10231 was incubated at 30
were measured in millimeters.
58
◦
C for 24–48 h, and then the diameters of the inhibition zones
Standard discs of tetracycline (an antibacterial agent) and amphotericin B
(antifungal agent) served as positive controls for antimicrobial activity, while filter discs impregnated with 10
µ L of solvent (distilled water or DMSO) were used as negative controls. The agar used was Mueller–Hinton agar
rigorously tested for composition and pH. The depth of the agar in the plate is a factor to be considered in the
disc diffusion method. This method is well-documented and standard zones of inhibition have been determined
for susceptible and resistant values. Blank paper discs (Schleicher & Schuell, Spain) with a diameter of 8.0
mm were impregnated with 10 µ L of testing concentration of the stock solutions. When a filter paper disc
impregnated with a tested chemical is placed on agar the chemical diffuses from the disc into the agar, placing
the chemical in the agar only around the disc. The solubility of the chemical and its molecular size will determine
the size of the area of chemical infiltration around the disc. If an organism is placed on the agar, it will not grow
in the area around the disc if it is susceptible to the chemical. This area of no-growth around the disc is known
as a ‘zone of inhibition’ or ‘clear zone’. For disc diffusion, the zone diameters were measured with slipping
calipers of the National Committee for Clinical Laboratory Standards. 58 Agar-based methods such as E-test
and disc diffusion can be good alternatives because they are simpler and faster than broth-based methods. 59
4. Conclusion
Sulfadiazine azo-azomethine dyes (HL I and HL II ) and their UO 2 (II)-complexes were synthesized and characterized. Satisfactory analytical data, molar conductance measurements, magnetic susceptibility, and TOF-mass,
IR, UV-Vis, and 1 H NMR spectral studies confirm octahedral geometry in UO 2 (II)-complexes. HL I and HL II
coordinate to the metal ions via a nitrogen atom of the pyrimidine ring, the oxygen atom of sulfonamide group,
azomethine-N, enolic-OH formed through a keto–enol tautomerism of C=O groups in two chelation centers
forming bi-homonuclear UO 2 (II)-complexes. Molar conductivity values revealed that the complexes are nonelectrolytes. The thermal data confirmed the suggested formula, based on spectral results. The investigated
compounds were active against bacteria (E. coli and S. aureus) and fungi (A. flavus). The obtained data
prove the usefulness of UO 2 (II)-complexes as broad spectrum antimicrobial agents. Such metal complexes find
wide interest, especially due to their potential as biocides and nematicides with unique electrical and magnetic
properties. 60
Acknowledgment
The authors would like to thank the Institute of Scientific Research and Revival of Islamic Heritage at Umm
Al-Qura University, Project ID 43305004, for the financial support.
References
1. WHO Model List of Essential Medicines”. World Health Organization. October 2013. Retrieved 22 April 2014.
2. Peters, A. T.; Freeman H. S. Colour Chemistry, the Design and Synthesis of Organic Dyes and Pigments. London,
UK: Elsevier, 1991.
3. Kocaokutgen, H.; Gur, M.; Soylu M. S.; Lonnecke, P. Dyes Pigments 2005, 67, 99–103.
4. Gregory, P. High-Technology Applications of Organic Colorants. New York, NY, USA: Plenum Press, 1991.
5. Catino, S. C.; Farris, R. E. in: Concise Encyclopedia of Chemical Technology. New York, NY, USA: Wiley, 1985.
278
KHEDR and SAAD/Turk J Chem
6. Ollgaard, H.; Frost, L.; Galster, J.; Hansen, O. C. Survey of Azo-Colorants in Denmark: Consumption, Use,
Health and Environmental Aspects. Ministry of Environment and Energy, Denmark and the Danish Environmental
Protection Agency, No. XX, 1998.
7. Dhar, D. N.; Taploo, C. L. J. Sci. Ind. Res. 1982, 4, 501–506.
8. Przybylski, P.; Huczy´
nski, A.; Pyta, K.; Brzezinski, B.; Bartl, F. Curr. Org. Chem. 2009, 4, 124–148.
9. El-Medani S. M.; Ali, O. A. M.; Ramadan, R.M. J. Mol. Struct. 2005, 738, 171–177.
10. Tofazzal, M.; Tarafder, H.; Ali, M. A.; Saravana, N.; Weng, W. Y.; Kumar, S.; Tsafe, N. U.; Crouse, K. A. Transit.
Met. Chem. 2000, 25, 295–298.
11. Colman, J.; Hegedu L. S. Principles and Applications of Organotransition Metal Chemistry. Herndon, VA, USA:
University Science Book, 1980.
12. Malina, J.; Farrell, N. P.; Brabec, V. Inorg. Chem. 2014, 53, 1662–1670.
13. Nkoana, W.; Nyoni, D.; Chellan, P.; Stringer, T.; Taylor, D.; Smith, P. J.; Hutton, A. T.; Smith, G. S. J. Organomet.
Chem. 2014, 752, 67–75.
14. Chellan, P.; Land, K. M.; Shokar, A.; A. Au, S.H. An, D. Taylor, D.; Smith, P. J.; Riedel, T.; Dyson, P. J.; Chibale,
K.; Smith, G. S. Dalton Trans. 2014, 43, 513–526.
15. Khedr, A. M.; Marwani, H. M. Int. J. Electrochem. Sci. 2012, 7, 10074–10093.
16. Sato, H.: Morimoto, K.; Mori, Y.; Shinagawa, Y.; Kitazawa, T.; Yamagishi, A. Dalton Trans. 2013, 42, 7579–7585.
17. Klingele, J.; Dechert, S.; Meyer, F. Coord. Chem. Rev. 2009, 253, 2698–2741.
18. Saha, M.; Nasani, R.; Das, M.; Mahata, A.; Pathak, B.; Mobin, S. M.; Carrella, L. M.; Rentschler, E.; Mukhopadhyay, S. Dalton Trans. 2014, 43, 8083–8093.
19. Khedr, A. M.; Draz, D. F. J. Coord. Chem. 2010, 63, 1418–1429.
20. Issa, R. M.; Azim, S. A.; Khedr, A. M.; Draz. D. F. J. Coord. Chem. 2009, 62, 1859–1870.
21. Issa, R. M., Khedr, A. M.; Tawfik, A. Synth. React. Inorg. Met.-Org. Chem. 2004, 34, 1087–1104.
22. Ismail, T. M.; Khedr, A. M.; Abu-El-Wafa, S. M.; Issa, R. M. J. Coord. Chem. 2004, 57, 1179–1190.
23. Saad, F. A. Spectrochim. Acta A 2014, 128, 386–392.
24. Al-Ashqer, S.; Abou-Melha, K. S.; Al-Hazmi G. A. A.; Saad, F. A.; El-Metwaly, N. M. Spectrochim. Acta A 2014,
132, 751–761 .
25. Knight, J. C.; Wuest, M.; Saad, F. A.; Wang, M.; Chapman, D. W.; Jans, H. S.; Lapi, S. E.; Kariuki, B. M.;
Amoroso, A. J.; Wuest, F. Dalton Trans. 2013, 42, 12005–12014.
26. Saad, F. A.; Knight, J. C.; Kariuki, B. M.; Amoroso, A. J. Dalton Trans. 2013, 42, 14826–14835.
27. Saad, F. A.; Buurma, N. J.; Amoroso, A. J.; Knight, J. C.; Kariuki, B. M. Dalton Trans. 2012, 41, 4608–4617.
28. Knight, J. C.; Saad, F. A.; Amoroso, A. J.; Kariuki, B. M.; Coles, S. J. Acta Cryst. 2009, E65, o647.
29. Maurya, R. C.; Rajput, S. J. Mol. Struct. 2006, 94, 24–34.
30. Tas, E.; Aslanoglu, M.; Kilic, A.; Kaplan, O.; Temel, H. J. Chem. Res-(s). 2006, 4, 242–245.
31. Vogel, A. I. A. Hand Book of Quantitative Inorganic Analysis. 2nd Edn., London, UK: Longman, 1966.
32. Mishra, A. P.; Mishra, R. K.; Shrivastava, S. P. J. Serb. Chem. Soc. 2009, 74, 523–535.
33. Badea, M.; Emandi, A.; Marinescu, D.; Cristurean, A.; Olar, R.; Braileanu, A.; Budrugeac, P.; Segal, E. J. Therm.
Anal. Calorim. 2003, 72, 525–531.
34. Khedr, A. M.; Gaber, M.; Diab H. A. J. Coord. Chem. 2012, 65, 1672–1672.
35. Singh, B. K.; Mishra, P.; Garg, B. S. Transit. Met. Chem. 2007, 32, 603–614.
36. El-Baradie, K. Y.; Gaber, M. Chem. Pap. 2003, 57, 317–321.
37. Mohamed, G. G.; Gad-Elkareem, M. A. M. Spectrochim. Acta A 2007, 68, 1382–1387.
279
KHEDR and SAAD/Turk J Chem
38. Agarwal, R. K.; Agarwal, H. Synth. React. Inorg. Met.-Org. Chem. 1996, 26, 1163–1177.
39. Nakamoto, K. Infrared and Raman Spectra of Inorganic and Coordination Compounds. New York, NY, USA: Wiley,
1986.
40. Sharaby, C. M.; Mohamed, G. G.; Omar, M. M.; Spectrochim. Acta A 2007, 66, 935–948.
41. Mostafa, S. I. Transit. Met. Chem. 1998, 23, 397–401.
42. Cukuravali, A.; Yilmaz, I.; Kirbag, S.; Transit. Met. Chem. 2006, 31, 207–213.
43. Chandra, R. Synth. React. Inorg. Met.-Org. Chem. 1990, 20, 645–659.
44. Dash, D. C.; Mahapatra, A.; Naik, P.; Mohapatra, P. K.; Naik, S. K. J. Korean Chem. Soc. 2011, 55, 412–417.
45. El-Tabl, A. S.; El-Saied, F. A.; Al-Hakimi, A. N. Transit. Met. Chem. 2007, 32, 689–701.
46. Abdallah, S. M.; Zayed, M. A.; Mohamed, G. G. Arabian J. Chem. 2010, 3, 103–113.
47. Hart, F. A.; Newbery, J. E.; Shaw, D. Chem. Commun. (London), 1967, 1, 45–46.
48. Phaniband, M. A.; Dhumwad, S. D. Transit. Met. Chem. 2007, 32, 1117–1125.
49. Pfaller, M. A.; Burmeister, L.; Bartlett, M. S. J. Clin. Microbiol. 1988, 26, 1437–1441.
50. Thimmaiah, K. N.; Lloyd, W. D.; Chandrappa, G. T. Inorg. Chim. Acta 1985, 106, 81–83.
51. Collins, C. H.; Lyne, P. M. Microbiological Methods, London, UK: Butterworth, 1976.
52. Kulkarni, A.; Avaji, P. G.; Bagihalli, G. B.; Patil, S. A.; Badami, P. S. J. Coord. Chem. 2009, 62, 481–492.
53. Mijin, D.; Uscumlic, G.; Perisic-Janjic, N.; Trkulja, I.; Radetic, M.; Jovancic, P. J. Serb. Chem. Soc. 2006, 71,
435–444.
54. Bauer, A. W.; Kirby, W. M.; Sherris, C.; Turck, M. Am. J. Clin. Path. 1966, 45, 493–496.
55. National Committee for Clinical Laboratory Standards. Performance antimicrobial susceptibility of Flavobacteria,
41, 1997.
56. National Committee for Clinical Laboratory Standards. Reference method for broth dilution antifungal susceptibility testing of conidium-forming filamentous fungi: Proposed Standard M38-A. NCCLS, Wayne, PA, USA,
2002.
57. National Committee for Clinical Laboratory Standards. Method for antifungal disk diffusion susceptibility testing
of yeast: Proposed Guideline M44-P. NCCLS, Wayne, PA, USA, 2003.
58. National Committee for Clinical Laboratory Standards. Methods for dilution antimicrobial susceptibility tests for
bacteria that grow aerobically. Approved standard M7-A3. National Committee for Clinical Laboratory Standards,
Villanova, PA, USA, 1993.
59. Liebowitz, L. D.; Ashbee, H. R.; Evans E. G.; Chong, Y.; Mallatova, N.; Zaidi, M.; Gibbs, D. Diagn. Microbiol.
Infect. Dis. 2001, 40, 27–33.
60. Jain, M.; Gaur, S.; Singh, V. P.; Singh, R. V Appl. Organomet. Chem. 2004, 18, 73–82.
280