Characterization of a Cu2+ -selective fluorescent probe derived from rhodamine B with 1,2,4-triazole as subunit and its application in cell imaging
Bạn đang xem bản rút gọn của tài liệu. Xem và tải ngay bản đầy đủ của tài liệu tại đây (2.62 MB, 7 trang )
Turk J Chem
(2015) 39: 660 666
ă ITAK
c TUB
Turkish Journal of Chemistry
/>
doi:10.3906/kim-1410-58
Research Article
Characterization of a Cu 2+ -selective fluorescent probe derived from rhodamine B
with 1,2,4-triazole as subunit and its application in cell imaging
Na LI, Chunwei YU, Yuxiang JI, Jun ZHANG∗
Department of Environmental Sciences, School of Tropical and Laboratory Medicine, Hainan Medical College,
Haikou, P.R. China
Received: 25.10.2014
•
Accepted/Published Online: 09.03.2015
•
Printed: 30.06.2015
Abstract: A rhodamine B derivative containing 1,2,4-triazole as subunit was characterized as an “off–on” type Cu 2+ selective fluorescent probe. It exhibited high selectivity and sensitivity for Cu 2+ in ethanol–water solution (9:1, v:v, pH
7.0, 20 mM HEPES) and underwent ring opening. A prominent fluorescence enhancement at 570 nm was observed in
the presence of Cu 2+ with the change in the absorption spectrum, and a 1:1 metal–ligand complex was formed. With
the optimized experimental conditions, the probe exhibited a dynamic response range for Cu 2+ from 8.0 × 10 −7 to 7.5
× 10 −6 M with a detection limit of 2.3 × 10 −7 M in ethanol–water solution (9:1, v:v, pH 7.0, 20 mM HEPES). Its
application in Cu 2+ imaging in living cells was also studied.
Key words: Fluorescent probe, rhodamine B, triazole, Cu 2+
1. Introduction
The detection of heavy transition-metal ions has attracted a lot of interest recently. 1−3 Among them, copper is
an essential trace element in both plants and animals, including humans. Deficiency and excess of copper could
cause serious imbalance of human body functions, which damage the human brain and multiple systems. 4−7
Therefore, the development of methods for easy detection of Cu 2+ is of great importance for the environment
and human health. Compared with the conventional methods for detecting Cu 2+ , such as atomic absorption
spectrometry (AAS), inductively coupled plasma-atomic emission spectrometry (ICP-AES), and inductively
coupled plasma-mass spectroscopy (ICP-MS), fluorescence spectroscopy displayed high selectivity and sensitivity, was easy to operate, and had low detection limits. In addition, the equipment of detection was simple
without complex multistage sample preparation. 8−12
The property of the probes was determined by the fluorophore and recognition site. It is well known that
rhodamine B was always chosen as fluorophore because of its unique structural characteristics and photophysical
properties, that is, it appeared colorless and nonfluorescent in spirolactam form, but displayed remarkable color
change and fluorescence in the ring-opened amide. 13−17 The selectivity and sensitivity of a probe was mainly
decided by the recognition sites. 1,2,4-Triazole has lone electron pairs on N, which provide good coordination
property to metal ions, and several 1,2,4-triazole containing host compounds have been synthesized for the
detection of Cu 2+ . 13 According to the soft–hard acid–base theory, S shows good affinity to Cu 2+ , and so a
–SH group was introduced in the system to improve the coordination ability of probe P. Furthermore, the
∗ Correspondence:
660
jun
LI et al./Turk J Chem
semirigid property of 1,2,4-triazole containing complex could effectively chelate Cu 2+ according to the ionic
radius and also limit the geometric structure of the complex. In the present work, a Cu 2+ -selective fluorescent
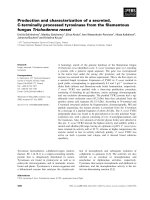
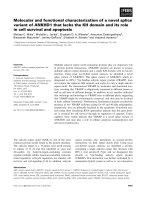
probe derived from rhodamine B containing 1,2,4-triazole as subunit was proposed (Figure 1). Its application
for imaging Cu 2+ in living cells was also described.
SH
O
N
H3C
N
O
N
N
NH2
1
N
N
N
ethanol
reflux
SH +
O
Et 2N
O
N
N
N
CH3
NEt 2
N
Et 2N
2
O
NEt 2
P
Figure 1. Synthesis route of probe P.
2. Results and discussion
2.1. Effect of pH on P and P with Cu 2+
The pH dependence of the fluorescence intensity of P and the P–Cu 2+ system is shown in Figure 2. The results
revealed that the fluorescence of the free P could be negligible; however, a significant fluorescence enhancement
was observed upon the addition of Cu 2+ , which was attributed to the opening of the spirolactam ring of the
rhodamine unit. These data demonstrated that P could work within a wide pH range of 5.8–8.4, which made
it possible for the detection of Cu 2+ under physiological pH conditions. To exclude the influence of acidity on
the test, pH 7.0 was fixed in the further research.
180
Intensity (a.u.)
150
120
90
60
30
0
4
5
6
7
8
9
10
pH
Figure 2. pH-dependent fluorescence of P (10 µ M) (•, in red) and P (10 µ M) plus 100 µ M Cu 2+ ( ■ ) in HEPES
buffers as a function of different pH values.
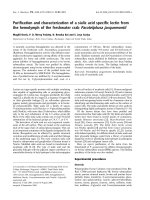
2.2. Uv-vis spectral response of P
In the UV-vis spectrum of P, the absorption with various metal ions was recorded in ethanol–water solution
(9:1, v:v, pH 7.0, 20 mM HEPES) (Figure 3). The results showed that a peak at 556 nm appeared with the
addition of Cu 2+ , and the colorless solution of P was changed to an intense pink due to the spirolactam ring
661
LI et al./Turk J Chem
opening of the rhodamine unit. Hg 2+ and Ni 2+ had negligible interference, while other metal ions, such as
Na + , K + , Ag + , Ca 2+ , Mg 2+ , Zn 2+ , Pb 2+ , Cd 2+ , Co 2+ , Mn 2+ , and Cr 3+ did not show any influence on
the absorbance of P under identical conditions.
2.3. Fluorescence spectral response of P
The fluorescence property of P was measured to investigate the probe’s selectivity in ethanol–water solution
(9:1, v:v, pH 7.0, 20 mM HEPES) with addition of different metal ions (Figure 4). Compared with other tested
metal ions, only Cu 2+ caused a significant “turn-on” fluorescence response at 575 nm, and Hg 2+ had negligible
interference. It indicated that P could selectively recognize Cu 2+ in ethanol–water solution (9:1, v:v, pH 7.0,
20 mM HEPES) and the interference of other tested metal ions in the detection of Cu 2+ could be negligible.
In the emission spectra (Figure 5), the fluorescence peak at 575 nm increased upon the addition of
Cu
2+
; the linear portion of the plot of fluorescence intensity vs. Cu 2+ could be used to detect the unknown
concentration of Cu 2+ over the range of 8.0 × 10 −7 to 7.5 × 10 −6 M with a detection limit of 2.3 × 10 −7 M.
150
Cu 2+
0.6
Cu
2+
Intensity (a.u.)
0.5
Abs
0.4
0.3
50
0.2
BL and other cations
0.1
0.0
450
100
Ni2+
Hg 2+
Hg
2+
BL and other cations
0
480
510
540
570
600
Wavelength (nm)
550
600
650
700
Wavelength (nm)
Figure 3. UV-vis spectra of P (10 µ M) with different
Figure 4. Fluorescence spectra of P (10 µ M) with dif-
metal ions (100 µ M) in ethanol–water solution (9:1, v:v,
ferent metal ions (100 µ M) in ethanol–water solution (9:1,
pH 7.0, 20 mM HEPES).
v:v, pH 7.0, 20 mM HEPES).
One challenge for the probe is to obtain a specific detection system for Cu 2+ over a wide range of
potentially competing ions, since the system might show cross-sensitivity toward other metal ions. Therefore,
the competition experiments were conducted in the presence of 1 equiv. of Cu 2+ mixed with 5 equiv. of other
metal ions as mentioned above. No significant variation in fluorescence intensity was found by comparison with
the same amounts of Cu 2+ solution without other metal ions, and the relative error was less than ±5% (Figure
6). For probe P, cross-sensitivity to the other metal ions was not observed, while an excellent selectivity toward
Cu 2+ was exhibited. Thus, it indicated that the probe P was a Cu 2+ -specific fluorescent probe.
2.4. The proposed reaction mechanism
The Job’s plot was drawn to prove the complex ratio of P with Cu 2+ (Figure 7). Total concentration of P
and Cu 2+ was kept at a fixed 50 µ M. The results showed that the maximum fluorescent emission intensity of
P–Cu 2+ complex appeared at 0.5, which indicated that a P–Cu 2+ complex was formed in 1:1 mole ratio.
662
LI et al./Turk J Chem
100
40
75
30
20
Intensity (a.u.)
Intensity (a.u.)
Intensity (a.u.)
90
50
150
10
0
0
1
2
3
4
5
6
7
8
[Cu 2+ ]/10 -6 M
50
60
45
30
15
2+
Cu
+
Ag
2+
Hg
2+
Ni
2+
Cd
Cr
3+
2+
Co
2+
Pb
Zn
2+
Mg
K
Ca
+
0
700
2+
650
Wavelength (nm)
Na
600
+
550
2+
0
Fluorescence response of P (10 µ M) with
Figure 6. Fluorescence response of P (10 µ M) to Cu 2+
various concentrations of Cu 2+ in ethanol–water solution
(9:1, v:v, pH 7.0, 20 mM HEPES).
ions (10 µ M) or to a mixture of the specified metal ions (50
Figure 5.
µ M) with Cu 2+ ions (10 µ M) in ethanol–water solution
(9:1, v:v, pH 7.0, 20 mM HEPES).
To further understand the reaction mechanism of probe P to Cu 2+ , EDTA titration experiments were
conducted to examine the reversibility of the probe P with Cu 2+ (Figure 8). Upon the addition of 50 µM
EDTA to the mixture of P (10 µ M) and Cu 2+ (10 µ M) in ethanol–water solution (9:1, v:v, pH 7.0, 20 mM
HEPES), the fluorescent emission intensity of P–Cu 2+ was significantly reduced and the color changed from
pink to almost colorless. When Cu 2+ was added to the system again, the signals were almost completely
reproduced, and the colorless solution turned pink. The results demonstrated that the binding of P and Cu 2+
90
b
150
60
Intnesity (a.u.)
Intensity (a.u.)
d
30
100
50
c
0
0.0
0.2
0.4
0.6
0.8
0
1.0
550
2+
[P]/ [P+Cu ]
Figure 7. Job’s plot of P with Cu 2+ according to the
method of continuous variation. The total concentration
of P and Cu 2+ was 50 µ M.
a
600
650
700
Wavelength (nm)
Figure 8. Reversible titration response of P to Cu 2+ in
ethanolwater solution (9:1, v:v, pH 7.0, 20 mM HEPES):
(a) P (10 µ M); (b) P (10 µ M) + Cu 2+ (10 µ M); (c) P
(10 µ M) + Cu 2+ (10 µ M) + EDTA (50 µ M); (d) P (10
µ M) + Cu 2+ (10 µ M) + EDTA (50 µ M) + Cu 2+ (0.1
mM).
663
LI et al./Turk J Chem
was a reversible process. According to the experimental results, the reaction mechanism was proposed as shown
in Figure 9.
N
H
S
SH
N
N
O
N
Cu2+
N
N
CH3
N
N
N
N
N
CH3
Et2N
O
NEt2
H
O
N
Et2N
P
O
NEt2
P + Cu2+
Figure 9. Proposed binding mode of P and Cu 2+ .
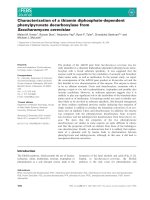
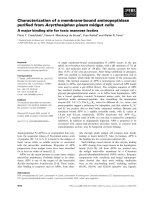
Figure 10. Confocal fluorescence and brightfield images of HepG2 cells. a) Cells stained with 10 µ M P for 30 min at
37
◦
C; b) cells supplemented with 1 µ M CuCl 2 in the growth media for 30 min at 37
µ M P for 30 min at 37
◦
◦
C and then incubated with 10
C; c) bright field image of cells shown in a); d) bright field image of cells shown in b).
2.5. Preliminary analytical application
To further demonstrate the practical applicability of the probe P, confocal microscopy experiments were further
carried out, and the fluorescence images of HepG2 cells were recorded before and after the addition of Cu 2+
(Figure 10). The cells incubated with P for 30 min at 37 ◦ C showed very weak fluorescence, as shown in Figure
10a. When cells stained with P were incubated with CuCl 2 (1 µ M), the color of the HepG2 cells showed
significant changes (Figure 10b). The bright field images of Figure 10a and Figure 10b were shown as Figure
10c and Figure 10d, and the shapes of cells indicated that P has low toxicity. These results suggested that
probe P can penetrate the cell membrane and might be used for detecting Cu 2+ in living cells.
664
LI et al./Turk J Chem
In conclusion, a novel Cu 2+ -selective rhodamine B fluorescent probe containing 1,2,4-triazole as subunit
was constructed. Cu 2+ could induce spirolactam ring opening of the rhodamine unit and achieved an “off–on”
effect. The probe P can detect as low as 2.3 × 10 −7 M Cu 2+ . In addition, the probe P was successfully used
to detect Cu 2+ in living cells.
3. Experimental
3.1. Reagents and instruments
All reagents and solvents are of analytical grade and used without further purification. The metal ions and anions
salts employed were NaCl, KCl, CaCl 2 · 2H 2 O, MgCl 2 ·6H 2 O, Zn(NO 3 )2 ·6H 2 O, PbCl 2 , CdCl 2 , CrCl 3 · 6H 2 O,
CoCl 2 · 6H 2 O, NiCl 2 ·6H 2 O, HgCl 2 , CuCl 2 ·2H 2 O, FeCl 3 · 6H 2 O, and AgNO 3 .
Fluorescence emission spectra were conducted on a Hitachi 4600 spectrofluorometer. UV-Vis spectra were
obtained on a Hitachi U-2910 spectrophotometer. Nuclear magnetic resonance (NMR) spectra were measured
with a Bruker AV 400 instrument and chemical shifts are given in ppm from tetramethylsilane (TMS). Mass
spectra (MS) were recorded on a Thermo TSQ Quantum Access Agilent 1100.
3.2. Synthesis of compound P
Compounds 1 and 2 were synthesized as reported. 18,19
Compounds 1 (0.13 g, 1.0 mM) and 2 (0.496 g, 1.0 mM) were mixed in ethanol (40 mL). The reaction
mixture was stirred at 80 ◦ C for 4 h. After the reaction was finished, the solution was removed under reduced
pressure. The precipitate so obtained was filtered and purified with silica gel column chromatography (petroleum
ether/acetic ether = 5:1, v:v) to afford P as yellow solid. Yields: 83.4%. MS (ES+) m/z: 609.27 [M + H] + .
1
H NMR ( δ ppm, d6 -DMSO): 1 H NMR: 13.74 (s, 1H), 9.82 (d, 1H, J = 8.2), 8.34 (d, 1H, J = 8.2), 7.96 (d,
1H, J = 7.4), 7.65 (t, 1H, J = 7.4), 7.58 (t, 1H, J = 7.4), 6.45 (t, 4H, J = 8.3), 6.63 (t, 2H, J = 10.8), 7.08
(d, 1H, J = 7.6), 3.32 (m, 8H, J = 8.4), 2.21 (s, 3H), 1.08 (t, 12H, J = 7.8). 13 C NMR ( δ ppm, d6 -DMSO):
165.57, 161.88, 159.59, 153.19, 152.85, 149.62, 149.52, 143.24, 135.85, 132.41, 129.93, 129.55, 128.50, 127.88,
124.83, 124.42, 109.23, 105.17, 98.32, 66.49, 65.92, 44.57, 30.91, 19.55, 14.44, 13.29, 11.52, 11.29.
3.3. General spectroscopic methods
Metal ions and chemosensor P were dissolved in deionized water and DMSO to obtain 1.0 mM stock solutions,
respectively. Before spectroscopic measurements, the solution was freshly prepared by diluting the high concentration stock solution with the corresponding solution. For all measurements, excitation/emission slit widths
were 5/10 nm and excitation wavelength was 550 nm.
Acknowledgments
This work was financially supported by the National Natural Science Foundation of China (No. 81260268,
81360266), the Natural Science Foundation of Hainan Province (No. 812188, 413131), and the Colleges and
Universities Scientific Research Projects of the Education Department of Hainan Province (Hjkj2013-29).
References
1. Nolan, E. M.; Lippard, S. J. Chem. Rev. 2008, 108, 3443–3480.
2. Jeong, Y.; Yoon, J. Inorg. Chim. Acta 2012, 381, 2–14.
665
LI et al./Turk J Chem
3. Xu, Z. C.; Yoon, J.; Spring, D. R. Chem. Soc. Rev. 2010, 39, 1996–2006.
4. Radisky, D.; Kaplan, J. J. Biol. Chem. 1999, 274, 4481–4484.
5. Rode, B. M.; Suwannachot, Y. Coordin. Chem. Rev. 1999, 190–192, 1085–1099.
6. Tapiero, H.; Townsend, D. M.; Tew, K. D. Biomed. Pharmacother. 2003, 57, 386–398.
7. Kwon, H.; Lee, K.; Kim, H. J. Chem. Comm. 2011, 47, 1773–1775.
8. Peng, X. J.; Du, J. J.; Fan, J. L.; Wang, J. Y.; Wu, Y. K.; Zhao, J. Z.; Sun, S. G.; Xu, T. J. Am. Chem. Soc.
2007, 129, 1500–1501.
9. Huang, J. H.; Xu, Y. F.; Qian, X. H. Dalton Trans. 2009, 10, 1761–1766.
10. Lee, M. H.; Kim, H. J.; Yoon, S. W.; Park, N. J.; Kim, J. S. Org. Lett. 2008, 10, 213–216.
11. Wu, D. Y.; Huang, W.; Duan, C. Y.; Lin, Z. H.; Meng, Q. J. Inorg. Chem. 2007, 46, 1538–1540.
12. Yang, X. F.; Guo, X. Q.; Zhao, Y. B. Talanta 2002, 57, 883–890.
13. Zhang, J.; Yu, C. W.; Qian, S. Y.; Lu, G.; Chen, J. L. Dyes Pigm. 2012, 92, 1370–1375.
14. Du, J. J.; Fan, J. L.; Peng, X. J.; Sun, P. P. Org. Lett. 2010, 12, 476–479.
15. Weerasinghe, A. J.; Abebe, F. A.; Sinn, E. Tetrahedron Lett. 2011, 52, 5648–5651.
16. Kim, H.; Lee, M.; Kim, H.; Kim, J.; Yoon, J. Chem. Soc. Rev. 2008, 37, 1465–1472.
17. Yu, C. W.; Zhang, J.; Wang, R.; Chen, L. X. Org. Biomol. Chem. 2010, 8, 5277–5279.
18. Yu, C. W.; Zhang, J.; Li, J. H.; Liu, P.; Wei, P. H.; Chen, L. X. Microchim. Acta 2011, 174, 247–255.
19. Liu, C. Y.; Zhao, Q. Q.; Li, J. Chem. Reagents 2001, 23, 344–345 (in Chinese).
666