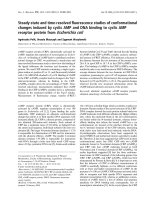
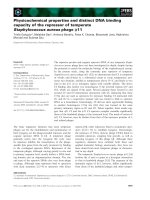
Properties and some in vitro studies of 6-phosphogluconate dehydrogenase purified from the liver of Chalcalburnus tarichi, the only fish living in Lake Van’s highly alkaline water
Bạn đang xem bản rút gọn của tài liệu. Xem và tải ngay bản đầy đủ của tài liệu tại đây (1.22 MB, 9 trang )
Turk J Chem
(2015) 39: 1050 1058
ă ITAK
c TUB
Turkish Journal of Chemistry
/>
doi:10.3906/kim-1502-68
Research Article
Properties and some in vitro studies of 6-phosphogluconate dehydrogenase
purified from the liver of Chalcalburnus tarichi, the only fish living in Lake Vans
highly alkaline water (pH 9.8)
ă
ă
Muhammet GULER
, Vedat TURKO
GLU,
Mehmet Rza KIVANC
á
Department of Biochemistry, Faculty of Science, Yă
uză
uncă
u Yl University, Van, Turkey
Received: 12.02.2015
•
Accepted/Published Online: 07.05.2015
•
Printed: 30.10.2015
Abstract: In this study, some enzymology parameters and some antibiotics affecting the enzyme activity of 6phosphogluconate dehydrogenase (6PGD) extracted from t the livers of fish from Lake Van (Chalcalburnus tarichi)
were investigated because it is an important enzyme-producing NADPH, a reductive power, protecting the cell against
the oxidative agents by producing reduced glutathione. The crude enzyme solution was obtained by using the affinity
chromatography method. The native molecular weight of the enzyme is ∼ 90,000 ± 3000 Da and it is composed of
two subunits with identical molecular weights of ∼ 46,000 Da as exhibited on sodium dodecyl sulfate-polyacrylamide gel
electrophoresis. The pH and temperature for optimal conditions of 6PGD were about 8.5 and 40 ◦ C, respectively, and
the enzyme showed optimal activity in 40 mM ammonium sulfate solution. In addition, in vitro effects of clindamycin
phosphate, streptomycin sulfate, and lincomycin antibiotics on the enzyme activity were investigated.
Key words: Enzyme purification, affinity chromatography, antibiotic, enzyme inhibition
1. Introduction
The only fish known to live in Lake Van, Turkey, is Chalcalburnus tarichi. In May and June, the fish migrate
from the lake to less alkaline water to spawn either near the mouths of the rivers feeding the lake or in the
rivers themselves. After spawning season, they return to the lake.
Some studies have been carried out on this fish, such as studies of its systematic 1 and fisheries biology, 2
its gonadal histology and biochemical properties, 3 purification and partial properties of glucose 6-phosphate
dehydrogenase from fish liver, 4 and effects of some drugs on hepatic glucose 6-phosphate dehydrogenase activity
in the fish. 5
6-Phosphogluconate dehydrogenase (EC 1.1.1.44; 6PGD), the third enzyme in oxidative reactions of the
pentose phosphate metabolic pathway, catalyzes the conversion of 6-phosphogluconate (6PGA) and NADP +
to D-ribulose 5-phosphate and NADPH, which protects the cell against the oxidant by producing reduced
glutathione (GSH). 6,7
There are many parameters that can affect the enzymatic activities, such as pH, temperature, and salt
concentrations. Enzyme activity usually varies with pH changes. When an enzyme activity is measured based
on the pH, mostly a bell-shaped curve is obtained. Its optimum pH frequently coincides with the physiological
pH value (between 7.35 and 7.45) and the activity decreases significantly at both the acid and the alkaline site
and drops finally to zero towards the most extreme pH ranges at both sides.
∗ Correspondence:
1050
¨
GULER
et al./Turk J Chem
Enzymes are also very sensitive to temperature changes. Theoretically there is no upper limit for the
increase of enzyme activity with increasing temperature; however, above a distinct temperature the rate of
enzyme catalysis reactions decreases to zero. This decrease is due to the limited stability, which is a general
feature of the enzyme. 8
Ionic strength is another important parameter affecting enzyme activity. This is especially noticeable
where catalysis depends on the movement of charged molecules relative to each other. Thus, both the binding
of charged substrates to enzymes and the movement of charged groups within the catalytic ‘active’ site will be
influenced by the ionic composition of the medium. 9
6PGD has been purified and characterized from many different sources, such as rat liver, 10 sheep
liver, 11,12 pig liver, 13 and Lake Van fish liver. 14 However, there are not any studies in the literature on the
characterization of fish liver 6PGD and on the in vitro effects of clindamycin phosphate, streptomycin sulfate,
and lincomycin on the enzyme activity. Herein, our main purpose is to characterize Lake Van fish liver 6PGD
and to investigate the in vitro effect of some antibiotics on the enzyme activity. Thus, 6PGD was purified
and the effects of some parameters such as pH, temperature, and ionic strength were investigated. The effects
of clindamycin phosphate, streptomycin sulfate, and lincomycin antibiotics on the enzyme activity were also
investigated in this paper.
2. Results and discussion
In this study, 6PGD was purified from Lake Van fish liver. Some characteristics of the enzyme and effects of
some drugs on the enzyme activity were investigated. 6PGD was purified by 2′ , 5′ -ADP Sepharose 4B affinity
gel chromatography, which is an effective one-step method for enzyme purification. Affinity chromatography is
a remarkable method used to purify a protein of interest from the pool of proteins. It is carried out according
to the advantage of high affinity of protein because of specific chemical groups. 15,16
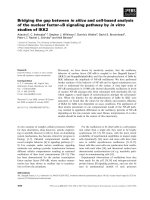
The purification method above yielded fish liver 6PGD at 446-fold and a specific activity of 23,173
EU/mg protein. The eluates were plotted by arraying out protein determination and 6PGD activity (Figure
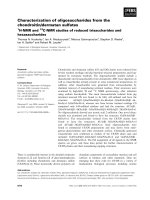
1). SDS polyacrylamide gel electrophoresis was performed after purifying the enzyme. Fish liver 6PGD was
loaded on two lines (line A and line B) using the same eluate to display the purity of the enzyme clearly
(Figure 2). The electrophoretic pattern and the biochemical reaction catalyzed by the enzyme show that the
enzyme was purified from fish liver because the pattern shows that there is only one protein in the eluates after
purification. In addition, the chemical reaction catalyzed by the purified enzyme indicates that this protein
is 6PGD. To estimate the molecular weight of the enzyme, logMw vs. relative mobility (R f ) was plotted
using protein molecular weight marker (Fermentas unstained protein ladder SM0671) (Figure 3). The native
molecular weight of the enzyme is about 93,000 Da, composed of two subunits with identical molecular weights
of 46,000 Da. The molecular weight of 6PGD varies between 80 and 150 kDa according to its source. The
molecular weight of the subunit of the enzyme was different from those reported for the enzyme extracted from
Phormidium sp. (52,000), 17 Streptococcus faecalis (55,000), 18 and rat liver (54,000). 19
The enzyme activity was measured at various pH values of 1 mM Tris-HCl buffer. Activity% vs. pH of
the enzyme is shown in Figure 4. The optimum pH was determined as about 8.5, distinct from lamb liver, 20 pig
liver, 12 human erythrocytes, 19 and the human brain. 21 More than 50% of the maximum activity was shown
in the pH range of 6.0–10.0. In one study, glucose 6-phosphate dehydrogenase, the first enzyme of oxidative
reactions of the pentose phosphate metabolic pathway, showed high activity between pH levels of 7.0 and 9.5. 4
1051
¨
GULER
et al./Turk J Chem
Figure 1. Purification of 6PGD enzyme using 2′ , 5′ -ADP
Sepharose 4B affinity chromatography column.
Figure 2. SDS-PAGE photograph. Lane C: standard
proteins (Fermentas unstained protein ladder SM0671).
Lanes A and B: purified 6PGD from Lake Van fish liver.
Figure 3. Standard Rf –log MW graph of fish liver 6PGD
using SDS-PAGE.
Figure 4. Effect of temperature on the enzyme activity.
Temperature was only changed from 5 to 70 ◦ C. Readings
were taken at 1-min intervals for 5 min. The experimental
cuvette contained 1 M Tris-HCl buffer (pH 8.0), 0.1 M
MgCl 2 , 6 mM 6PGA, 2 mM NADP + , and 50 µ L of
purified 6PGD in a final volume of 1.0 mL.
The influence of temperature on the enzyme activity is displayed in Figure 5. The optimum temperature
for the 6-phosphogluconate dehydrogenase activity was 40 ◦ C. The enzyme activity reduced sharply above
55 ◦ C. The enzyme exhibited more than 50% of maximum activity between 5 and 55 ◦ C.
1052
¨
GULER
et al./Turk J Chem
The results presented in Figure 6 show variations in enzyme activity with varying (NH 4 )2 SO 4 in TrisHCl buffer (pH 8.0). The enzyme exhibited maximum activity in 40 mM (NH 4 )2 SO 4 solution. The activity
reduced to the control activity after adding 50 mM (NH 4 )2 SO 4 . This result is in agreement with the literature
studies. 22−24 In these studies, it has been reported that the enzyme shows maximum activity in lower salt
concentrations.
Figure 5. Effect of pH on the enzyme activity. Readings
were taken at 1-min intervals for 5 min. Tris-HCl buffer
was used from 5.5 to 9.5. The complete system contained
1 M Tris-HCl buffer, 0.1 M MgCl 2 , 6 mM 6PGA, 2 mM
Figure 6. Effect of ionic strength on the enzyme activity.
The assay system was identical to that described in Figure
4, except that (NH 4 )2 SO 4 was used from 0.02 to 0.3 M.
NADP + , and 50 µ L of purified 6PGD in a final volume
of 1.0 mL.
Figure 7. Lineweaver–Burk graphs with five different
Figure 8. Lineweaver–Burk graph with five different sub-
substrate concentrations (6PGA) and three different clin-
strate concentrations (6PGA) and three different strepto-
damycin phosphate concentrations used for the determination of K i .
mycin sulfate concentrations for determination of K i . The
assay system was the same as that described in Figure 7
except that three different concentrations of streptomycin
sulfate (8.58, 17.16, and 25.74 mM) were used for the experimental cuvette in place of clindamycin phosphate.
In this study, clindamycin phosphate, streptomycin sulfate, and lincomycin antibiotics showed noncompetitive inhibition on the in vitro enzyme activity (Table). In order to determine quantitative inhibitory effects
1053
¨
GULER
et al./Turk J Chem
of these antibiotics on the enzyme activity, both the K i and the IC50 parameters of these drugs were calculated.
The K i values of clindamycin phosphate (Figure 7), streptomycin sulfate (Figure 8), and lincomycin (Figure 9)
were calculated from Lineweaver–Burk graphs. The IC50 values of clindamycin phosphate (Figure 10), streptomycin sulfate (Figure 11), and lincomycin (Figure 12) were estimated from activity (%)–drug concentration
graphs. In conclusion, the enzyme has more affinity to streptomycin sulfate than clindamycin phosphate and
lincomycin taking into consideration both the K i and IC50 values.
Figure 9.
Lineweaver–Burk graph with five different
substrate concentrations (6PGA) and three different lincomycin concentrations used for the determination of K i .
The measurement system was the same as that described
in Figure 8, except that three different concentrations of
lincomycin (32.50, 65.00, and 97.50 mM) were used for the
experimental cuvette in place of clindamycin phosphate.
Figure 10. Activity% vs. clindamycin analysis graph for
fish liver 6PGD. Readings were taken at 1-min intervals for
5 min. The control cuvette contained 1 M Tris-HCl buffer
(pH 8.0), 0.1 M MgCl 2 , 6 mM 6PGA, 2 mM NADP + , and
50 µ L of purified 6PGD in a final volume of 1.0 mL. The
experimental cuvette was identical to the control cuvette,
except that seven different concentrations of clindamycin
phosphate (7.43, 14.85, 22.27, 37.13, 52.00, 66.83, and
81.68 mM) were used.
Table. The effect of clindamycin phosphate, streptomycin sulfate, and lincomycin on 6PGD activity purified from
Chalcalburnus tarichi liver.
Clindamycin phosphate
Streptomycin sulfate
Lincomycin
Inhibition type
Noncompetitive
Noncompetitive
Noncompetitive
Ki (mM)
34.69 ± 4.01*
16.98 ± 3.102
223.78 ± 32.16
IC50 (mM)
51.05
27.63
94.29
*Each value is the average of three measurements.
3. Experimental
2′ , 5′ -ADP Sepharose 4B was obtained from Amersham Biosciences.
6PGA, protein assay reagents, and
chemicals for electrophoresis were purchased from AppliChem GmbH. NADP + and NADPH were purchased
from Sigma Chemical Company. All other chemicals used were purchased from either AppliChem or Merck.
The antibiotics were used as received without further purification.
1054
¨
GULER
et al./Turk J Chem
Figure 11. Activity% vs. streptomycin sulfate analysis
graph for fish liver 6PGD. The control and experimental
cuvettes were identical to that described in Figure 10,
except that five different concentrations of streptomycin
sulfate were used for the experimental cuvette in place of
clindamycin phosphate.
Figure 12. Activity% vs. lincomycin analysis graph for
fish liver 6PGD.
3.1. Homogenate preparation
Ten grams of fresh fish liver was cut into small pieces and added into 0.02 M phosphate buffer (pH 7.4) containing
8.25 g of sucrose. The mixture was homogenized in a Waring blender, and then the homogenate was centrifuged
at 12,000 rpm and 4 ◦ C for 60 min and the precipitate was removed. This last process was repeated three
times.
3.2. Preparation of 2 ′ ,5 ′ -ADP Sepharose 4B Affinity Chromatography Column
The 2′ , 5′ -ADP Sepharose 4B Affinity Chromatography Column was prepared by the following sequence: i)
2 g of dried 2′ , 5′ -ADP Sepharose 4B gel was washed with distilled water, to remove impurities and air, and
suspended in 0.1 M K-acetate/0.1 M K-phosphate buffer (pH 6.0); ii) the gel was packed into a column; iii)
the column was equilibrated with 50 mM K-phosphate buffer (pH 6.0) containing 1 mM EDTA by a peristaltic
pump; iv) the dialyzed sample obtained previously was loaded into the column; v) the column was washed with
25 mL of 0.1 M K-acetate/0.1 M K-phosphate (pH 6.0) and 25 mL of 0.1 M K-acetate/0.1 M K-phosphate (pH
7.85), respectively; vi) the latter washing was continued with 0.1 M K-acetate/0.1 M K-phosphate (pH 7.85),
until the last absorbance became 0.05 at 280 nm; vii) the enzyme was eluted using 5 mM NADP + containing
80 mM K-phosphate, 80 mM KCl, and 10 mM EDTA (pH 7.85). Active fractions were collected for further
studies. 25,26
3.3. Protein determination
The Bradford protein assay method was used for the determination of total protein concentrations in both the
dialyzed sample previously prepared and the active fractions depending upon the change in absorbance at 595
nm based on the proportional binding of the dye Coomassie Blue G-250 to proteins. For this purpose, a standard
graph of absorbance vs. bovine serum albumin concentration was drawn and then protein concentrations in the
samples were estimated by this graph. 27
1055
¨
GULER
et al./Turk J Chem
3.4. Enzyme activity determination
The enzyme activity was measured according to the Beutler method.
6P GD
6P GA + N ADP + −−−−→ Ribulose-5-phosphate + N ADP H + H + + CO2
The rate of the formation of NADPH is proportional to 6PGD activity as shown in the above reaction and it is
measured spectrophotometrically as an increase in absorbance at 340 nm with a Shimadzu Spectrophotometer
UV-1800. The assay system contained 1 mM Tris-HCl buffer (pH 7.5), 5 mM EDTA, 6 mM 6PGA, and 2 mM
NADP + in a total volume of 1 mL. One enzyme unit is defined as the reduction of 1 µ mol of NADP + per
minute under the assay conditions. 28
3.5. Molecular weight determination by SDS-PAGE
To control the purity of the enzyme, SDS-polyacrylamide gel electrophoresis was used according to Laemmli’s
procedure. The acrylamide concentrations of the stacking and separating gels were selected as 3% and 10%,
respectively, and 1% SDS, which provides some functions such as denaturing secondary, tertiary, and quaternary
structures by binding to hydrophobic regions of protein, was added to the gel solution. The gel was stabilized
in a solution containing 50% propanol, 10% TCA, and 40% distilled water for about 30 min. Then the gel was
added to the staining solution containing 0.1% Coomassie Brilliant Blue R-250, 50% methanol, 10% acetic acid,
and 39.9% distilled water for about 2 h. Finally, the gel was washed varying the same solvent without dye until
protein bands were cleared. 29
3.6. Optimum pH and temperature determination
pH measurements were done at a pH range from 5.5 to 10.0 with 1 M Tris-HCl buffer containing 5 mM EDTA,
0.1 M MgCl 2 , 2 mM NADP + , and 6 mM 6PGA to determine optimum pH for the enzyme activity and create
an activity (%) vs. pH graph. 30
To estimate optimum temperature for the enzyme activity, measurements were carried out at different
temperatures (ranging from 5 to 70 ◦ C) with 1 M Tris-HCl buffer (pH 8.0) containing 5 mM EDTA, 0.1 M
MgCl 2 , 2 mM NADP + , and 6 mM 6PGA, and then the activity (%) vs. temperature graph was drawn. 19
3.7. Effect of ionic strength
Different concentrations of (NH 4 )2 SO 4 (ranging from 20 to 300 mM) were used to investigate the effect of ionic
strength on the enzyme activity. Assays were performed at 37 ◦ C.
3.8. In vitro studies
Different concentrations of clindamycin phosphate (48.8–113.9 mM), streptomycin sulfate (8.85–25.74 mM),
and lincomycin (32.5–97.5 mM) antibiotics were added to the reaction mixture containing 0.1 M MgCl 2 , 2
mM NADP + , and 1 mM Tris-HCl buffer (pH 8.0) in order to investigate the effects of the antibiotics on the
enzyme activity. The mixture was incubated for 10 min, and then 6PGA was added to the reaction mixture
and absorbances at 340 nm were taken at intervals of 5 min. The activity measurement was repeated three
times for each control and drug concentration using the same eluate. 6PGD activity was calculated using the
following equation:
A = (∆OD/6.22) × (V c/V e) × f,
1056
¨
GULER
et al./Turk J Chem
where ∆ OD is the increase in the absorbance at 340?nm per minute, Vc (mL) is total reaction volume, Ve (mL)
is the volume of enzyme solution (diluted sample) added, f is the dilution coefficient, and 6.22 is the millimolar
absorption coefficient of NADPH molecules. 28
So as to find out the K i constants of the antibiotics, Lineweaver–Burk graphs were drawn. The IC50
(half maximal inhibitory concentration) values of the antibiotics were obtained from activity (%) vs. drug
concentration plots. These antibiotics can bind to different sites of the enzyme because the drugs used here are
not similar to the substrate of the enzyme at the molecular level.
4. Conclusion
In this study, 6PGD has been purified 446-fold with a specific activity of 23,173 EU/mg protein. This work
has demonstrated that 6PGD has two subunits with identical molecular weights. 17−19 The native molecular
weight of the enzyme was estimated as 93,000 Da, composed of two exactly equivalent subunits with a molecular
weight of approximately 46,000 Da using SDS-PAGE. The enzyme shows its optimal activity at about 8.0–9.0
pH and the lake water is highly alkaline (almost pH 9.8). It can be concluded that the fish has adapted to
the lake water. Antibiotics are the most used drugs with the aim of the treatment of different diseases. These
medicines have side effects as well as their healing properties. They negatively affect other metabolic pathways
such as the pentose phosphate pathway and glycolysis pathway. Among these pathways, the oxidative pentose
phosphate pathway is an important metabolic pathway producing NADPH and ribose-5-phosphate. 6PGD
is the enzyme that catalyzes the third reaction of this pathway. The antibiotics used in the study inhibited
6PGD noncompetitively, which has been shown by in vitro study. This study can also be supported by in vivo
experiments. We think that this work will contribute to similar future works and the literature.
Acknowledgment
This work received financial support from the Presidency of Scientific Research Projects of Yă
uză
uncă
u Yıl
University (2009-FBE-YL002).
References
1. Deyrolle, T. Rev. Mag. Zool. (Paris) 2ieme serie 1872, 23, 401–405.
2. C
¸ etinkaya, O. In Eastern Anatolia I. and II. Symposium on Fisheries, Erzurum, Turkey, 1996, pp. 7183.
ă
G.; Tă
urko
glu, V.; O
guz, A. R. Fish Physiol. Biochem. 2007, 33, 153165.
3. Unal,
4. Tă
urko
glu, V.; Altun, M.; C
á iftáci, M. J. Physiol. Biochem. 2006, 62, 155161.
5. C
á iftáci, M.; Tă
urko
glu, V.; C
¸ oban, T. A. J. Hazard. Materials 2007, 143, 415–418.
6. Lehninger, A. L.; Nelson, D. L.; Cox, M. M. Lehninger Principles of Biochemistry; W.H. Freeman: New York, NY,
USA, 2000.
7. Bianchi, D.; Bertrand, O.; Haupt, K.; Coello, N. Enzyme Microb. Technol. 2001, 28, 754–759.
8. Bisswanger, H. Enzyme Kinetics: Principles and Methods; Wiley: Weinheim, Germany, 2008.
9. Chaplin, M. F.; Buche, C. Enzyme Technology; Cambridge University Press: New York, NY, USA, 1990.
10. Maglysh, S. S.; Gorbach, Z. V.; Ostrovskii, I. U. M. Biokhimiia 1982, 47, 2035–2041.
11. Villet, R. H.; Dalziel, K. Biochem. J. 1967, 104, 38–39.
12. Somers, D. O.; Hajdu, J.; Adams, M. J. Protein Expr. Purif. 1991, 2, 385–389.
13. Toews, M. L.; Kanji, M. L.; Carper, W. R. J. Biol. Chem. 1976, 251, 7127–7131.
1057
¨
GULER
et al./Turk J Chem
14. G¨
uler, M.; Kıvan¸c, M. R.; T¨
urko˘
glu, V.; Basi, Z.; Kıvrak, H. Bull. Environ. Contam. Toxicol. 2013, 9, 560–564.
15. Prath, R. J.; Ernback, S. Nature 1967, 214, 1302–1304.
16. Cuatrecases, P.; Anfinsen, C. B. Methods in Enzymology; Academic Press: New York, NY, USA, 1971.
17. Sawa, Y.; Suzuki, K.; Ochiai, H. Agric. Biol. Chem. 1985, 49, 2543–2549.
18. Bridges, R. B.; Palumbo, M. P.; Wittenbreger, C. L. J. Biol. Chem. 1975, 250, 6093–6100.
19. Beydemir, B.; C
¸ ift¸ci, M.; Yılmaz, H.; Kă
uvrevio
glu, O. I. Turk J. Vet. Anim. Sci. 2004, 28, 707–714.
20. Carne, A. Anal. Biochem. 1982, 121, 227–229.
21. Weisz, K. S.; Schofield, P. J.; Edwards, M. R. J. Neurochem. 1985, 44, 510–517.
22. Procsal, D.; Holten, D. Biochem. 1972, 11, 1310–1314.
23. Dyson, J. E.; D’Orazio, R. E.; Hanson, W. L. T. J. Biol. Chem. 1973, 248, 5428–5435.
24. Pearse, B.; Rosemeyer, M. A. Eur. J.Biochem. 1974, 42, 213–223.
25. Ninfali, P.; Orsenigo, T.; Barociani, S. R. Prep. Biochem. Biotechnol. 1990, 20, 297309.
26. Akyă
uz, M.; Erat, M.; C
á iftáci, M.; Gă
umă
uástekin, K.; Bakan, N. J. Enzyme Inhib. Med. Chem. 2013, 19, 361–365.
27. Bradford, M. M. Anal. Biochem. 1976, 72, 248–251.
28. Beutler, E. Red Cell Metabolism; Grune & Stratton: New York, NY, USA, 1984.
29. Laemmli, D. K. Nature 1970, 227, 680–683.
30. Rosemeyer, M. N. Cell. Biochem. Func. 1987, 5, 79–95.
1058