Understanding of livelihood vulnerability to cilimate change evidence from quang ninh province viet nam
Bạn đang xem bản rút gọn của tài liệu. Xem và tải ngay bản đầy đủ của tài liệu tại đây (490.1 KB, 11 trang )
GATR Journal of Business and Economics Review
Journal homepage: />
J. Bus. Econ. Review 6(2) 137 – 147 (2021)
Understanding Livelihood Vulnerability to Climate Change: Evidence
from Quang Ninh Province, Vietnam
Van Hong Thi Ha1, Nguyen Bang Nong2*
1, 2Vietnam
Academy of Social Sciences, 1 Lieu Giai, Ba Dinh, 11106, Hanoi, Vietnam
ABSTRACT
Objective – Vietnam is one of the world's most severely affected countries by climate change. The consequences of
climate change reduce the goal of poverty alleviation and sustainable development of the country. Quang Ninh is a
coastal province with vigorous development in industry and tourism and is the leading province in Provincial
Competitiveness Index (PCI) in Vietnam in recent years.
Methodology/Technique – However, for many years, Quang Ninh province has suffered many negative impacts of
climate change. Based on empirical evidence, the article assesses the vulnerability in people's livelihoods under the
impact of climate change in Quang Ninh province by using the Livelihood Vulnerability Index (LVI) developed by
Hahn, Riederer, and Foster.
Findings – The paper also assesses livelihood vulnerability based on the Intergovernmental Panel on Climate Change
(IPCC.) The research results show that the components of responding well to climate change are not acceptable.
Novelty – The study also shows that there should be different policies, strategies, and reduction components to improve
the capacity to respond to climate change to ensure sustainable development goals.
JEL Classification: Q01; Q56
Keywords: Climate Change, Resources, Livelihood Vulnerability, Sustainable Development, Vietnam.
Reference to this paper should be made as follows: Ha, V.H.T; Nong, N.B. (2021). Understanding Livelihood
Vulnerability to Climate Change: Evidence from Quang Ninh Province, Vietnam, J. Bus. Econ. Review, 6(2), 137–147.
/>
__________________________________________________________________________________
1. Introduction
Vietnam is one of the world's most severely affected countries by climate change. Among 84 developing
countries in coastal areas and affected by sea-level rise, Vietnam ranks first in severe consequences related to
GDP growth and agricultural production (World Bank, 2016.) According to (Maplecroft, 2014), Vietnam is
in 30 hazardous countries in the world. Climate change can reduce agricultural production by about 12% in
the Red River Delta and 24% in the Mekong Delta (World Bank, 2010.) Under the impact of sea-level rise in
2070, Vietnam will be reduced the diversity of fisheries and degraded their quality, causing adverse impacts
on the fisheries sector (VMNRE, 2016).
_____________________________
Paper Info: Revised: July 16, 2021
Accepted: September 30, 2021
*
Corresponding author: Nguyen Bang Nong
E-mail:
Affiliation: Vietnam Academy of Social Sciences, 1 Lieu Giai, Ba Dinh, 11106, Hanoi, Vietnam
*
ISSN 2636-9184, e-ISSN 0128-259X © 2021 Global Academy of Training & Research (GATR) Enterprise. All rights reserved.
Electronic copy available at: />
Van Hong Thi Ha and Nguyen Bang Nong
Climate change is increasingly evident in Vietnam. Since 1958-2014, the average temperature in Vietnam
has increased by about 0.62 Celsius, double the global average (Nguyen et al., 2013; IPCC, 2007.) Sea level
along the coast of Vietnam's sea has increased by about 3.50mm/year. Annual rainfall decreased in the North
and increased in the South, causing droughts to behave differently in different climates (VNMNRE, 2016.)
The consequences of climate change reduce the country's ability to achieve sustainable development goals,
including poverty reduction.
Livelihood vulnerability is the degree to which people and systems cannot cope with climate change and
social contexts (Adger et al., 2009) ; (Dow, 1992) ; IPCC, 2014; (O’BRIEN et al., 2007). Livelihood injuries
also affect food supply, infrastructure development, health, water use, and ecosystems (IPCC, 2007.)
Based on the analytical framework of (Hahn, M. B., Riederer, A. M., & Foster, 2009) and IPCC (2001),
the paper assesses the livelihood vulnerability of people in the Van Don district, Quang Ninh province, under
the impact of climate change in the past ten years (2010-2019.)
Quang Ninh province is the leading province in Vietnam in the Provincial Competitiveness Index (PCI) in
recent years (Malesky, E., Phan, T. N., & Pham, 2021). The province's per capita income reached 2,712 USD
per person per year, 1.2 times higher than the national average (Vietnam General Statistics, 2020). In
addition, Quang Ninh province has developed tourism in recent years (Nong& Ha, 2021). The survey site of
the article is in Ha Long commune, Van Don district, Quang Ninh province. This area is one of three special
economic zones of Vietnam. The survey sample of the article consists of 200 households, based on a
systematic random sampling process, based on the overall list of Ha Long commune (Bryman, 2016) ;
(Bernard, 2013) The research team also conducted in-depth interviews, focus groups, and observations.
The climate change’s context in Quang Ninh province increased in temperature from 22.9 Celcius in 1980
to 24.9 Celcius in 2019. From 2010-2019, Quang Ninh has had more than 93 disasters from nature (People's
Committee of QuangNinh Province, 2010; Quang Ninh Statistic Office, 2010-2020). In the years 2011, 2016,
2017, and 2019, Quang Ninh had more than ten storms and unusual natural disasters in the province (Quang
Ninh Statistic Office, 2010-2020.) In the past ten years (2010-2019), the total damage from natural disasters
was more than $266 million US dollars each year. In addition, severe storms have entered this region, such as
Son Tinh (2012,) Haiyan (2013), and Mirinae (2016.) Many people and local leaders in the Van Don district
still remembered that during the 2016 storm, almost 80% of the oyster farming area of people in the sea was
wiped out. (Alwang et al., 2001)
2. Literature review
The background researches on climate change's impact on people's lives can be mentioned as the study of
(Watts, M. J., & Bohle, 1993), (Blaikie et al., n.d.), (Kelly & Adger, 2000). These authors showed a
correlation between environmental change and social dynamism to increase the environment's resilience to
disasters. However, many other studies, such as those of (Adger et al., 2009) and Cutter et al. (2000), also
showed that population structure features can or cannot adapt to climate changes. For example, (Dulal, H. B.,
Brodnig, G., Thakur, H. K., & Green-Onoriose, 2010) demonstrated that due to a lack of capital, poor
households are less able to adapt to the effects of climate change. On the other hand, research by (McElwee,
138
J. Bus. Econ. Review 6(2) 137 – 147 (2021)
Electronic copy available at: />
Van Hong Thi Ha and Nguyen Bang Nong
2010) showed that social dimensions in terms of gender, religion can adapt to climate change in Vietnam.
(Aryal et al., 2014)
One of the first assessments of livelihoods at the household level begins with the five sources of capital
(natural, social, financial, physical, and human capital) that (Chambers, R., & Conway, 1992) proposed in
1992. Many international organizations, such as those of (DFID (Department for International
Development)., 1999), (FAO (Food and Agriculture Organization of the United Nations), 2009), and UNDP
(2017), currently use these capitals in evaluating projects related to livelihoods.
From some of the above background studies, the two most used indicators are IPCC (2001) and (Hahn, M.
B., Riederer, A. M., & Foster, 2009) in evaluating climate change vulnerability to livelihood.
In the study in Mozambique, (Hahn, M. B., Riederer, A. M., & Foster, 2009) showed indicators of social
networks and household characteristics most vulnerable to the effects of climate change. (Shah et al., 2013)
in Trinidad and Tobago showed that livelihood strategies, health care, access to clean water, and land
ownership impacted the ability of households to adapt to climate change. (Tewari et al., 2010) in Bihar
showed that the level of education, diversity of livelihoods, and expansion of households' social networks
coped with the negative impacts of climate change. (Panthi et al., 2015) in Nepal research indicated that
livelihood strategies and access to food are the most important causes of people's vulnerability to climate
change. (Simane et al., 2016), in their analysis of the vulnerability of climate change in Ethiopia, showed that
the wealth, technology, and infrastructure profiles were strong determinants of vulnerability. In the Ghana
study, (Adu et al., 2018) also found that social networks and livelihood strategies were essential indicators
that households were vulnerable to extreme weather. (Ding et al., 2018) showed that social capital and
natural capital were two essential indicators that affect people's livelihoods to adapt to negative climate
phenomena. (Sujakhu et al., n.d.) showed that financial resources, household health, and livelihood strategies
affected the capacity to adapt to climate change. (Majid et al., 2019) combined GIS to assess livelihood
vulnerability showed that households living along rivers were vulnerable to climate change like a flood.
Overall, studies on livelihood vulnerability show a diverse picture of communities affected by climate
change worldwide. (Bernstein, L., Bosch, P., Canziani, O., Chen, Z., Christ, R., & Riahi, 2008) (Bang Nong,
N., & Ha, 2021) (Pandey & Jha, 2012)
3. Research methodology
The formulation for LVI developed for this study is based on the livelihood vulnerability analysis
technique developed by (Hahn, M. B., Riederer, A. M., & Foster, 2009) including seven major components
(Socio-Demographic Profile (SDP), Livelihood Strategies (LS), Social Networks (SN), Health (H), Access to
Food (F), Access to Water (W), Natural Disaster and Climate Variability (NDCV).) In addition, each major
component includes sub-components (see more at Table 1.)
Since each sub-component is measured using a different scale, it was necessary first to standardize each
index. Therefore, the following equation is adapted from the Human Development Index (UNDP, 2007;
(Hahn, M. B., Riederer, A. M., & Foster, 2009);
𝑠 −𝑠
𝑖𝑛𝑑𝑒𝑥𝑠𝑣𝑑 = 𝑠 𝑣𝑑 − 𝑠𝑚𝑖𝑛
(1)
𝑚𝑎𝑥
𝑚𝑖𝑛
139
J. Bus. Econ. Review 6(2) 137 – 147 (2021)
Electronic copy available at: />
Van Hong Thi Ha and Nguyen Bang Nong
wheresvd denotes the original subcomponent for the research area and smin and smax denote the
subcomponent's minimum and maximum values determined using data from the research area. For instance,
the percent of households reporting in their community was set between 0 and 100. After standardization, the
sub-components were averaged to determine the value of each major component using Equation 2:
𝑛
∑
𝑀𝑣𝑑 =
𝑖=1
𝑖𝑛𝑑𝑒𝑥𝑆𝑣𝑑𝑖
(2)
𝑛
where Mvd equals one of the seven components for the research area (SDP, LS, SN, H, F, W, or NDCV),
indexSvdi represents the subcomponents, indexed by i, that make up each principal component, and n is the
number of sub-components in each component. After calculating the values for the seven significant
components of the research area, they were averaged using Equation 3 to obtain the research area's LVI.:
7
∑
LVIvd =
WM i Mvdi
i=1
7
∑
i=1
(3)
WM i
which can also be explained in Equation 4 as below:
𝐿𝑉𝐼𝑣𝑑 =
𝑊𝑆𝐷𝑃 𝑆𝐷𝑃𝑣𝑑 + 𝑊𝐿𝑆 𝐿𝑆𝑣𝑑 + 𝑊𝑆𝑁 𝑆𝑁𝑣𝑑 + 𝑊𝐻 𝐻𝑣𝑑 + 𝑊𝐹 𝐹𝑣𝑑 + 𝑊𝑊 𝑊𝑣𝑑 + 𝑊𝑁𝐷𝐶𝑉 𝑁𝐷𝐶𝑉𝑣𝑑
𝑊𝑆𝐷𝑃 + 𝑊𝐿𝑆 + 𝑊𝑆𝑁 +𝑊𝐻 +𝑊𝐹 + 𝑊𝑊 +𝑊𝑁𝐷𝐶𝑉
(4)
where LVIvd is the Livelihood Vulnerability Index for the research area vd, and the weightage of the
seven major components, WMi, determined by the number of sub-components that make up each major
component, contribute equally to the overall LVI (Sullivan, 2002) ; (Hahn, M. B., Riederer, A. M., & Foster,
2009). Thus, in this study, the LVI is scaled from 0 (least vulnerable) to 0.5 (most vulnerable).
The LVI-IPCC approaches utilise household level primary data to measure the sub-components. Exposure
(NDCV), adaptive capacity (SDP, LS, and SN), and sensitivity (H, F, W) are critical components of the LVIIPCC that contribute to vulnerability. All three central components represent in Equation 5 (Hahn, M. B.,
Riederer, A. M., & Foster, 2009):
𝑛
∑
𝐶𝐹𝑣𝑑 =
𝑊𝑀 𝑖 𝑀𝑣𝑑𝑖
𝑖=1
𝑛
∑
𝑖=1
(5)
𝑊𝑀 𝑖
where CFvd is an IPCC-defined contributing factor (exposure, sensitivity, or adaptive capacity) for the
research area vd, Mvdi is the major components for the research area vd, indexed by i, WMi is the weightage
of each significant component, and n is the number of major components in each contributing factor (Hahn,
M. B., Riederer, A. M., & Foster, 2009) After calculating exposure, sensitivity, and adaptive capacity, the
three contributing variables were combined using Equation 6:
𝐿𝑉𝐼 − 𝐼𝑃𝐶𝐶𝑣𝑑 = (𝑒𝑣𝑑 − 𝑎𝑣𝑑 ) ∗ 𝑆𝑣𝑑
(6)
where LVI-IPCCvd is the LVI for the research area vd expressed using the IPCC vulnerability framework,
e is the calculated exposure score (equivalent to NDCV major component,) a is the adaptive capacity score
(equivalent to SD, LS, SN,) and s is sensitivity score (equivalent to H, F, and W) (Hahn, M. B., Riederer, A.
M., & Foster, 2009) The LVI-IPCC is adjusted from -1 (least vulnerable) to 1 (most vulnerable).
140
J. Bus. Econ. Review 6(2) 137 – 147 (2021)
Electronic copy available at: />
Van Hong Thi Ha and Nguyen Bang Nong
Table 1. Major components and sub-components comprising the livelihood vulnerability index developed for Van Don
district, Quang Ninh province, Vietnam
• Socio-Demographic Profile:
- Dependency ratio1: The population under 15 and over 65 years of age to the population.
- Percent of female-headed households2: Percentage of households where the primary adult is female.
- Multidimensionally poor and near poor households3: Percentage of households in which category according to the
criteria of Quang Ninh province.
• Livelihood Strategies:
- Households that report family members who work outside of the community 4: Percentage of households with at
least one family member who works primarily outside the community.
- Households dependent mainly on fishery5: Percentage of households that report only fishery as a primary source of
income.
- Average livelihood diversification index6: The number of livelihood activities (+1) reported by a household, e.g., A
household that farms raise animals and collect natural resources, will have a Livelihood Diversification Index = 1/(3 +
1) = 0.25.
• Health:
- Average time to health facility (minutes)7: The average time it takes the households to get to the nearest health
facility.
- Households having family members with chronic illness8: Percent of households with family members with chronic
illness.
- Family member who had to miss work or school due to illness9: Percentage of households where a family member
could not work or attend school in the last two weeks.
- Headed-households well-being10: Health status of head of household.
• Social Networks:
- Households supported in the past 12 months11: Percentage of households receiving help in the past 12 months.
- Households borrowed or lent money in the past 12 months12: Percentage of households borrowing or lending
money in the past 12 months.
- Households that have not to belong to an official or unofficial organisations 13: Percent of households that have not
to belong to any official or unofficial organisations.
• Food:
- Households dependent mainly on the fishery for food 14: Percent of households dependent on the fishery for food.
- Households could not buy food in the past 12 months15: Percentage of households unable to buy food in the past 12
months.
- Average Fishery Diversity Index16: The inverse of the number of fishes grown by a household (+1). E.g., A
household that grows oyster, clam, groupers, and mantis shrimp will have a Fishery Diversity Index = 1/(4 + 1) =
0.20.
• Water:
- Households using hygienic water (%)17: Percentage of households using hygienic water (%).
- Households that utilise natural water sources in daily life18: Percentage of households that used well and/or rain in
their daily lives.
- Households with water sources contaminated with salt and alum 19: Percentage of households with water sources
contaminated with salt and alum.
• Natural Disasters and Climate Variability:
- Households that were not warned of impending natural disasters20: Percent of households that did not warn about
the pending natural disasters.
- Households with an injury or death resulting from the most severe natural disaster 21: Percentage of households
affected by the most severe natural disaster in the last decade (2010-2019).
141
J. Bus. Econ. Review 6(2) 137 – 147 (2021)
Electronic copy available at: />
Van Hong Thi Ha and Nguyen Bang Nong
- Damages related to housing22: Percentage of households with housing-related damage (loss of house, damage, area
of house incarcerated, house landslide) in the past ten years (2010-2019).
- Damages related to crops and livestock23: Percentage of households with losses related to crops and livestock in the
past ten years (2010-2019).
- Fishery-related damages24: Percentage of households with fish-related damage in the past ten years (2010-2019).
- 10-year average temperature (2010-2019)25: 10-year average temperature (2010-2019).
- Average annual rainfall for ten years (2010-2019)26: Average annual rainfall from 2010-2019.
- Number of floods, drought, and cyclone events in the past ten years (2010-2019)27: The average number of floods,
drought, and cyclone events in the past ten years (2010-2019).
Notes: 1, 2, 4, 5, 6, 7, 8, 9, 10, 11, 12, 13, 14, 16, 20, 21, 22, 23, 24Adapted from Hahn et al. (2009); 3, 25, 26, 27Quang Ninh Statistic Office,
2010-2020; United Nations, 2015; 15, 19UNDP, 2017; 17, 18United Nations, 2015; UNDP, 2017.
4. Results
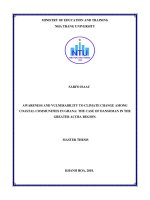
The LVI of Quang Ninh province is relatively high, with a measurement index of 0.384. This result is
consistent with many previous reports by the international research agencies, the Government of Vietnam,
and Quang Ninh province. In the LVI, social networks (0.487) and access to food (0.432) are the most
vulnerable components (Figure 1) in which sub-components about helping (0.660) and borrowing are very
high (0.550.) The research results reflect the reality of coastal residents' livelihoods under the influence of
many storms, seriously hurting aquaculture households in the sea and leading to people having to borrow and
borrow money continuously to rebuild their livelihoods, invest in production, or buy food for the family
(Table 2.)
In the context of climate change, households with only one livelihood activity based on fishing or
aquaculture (0.460) are more vulnerable than households with multiple livelihoods (0.314). Furthermore,
access to clean water for coastal residents is alarming due to the constant rain and storms. The rate of poor
households is meager in the study area (7%), but the dependency rate is very high, significantly affecting the
vulnerability in sustainable livelihoods of households under the impact of poverty. Research results show that
SDP has a relatively high injury index (0.321) in LVI. The health (H) index is also relatively high in the LVI
(0.327,) in which the distance from home to the medical facility has the highest index (0.727) (Table 2.)
Table 2. Livelihood Vulnerability Index sub-component values and minimum and maximum subcomponent values for
Van Don district, Quang Ninh province, Vietnam
Major
component
SocioDemographi
c Profile
Livelihood
Strategies
Subcomponents
Units
Dependency ratio
Percent of female-headed households
Multidimensionally poor and near-poor
households
Households that report family members
who work outside of the community
Ratio
Percent
The
maximu
m value
in the
province
100
100
The
minimu
m value
in the
province
0
0
Percent
100
0
0.070
Percent
100
0
0.055
Index for
subcomponent
s
0.578
0.315
Index for
major
componen
t
0.321
0.276
142
J. Bus. Econ. Review 6(2) 137 – 147 (2021)
Electronic copy available at: />
Van Hong Thi Ha and Nguyen Bang Nong
Households dependent mainly on fishery
Average livelihood diversification index
Health
Social
Networks
Food
Average time to health facility
Households having family members with
chronic illness
Family member who had to miss work or
school due to illness
Headed-households well-being
Households supported in the past 12
months
Households borrowed or lent money in
the past 12 months
Households that have not belong to any
official or unofficial organisations
Households dependent mainly on the
fishery for food
Households could not buy food in the past
12 months
Average Fishery Diversity Index
Households using hygienic water
Water
Natural
Disasters and
Climate
Variability
Households that utilise natural water
source in daily life
Households with water sources
contaminated with salt and alum
Households that were not warned of
impending natural disasters
Households with an injury or death
resulting from the most severe natural
disaster
Damages related to housing
Damages related to crops and livestock
Fishery related damages
10-year average temperature
Average annual rainfall for 10 years
Number of floods, drought, and cyclone
events in past ten years
Percent
1/#livelihood
s
Minutes
100
0
0.460
1
0.14
0.314
20
5
0.727
Percent
100
0
0.150
Percent
100
0
0.240
Percent
100
0
0.190
Percent
100
0
0.660
Percent
100
0
0.550
Percent
100
0
0.250
Percent
100
0
0.335
Percent
100
0
0.180
1/#fishers
1
0.5
0.780
Percent
100
0
0.115
Percent
100
0
0.115
Percent
100
0
0.070
Percent
100
0
0.235
Percent
100
0
0.210
Percent
Percent
Percent
Celcius
Millimeters
100
100
100
24.9
2.367,60
0
0
0
22.6
1.499,10
0.400
0.430
0.620
0.609
0.380
Count
13
6
0.471
0.327
0.487
0.432
0.387
0.419
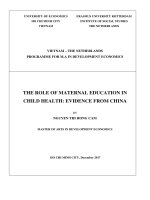
The LVI-IPCC approach also gives similar results with an index of 0.022. The vulnerability triangle shows
that storms and weather change significantly impact the LVI-IPCC index (0.419) (Figure 2.) Meanwhile,
people's adaptation strategies are pretty low (0.361) (Table 3.) That shows that the weak ability to adapt to
climate change of coastal residents in Quang Ninh.
143
J. Bus. Econ. Review 6(2) 137 – 147 (2021)
Electronic copy available at: />
Van Hong Thi Ha and Nguyen Bang Nong
Natural
Disasters…
Water
Adaptive
Capacity
0.42
0.4
0.38
0.36
0.34
0.32
SocioDemograp…
0.5
0.4
Livelihood
0.3
Strategies
0.2
0.1
0
Health
Exposure
Sensitivity
Social
Networks
Food
Figure 1. The vulnerability spider diagram of the LVI's
major components for the Van Don district, Quang Ninh
province, Vietnam.
Figure 2. Vulnerability triangle diagram of the LVI–
IPCC index' contributing factors for Van Don district,
Quang Ninh province, Vietnam.
Table 3. Components contributing factors for the Inter government Panel on Climate Change (IPCC) for Van Don
district, Quang Ninh province, Vietnam.
Major components
Exposure
Adaptive Stretegies
Sensitivity
Subcomponents
Natural disasters and climate variability
Socio-demographic profile
Livelihood strategies
Index
0.419
0.419
0.321
2.276
Social Networks
0.487
Health
0.327
Food
Water
0.432
0.387
0.361
0.377
5. Conclusions
The research results show that two different indicators conclude that the livelihood vulnerability of coastal
residents under the impact of climate change in the past ten years in Quang Ninh province is quite significant.
The capital of coastal residents plays an important role in responding and adapting to climate change. The
components that make up the financial capital are quite diverse due to the context of economic restructuring
to industry, commerce, and services; at the same time, the process of forming a special economic zone also
creates opportunities for people to increase this capital through a variety of livelihood activities. Natural
capital, and physical capital is also very good that should be mentioned. Meanwhile, social capital and human
capital are quite low. When negative effects of climate change occur, such as storms, plus planning problems,
land acquisition for local infrastructure development, then people need skills. and capacity to adapt to this
change.
144
J. Bus. Econ. Review 6(2) 137 – 147 (2021)
Electronic copy available at: />
Van Hong Thi Ha and Nguyen Bang Nong
While the aquaculture-based livelihood strategy brings good income to the people, the number of storms
and tropical depressions severely impacts people's livelihoods. In addition, at that time, the social network,
financial capital, and access to food were not very good. Since then, these factors reduce the ability of people
to adapt to climate change at the study site.
The current research results are also limited due to the small sample size, but partly reflect the judgment of
international organizations, the Government of Vietnam, and Quang Ninh province in identifying the
negative impacts of climate change on people's lives.
Acknowledgements
We gratefully thank the Vietnam Academy of Social Sciences for financial support in this research.
References
Adger, W. N., Dessai, S., Goulden, M., Hulme, M., Lorenzoni, I., Nelson, D. R., Naess, L. O., Wolf, J., & Wreford, A.
(2009). Are there social limits to adaptation to climate change? Climatic Change, 93(3), 335–354.
/>Adu, D. T., Kuwornu, J. K. M., & Anim-somuah, H. (2018). Application of livelihood vulnerability index in assessing
smallholder maize farming households’ vulnerability to climate change in Brong-Ahafo region of Ghana.
Kasetsart Journal of Social Sciences, 39(1), 22–32. />AfDB, O. E. C. D. & UNDP (United Nations Development Programme). (2017). African Economic Outlook 2017.
Alwang, J., Siegel, P. B., Jørgensen, S. L., & Tech, V. (2001). Social Protection Discussion Paper Series Vulnerability :
A View From Different Disciplines. 0115.
Aryal, A., Brunton, D., & Raubenheimer, D. (2014). Impact of climate change on human-wildlife-ecosystem
interactions in the Trans-Himalaya region of Nepal. Theoretical and Applied Climatology, 115(3), 517–529.
/>Bang Nong, N., & Ha, V. H. T. (2021). Impact of Covid-19 on Airbnb: evidence from Vietnam. Journal of Sustainable
Finance & Investment. />Bernard, H. R. (2013). Social Research Methods. Sage publications. />Bernstein, L., Bosch, P., Canziani, O., Chen, Z., Christ, R., & Riahi, K. (2008). IPCC, 2007: Climate Change 2007:
Synthesis Report. />Blaikie, P., Cannon, T., Davis, I., & Wisner, B. (n.d.). MICRODIS : Integrated Health , Social and Economic Impacts of
Extreme Events : Evidence , Methods and Tools Combined Literature Review Disaster – Facts and Figures.
Bryman, A. (2016). Social research methods. Oxford University Press.
Change, I. P. O. C. (2014). Ipcc. Climate change.
Change, I. P. O. C. (2001). Climate change 2007: Impacts, adaptation, and vulnerability. Genebra, Suớỗa.
/>145
J. Bus. Econ. Review 6(2) 137 – 147 (2021)
Electronic copy available at: />
Van Hong Thi Ha and Nguyen Bang Nong
Chambers, R., & Conway, G. (1992). Sustainable rural livelihoods: practical concepts for the 21st century. Institute of
Development Studies (UK).
DFID (Department for International Development). (1999). Sustainable livelihoods guidance sheets “ A livelihood
comprises the capabilities , assets and activities required for a means of living . A livelihood is sustainable when
it can cope with and recover from stresses and shocks and maintain the natural reso.
Ding, W., Jimoh, S. O., Hou, Y., Hou, X., & Zhang, W. (2018). Influence of Livelihood Capitals on Livelihood
Strategies of Herdsmen in Inner Mongolia , China. 1–17. />Dow, K. (1992). Exploring differences in our common future(s): the meaning of vulnerability to global environmental
change. Geoforum, 23(3), 417–436.
/>Dulal, H. B., Brodnig, G., Thakur, H. K., & Green-Onoriose, C. (2010). Do the poor have what they need to adapt to
climate
change?
A
case
study
of
Nepal.
Local
Environment,
15(7),
621–635.
/>FAO (Food and Agriculture Organization of the United Nations), & I. (International L. O. (2009). The livelihood
assessment tool-kit analysing and responding to the impact of disasters on the livelihoods of people. FAO.
/>Hahn, M. B., Riederer, A. M., & Foster, S. O. (2009). The Livelihood Vulnerability Index: A pragmatic approach to
assessing risks from climate variability and change—A case study in Mozambique. Global Environmental
Change, 19(1), 74–88. />Kelly, P. M., & Adger, W. N. (2000). THEORY AND PRACTICE IN ASSESSING VULNERABILITY TO. 325–352.
Majid, N. A., Nazi, N. M., Diana, N., & Idris, M. (2019). GIS-Based Livelihood Vulnerability Index Mapping of the
Socioeconomy of the Pekan Community.
Margulis, S., Hughes, G., Schneider, R., Pandey, K., Narain, U., & Kemeny, T. (2010). Economics of adaptation to
climate change: Synthesis report.
Malesky, E., Phan, T. N., & Pham, N. T. (2021). The Vietnam provincial competitiveness index: Measuring economic
governance for private sector development. Hanoi, Vietnam.
Maplecroft,
V.
(2014).
Climate
change
and
environmental
risk
/>
atlas
2015.
McElwee, P. (2010). The Social Dimensions of Adaptation to Climate Change in Vietnam. The World Bank.
/>Nations, U. (2015). Transforming our world: The 2030 agenda for sustainable development. New York: United Nations,
Department of Economic and Social Affairs.
O’brien, K., Eriksen, S., Nygaard, L. P., & Schjolden, A. N. E. (2007). Why different interpretations of vulnerability
matter
in
climate
change
discourses.
Climate
Policy,
7(1),
73–88.
/>Pandey, R., & Jha, S. (2012). Climate vulnerability index - measure of climate change vulnerability to communities: a
case of rural Lower Himalaya, India. Mitigation and Adaptation Strategies for Global Change, 17(5), 487–506.
146
J. Bus. Econ. Review 6(2) 137 – 147 (2021)
Electronic copy available at: />
Van Hong Thi Ha and Nguyen Bang Nong
/>Panthi, J., Aryal, S., Dahal, P., & Bhandari, P. (2015). Livelihood vulnerability approach to assessing climate change
impacts on mixed agro-livestock smallholders around the Gandaki River Basin in Nepal. Regional Environmental
Change. />QuangNinh Statistic Office. (2010-2020). QuangNinh Statistical Yearbook 2010-2020 [QuangNinh Statistical
Yearbook 2010-2020]. QuangNinh: NhaXuan Ban Thong ke.
Shah, K. U., Bansha, H., Johnson, C., & Baptiste, A. (2013). Understanding livelihood vulnerability to climate change :
Applying the livelihood vulnerability index in Trinidad and Tobago Geoforum Understanding livelihood
vulnerability to climate change : Applying the livelihood vulnerability index in Trinidad and Tobago. Geoforum,
47(April), 125–137. />Simane, B., Zaitchik, B. F., & Foltz, J. D. (2016). Agroecosystem specific climate vulnerability analysis : application of
the livelihood vulnerability index to a tropical highland region. 39–65. />Sujakhu, N. M., Ranjitkar, S., He, J., & Schmidt-vogt, D. (n.d.). Assessing the Livelihood Vulnerability of Rural
Indigenous Households to Climate Changes in Central Nepal , Himalaya.
Sullivan, C. (2002). Calculating a Water Poverty Index. 30(7), 1195–1210.
Tewari, H. R., Bhowmick, P. K., Centre, R. D., Colony, G., Parisar, N., Nagar, V., & Attribution, C. (2010). Livelihood
vulnerability index analysis : An approach to study vulnerability in the context of Bihar. 1–13.
/>Tha, T. H., Thinh, M. N. T., &Toan, M. D. D.The United States Energy Policy to Promote Sustainable Production and
Consumption in the Early Decades of the 21st Century. Sản Xuant VàTiêu Dùng Bền Vững, 123.
Vietnam General Statistics. (2020). Statistical yearbook of Vietnam 2019 [Statistical yearbook of Vietnam 2019].
Hanoi, Vietnam: Ban Thong ke.
VNMNRE (Vietnam Ministry of Natural Resources and Environment). (2016). Kich ban biendoikhihauvanuocbien
dang cho Viet Nam nam 2016 [Climate change and sea-level rise scenarios for Viet Nam in the year of 2016].
Watts, M. J., & Bohle, H. G. (1993). The space of vulnerability: the causal structure of hunger and famine. Progress in
Human Geography, 17(1), 43–67. />World Bank. (2016). Vietnam 2035: Toward prosperity, creativity, equity, and democracy. />
147
J. Bus. Econ. Review 6(2) 137 – 147 (2021)
Electronic copy available at: />