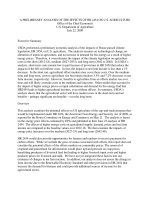
A preliminary analysis of disaster and poverty data in quang binh province viet nam
Bạn đang xem bản rút gọn của tài liệu. Xem và tải ngay bản đầy đủ của tài liệu tại đây (1.71 MB, 16 trang )
A preliminary analysis
of disaster and poverty data in Quang Binh province, Viet Nam
Main authors: Thuy T. Nguyen and Miguel Coulier
Contributing authors: Oanh Luong Nhu and Ian Wilderspin
March 2012
Under a project
of the
Ministry of Agriculture and Rural Development and the United Nations Development Programme, Viet Nam:
‘Strengthening Institutional Capacity for Disaster Risk Management in Viet Nam, including Climate Change Related
Disasters”
A preliminary analysis of disaster and poverty data in Quang Binh
province, Viet Nam
Thuy T. Nguyena, Miguel Coulierd, Oanh Luong Nhub and Ian Wilderspinc 1
1. Introduction
The Hyogo Framework for Action sets the identification, assessment and monitoring of disaster risk and
the enhancement of early warning as the second Priority for Action. More specifically, it encourages
Governments to record, analyze, summarize and disseminate statistical information on disaster
occurrence, impacts and losses through international, regional, national and local mechanisms.
Viet Nam has a well-established mechanism for the collection and collation of disaster damage data
from the national to commune level, through use of a damage and needs assessment (DANA) system.i
With the support of the United Nations Development Programme (UNDP), DANA templates for data
collection have been improved and the Committee for Flood and Storm Control (CCFSC) historical
disaster damage database consolidated utilising DesInventar softwareii. In order to show the usefulness
of the analysis of historical data for policy development purposes, a preliminary analysis was undertaken
on the historical database, resulting in a contributing paper for the 2011 Global Assessment Report
‘Revealing Risk, Redefining Development’iii. Without a comprehensive scientific analysis, this first paper
‘A preliminary analysis of flood and storm disaster data in Viet Nam’ provides a brief overview of the
frequency, distribution and impact of floods and storms in Viet Nam over the past twenty years. It
strongly makes the case for more in-depth spatial, temporal and geographical analysis of disaster
patterns and trends combined with practical policy recommendations. The paper also highlights the
need for disaggregated data up to district level for more accurate and relevant trending. Lastly, it makes
an attempt at exploring the interrelationship between disasters, vulnerability and poverty by linking
disaster data with poverty data.
As a follow-up to the first paper, further specific analysis has been undertaken in Quang Binh province.
Disaggregated data from the district level has been collected and included in the historical database. The
first part of this paper examines the disaster profile of Quang Binh and the temporal and spatial
distribution patterns disaggregated by district. The second part of the paper explores further the
relationship between poverty and disaster data, analyzing the relationship between disaster loss and
damage (the number of deaths, total number of houses destroyed and damaged, and areas of
agriculture destroyed and damaged) and poverty (poverty rate, percentage of poor households) at
district level.
1
a. and b. are UNV Specialists in Statistics and Information Technology; c. the UNDP Technical Specialist, Disaster Risk
Management; and d. the UNV International Facilitator, Disaster Risk Management, based in Hanoi, Viet Nam
2
2. Methodology and data
2.1 Disaster profile, trends and patterns
The statistical analysis undertaken utilizes DesInventar and Microsoft Office Excel software. The data
stored currently in the historical disaster damage database is disaggregated at the provincial level only.
Therefore, in order to conduct a more in-depth analysis to district level, field missions were organized to
obtain data from three provinces Quang Binh, Lao Cai and Tien Giang. These provinces are considered as
representative for the three hazard affected regions in Viet Nam: the mountainous region in the North,
the coastal area in the Centre region, and the Mekong River Delta in the South, respectively.
For the purposes of this analysis, Quang Binh was selected of the three provinces, based on different
criteria including: accessibility, reliability and consistency of data.iv The analysis builds further on the
initial analysis of the first paper (specifically case study two). As with the first paper, a number of
limitations should be taken into account when interpreting the analysis. These derive from: a strong
focus on intensive risk, rather than extensive risk; hazards – such as drought and forest fires – have been
excluded; assumed misinterpretation and resulting overlap of indicators by data inputters; varying data
collection and management capacities at the lower administrative levels; data availability over a long
period of time; and inconsistent data storage systems - resulting in loss of reports on a number of
events.
In an effort to overcome some of these limitations, the researchers have focused on consistently
collected indicators; the collection of secondary data sources and extensive ‘data mining’. Therefore, the
analysis should not be seen as being statistically significant but accurate enough for the identification
and analysis of temporal and spatial trends.
2.2 Poverty index
In Viet Nam, ‘poverty’ is calculated by two ministries utilizing different levels or thresholds: by the
General Statistics Office (GSO) under the Ministry of Planning and Investment (MPI) against the food
poverty line and general poverty linev; and by the Ministry of Labour, Invalids and Social Affairs (MoLISA)
against the official poverty line. Although the GSO uses an internationally accepted methodology, the
one used by MoLISA is considered as the official poverty line. Due to the availability and widespread use
nationally, for this case study, the official poverty line will be used.
The official poverty line is a relative poverty line, calculated for the purposes of monitoring a large scale
poverty reduction programme entitled ‘Programme 135’vi. It is adjusted every five years and is to be
applied during the next five year period. The most recently approved poverty line, effective since
January 1st 2011 for 2011-2015, is set at VND500,000 per month per capita in urban areas and
VND400,000 per month per capita in rural areas, or approximately USD24 and USD19 respectively.
There are two indices used in Viet Nam to measure and rank poverty: the poverty head count and the
poverty gap index. The poverty head count is the proportion of the population living below the official
poverty line. The poverty gap index is the mean of the difference between the living standard of poor
3
people and the official poverty line, which shows the shortfall of their expenditure from the poverty line
expressed as an average of the population. For the purpose of showing the potential usefulness of
linking disaster damage and poverty data for the identification of trends and for easy calculation and
comprehension, this paper uses the poverty head count index.
3. Quang Binh disaster profile with temporal and spatial distribution patterns
Quang Binh is one of the twenty most
hazard prone provinces in the countryvii,
affected annually by various hazards
including: flood, flash flood, tropical
depression, storm, typhoon and drought.
Due to climate change, the intensity and
geographical scope of these hazards will
increaseviii. These hazards have a significant
impact on the province’s economy, natural
resources and the livelihoods of the
population.
Quang Binh has a population of 939,281
with a population density of 116 people per
km2. 85% of the population lives in rural
areas. The population is concentrated in Dong Hoi city (with the highest density of 661 people per km2)
and Quang Trach (470 people per km2) while the mountainous districts Minh Hoa (33 people per km2)
and Tuyen Hoa (71 people per km2) are the least populated. 85% of the province – representing
8,026.57km2 of land area - is mountainous and hilly, while river deltas and coastal sand-dunes make up
the remaining 15%. About 10% of the total land area is used for agriculture and 78.5% is for forestry.
Phong Nha Ke Bang National Park, to the west of the province, extends to more than 2,800km2,
accounting for approximately 35% of the province’s total area and 44% of the forest area.ix
3.1 Disaster profile of Quang Binh province
According to the historical disaster database, Quang Binh has an average 2.5 disasters per year, not
including drought, forest fires or small low-impact disasters. The average number of datacards - or
events - reportedx per year in Quang Binh is eleven over the past fourteen years. In most cases when a
disaster happened, particularly for storms and typhoons, it affected all seven districts in the province.
Heavy rainfall and flood were in some cases affecting the whole province, in other cases with localized
impact. An overview of disasters affecting Quang Binh and their impact over the period 1997-2010 is
shown in a number of charts below.
4
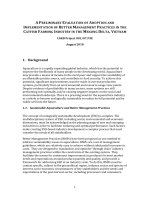
Figure 3.1a shows the different types of disasters
that have occurred in Quang Binh over the past
fourteen years in terms of number of datacards.
From the chart, storm with 65 datacards is the
most reported disaster type accounting for 45% of
the total datacards. Flood (32 datacards, 22%),
typhoon (17 datacards, 12%) and heavy rain (15
datacards, 10%) were the next most frequent
disasters. Other less frequent disaster types were
whirlwind (5%), tropical depression (4%) and cold
wave (1%).
Taking into account the inconsistent classification
of disaster types in Viet Namxi, if tropical
depression, storm and typhoon are combined
under one large ‘storm’ category, this accounts
for 61% of all disasters occurrences; combining
heavy rain and flood accounts for 32%.
Figure 3.1b shows the proportion of disasters in
terms of number of deaths. Over the period 19972010, 151 people died in Quang Binh due to
disasters, making an average of 12 deaths per
year. Storm is the most fatal disaster type with
over 65 people killed, accounting for 43% of the
total number of deaths in the province. Heavy rain
was the second most fatal with 58 deaths (38%)
and flood the third with 14 deaths (9%). Other
disaster types, such as typhoon, tropical
depression and whirlwind, caused fewer deaths
and combined, account for around 9% of deaths
over this period. Flash floods and cold waves did
not cause any fatalities.
Figure 3.1c and 3.1d compare the impact of
various disaster types on housing and agricultural
production. Figure 3.1c shows the historical
impact of disasters on the number of houses
destroyed, houses damaged and on total housing
per disaster type. Storm and heavy rain had the
most impact besides flood and typhoon.
5
Whirlwinds had negligible impact and cold wave, flash flood and tropical depression do not have any
reported impact on housing.
Figure 3.1d shows the areas of damaged rice
paddies, damage to other crops and their
combined damage per disaster type. Here, storm,
typhoon and flood caused the largest damage.
Heavy rain and tropical depression also caused
damage to agricultural production, while
negligible to no damage was caused by whirlwind,
cold waves and flash floods. Rice paddies are
damaged mostly due to typhoon, storm and flood
(in order of damage). Other crops are damaged
mostly because of storm, flood and heavy rain (in
order of damage).
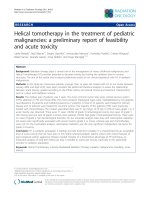
3.2 Temporal trends
The charts in Figures 3.2a, 3.2b, 3.2c and 3.2d show possible temporal trends for all major disasters or
the occurrence of various types of disasters in Quang Binh over the period analyzed, in terms of number
of datacards, deaths, houses destroyed and damaged and damaged agricultural produce. As before, to
limit inconsistencies in disaster categorization, flood and heavy rain have been combined into one
category, and tropical depression, storm and typhoon into another category.
6
Based on the data and graphs, there are a number of relevant indicative findings:
The graphs reveal a number of outliers that indicate unusual events, or events with larger than
usual impact:
o In November 1999, a large flood in Central Viet Nam resulting from storm Eve (#9xii) at the end
of October, shows a peak in number of deaths (19 compared to an average of 5) and number
of houses destroyed and damaged (79,000 compared to an average of 19,609). This event was
reported under the ‘storm’ category.
o In 2001, tropical storm Trami (#5) in mid-July and a flood caused by a tropical depression midOctober, resulted in a considerable damage to agricultural produce.
o In June 2004, although not resulting in a large number of deaths or major damage to housing,
storm Chanthu (#2) did cause serious damage to rice and other crops (13,500ha compared to
an average of 3,886ha). However, it should be noted that in the period 2001-2004, there was
nothing reported on the number of houses destroyed and damaged.
o In 2007, the significant damage to housing (139,000 compared to an average of 19,609) and
crops (12,000ha compared to an average of 3,886ha) and an increased loss of lives (24
compared to an average of 5) was caused by a number of events: storm #2 in August
(internationally classified as a tropical depression rather than a storm), Storm Lekima (#5) in
mid-October and the consequent flooding caused by this storm from mid-October to early
November.
o In 2010, historical floods in the north-central areas of the country resulted in record numbers
of deaths and damage to housing in Quang Binh province and at the same time considerable
damage to crops. This disaster was recorded in the database as ‘heavy rain’ rather than flood.
Examining the trend line for all disaster types, there is a positive trend in all the charts, meaning
that in Quang Binh, over the last fourteen years disasters have had an increasing impact on lives,
housing and agricultural production. Although there is a gap in reporting for damage to housing
between 2001 and 2004, the trend remains the same for this indicator.
7
Different types of disasters can have similar impacts on lives, housing and agriculture. For example,
based on the charts above, we can see that the floods in October 2001 as well as storm Chanthu in
2004, had an extensive impact on agricultural production but did not cause significant damage to
housing and to a lesser extent, the loss of lives. Verification from secondary data sources and the
inclusion of other impact indicators is required for more in-depth comparison of these disasters.
Based on these charts, a three year cycle may be rudimentarily identified when larger than usual
impact events seem to occur, i.e. in 1999, 2001, 2004, 2007 and 2010. However, this is observed
only over a short time period based on the data available, is not statistically significant and has to
be further analyzed incorporating other, longer term hydro-meteorological information.
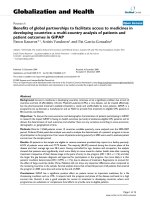
3.3 Spatial distribution patterns
The maps in Figure 3.3 show the spatial distribution patterns of impacts of all disaster types on Quang
Binh over the past fourteen years.
Figure 3.3a
Figure 3.3b
Figure 3.3c
Figure 3.3d
Figure 3.3. Spatial distribution of datacards (3.3a), deaths (3.3b), houses destroyed and damaged (3.3c), and
agriculture produce damaged (3.3d) for all disaster types
8
Figure 3.3a shows that districts in the central and south of the province have reported more disasters
than districts in the north. The most southern district, Le Thuy, has been impacted by most events with
26 datacards reported. Quang Ninh and Bo Trach districts follow closely, with 24 and 21 datacards
respectively. Dong Hoi City in the center of the province is the least affected by disasters with 17
datacards. Although Dong Hoi is much smaller and less populated compared to other districts, the
difference with other districts remains small. All districts in the province, including Dong Hoi, have been
affected almost evenly with only minor differences between the districts.
Examining fatalities over this same period, Figure 3.3b illustrates that Bo Trach is the most affected
district with 37 deaths, followed by Quang Trach, Tuyen Hoa and Quang Ninh with 35, 28 and 25 deaths
respectively. Dong Hoi and Minh Hoa have the least number of deaths with 6 deaths in each district.
Figure 3.3c indicates that Le Thuy and Quang Trach experienced the most damage and destruction to
housing over the period, with over 100,000 houses damaged or destroyed. Quang Ninh district follows
with almost 85,000 damaged and destroyed houses. Tuyen Hoa and Minh Hoa also have, for each
district, more than 50,000 houses destroyed and damaged over the same period. Dong Hoi is the least
affected with approximately 14,000 houses affected by disasters.
Figure 3.3d shows damage to agricultural produce. Bo Trach and Quang Trach districts are the most
impacted, closely followed by Le Thuy. All three districts lost more than 16,000ha of rice and other
produce over the period. Again, for agricultural impact, Dong Hoi is the least affected as its economy is
much less focused on agriculture compared with other districts.
Analyzing all the maps together, the most affected districts in the province for the selected indicators
are Quang Trach, Le Thuy and Bo Trach, which are also the most populated districts. The least affected is
Dong Hoi, followed by Minh Hoa and Tuyen Hoa, the two mountainous and least populated districts of
the province, explaining the smaller impact on housing and agricultural production. However, Tuyen Hoa
district has the third largest number of deaths in the province, occurring mainly during Storm Lekima in
October 2007 and the historical floods of October 2010.
The low number of reported events, but significant damage to housing and agriculture produce in the
case of Quang Trach might point to a number of unusually strong events or higher vulnerability. In
contrast, the high number of reported events and at the same high damage to housing and agriculture
in the case of Le Thuy might indicate to more frequent events but with ‘normal’ impact. However, a
more detailed analysis per district and comparison between similar events in different districts is
required.
9
4. Poverty - disaster relationship
4.1 Quang Binh poverty profile
Quang Binh has a large population
living below the official poverty line.
Figure 4.1a shows the poverty rate of
the province from 1996 to 2011 (data
is missing in 1998 and 2000). The
chart reveals a remarkable decline
from 46% in 1996 to about 21% in
2011, with sharp decreases from
more than 10 to 15% in 1997 and
2002 compared to the previous year.
However, the chart also shows
significant increases in 2001, 2006 and
2011. These ‘jumps’ are explained
because of the five yearly adjustment
of the official poverty line threshold in
Programme 135 (explained under Section 2.2 on methodology). In 2001 the threshold was
VND150,000/100,000 per month per capita for urban/rural areas, it changed to VND260,000/200,000 in
2006 and again to VND500,000/400,000 in 2011.xiii This means that analysis, or identification of poverty
trends, has to focus on these five year periods, as the measurement is not adjusted to one standard or
threshold.
There is a consistent and significant decline in the poverty rate in Quang Binh per each five year period
although overall, the number is still higher than the average for the whole country - 11% in 2009 and
9.45% in 2010 - according to MoLISA.
Figure 4.1b shows the poverty rate of
all the districts in Quang Binh in March
2008. The average for the whole
province at that time was 22.74% and
for the whole country 13.4%.xiv
According to the graph, Minh Hoa
district has the highest poverty rate
with more than half of the district’s
population, 51.67%, living below the
official poverty line. Tuyen Hoa is the
second poorest district in the province
with 34.91% of the population living
below the poverty line. These two
districts are remote and mountainous
10
with limited economic activities compared to other districts and a higher number of ethnic minorities.
Dong Hoi, with 3.69% of the population below the poverty line, has a significantly lower poverty rate
than other districts and compared to the whole province, while the poverty rate of the other four
districts averages around 15 to 25%. In 2008, 5 out of 7 districts were under, or close to, the provincial
poverty rate; 2 were under or close to the national
poverty rate.
Figure 4.1c examines the proportion of poor
households in the district, out of the total number
of poor households in the province. The district
with the largest population, Quang Trach
(approximately 300,000 people, 30.7% of the total
for the province), has the highest number of poor
households, accounting for more than 28.73% of
the whole province, followed by Le Thuy and Bo
Trach. With a population of around 103,000 people
(11% of total in the province) but only a poverty
rate of 3.69%, Dong Hoi accounts for only 1.98% of
the total number of poor households in the province.
Table 4.1d
March 2008: district population figures compared to both poverty indicators – poverty
rate and the percentage of poor households; the highest is marked with an asterisk
Districts
Minh Hóa
Tuyên Hóa
Quảng Trạch
Quảng Ninh
Lệ Thủy
Bố Trạch
Đồng Hới
Total (for Quang Binh):
Population
Poverty rate (%)
Percentage of poor
households
46,289
82,662
288,466 (*)
93,039
146,032 (*)
179,645 (*)
103,148
939,281
51.67 (*)
34.91 (*)
26.82 (*)
25.19
20.85
16.65
3.69
22.74
11.63
14.58
28.73 (*)
12.27
15.72 (*)
15.08 (*)
1.98
100
Source: DoLISA, Quang Binh
4.2 Poverty – disaster damage relationship
In this section, the nature of the relationship between poverty and disasters for the selected indicators
in Quang Binh is examined. It is often assumed that poor households are more vulnerable to disasters
and are therefore likely to be more affected when a disaster occurs. Also, disasters could potentially
cause poverty or exacerbate existing poverty. Although this correlation between poverty and disasters is
complex, a preliminary analysis was undertaken based on selected indicators. For this paper, poverty is
measured through the poverty rate at the provincial level and disaster impact through number of
deaths, damage to housing and damage to agricultural produce.
11
Figure 4.2a shows the relationship between poverty and disaster impact over the period analyzed for
Quang Binh province. The three damage indicators have been rescaled and weighed equally to produce
one indicator ‘disaster impact’. Data on poverty rate for the province for 1998 and 2000 were
unavailable and have therefore been roughly estimated. It should again be emphasized that the sharp
increase in 2001 and 2006 is explained by the five yearly adjustment of the official poverty line threshold
in Programme 135.
In each five year period, when the poverty rate threshold is the same, there is a consistent decline of the
poverty rate, meaning disasters did not cause the overall poverty rate in the district to increase.
However, a slower pace of decline in the years 2004 and 2007 is observed, potentially indicating an
impact of the disaster on the rate of decline. However, this cannot be detected in 2003 where there is a
similar, slower pace of decline but not a significant disaster impact and in 2010 with a normal pace of
decline but the largest disaster impact over the period. Therefore, based on the chart above, no
definitive conclusion may be made on the impact of disasters on poverty.
In the next step, the relationship between poverty and disaster impact was examined by comparing
districts. However, due to the lack of availability of disaggregated data for the districts for the indicators
of poverty rate and percentage of poor households over the entire period, March 2008, one period
where the data on poverty is available, was examined and compared with the total disaster impact for
2007 and the accumulated impact from 1997 until 2007, see Figure 4.2b.
12
A higher accumulated disaster impact in one district could lead to a lower poverty rate than in other
districts, especially when districts are almost evenly exposed to disasters, which has been observed
before to be true in Quang Binhxv. In Figure 4.2b, it may be seen that for the poverty rate indicator, the
districts with the highest poverty do not match the districts with the highest accumulated disaster
impact, or disaster impact for 2007 only. However, for the percentage of poor household’s indicator and
the accumulated disaster impact, it does more so but still not conclusively. Therefore, the most
important correlation is that districts with the highest percentage of poor households are very likely
those with the highest disaster impact.
Examining the three disaster impact indicators separately in relation to the poverty rate and the
percentage of poor households no conclusive trend or pattern can be observed for the whole province
and for all the districts without further quantitative and qualitative analysis.
5. Conclusion
As a follow-up to the first paper ‘A preliminary analysis of flood and storm disaster data in Viet Nam’,
this Quang Binh case study has provided a more in-depth disaster profile of one particular province,
including specific temporal and spatial distribution patterns while using district aggregated data. It also
looked deeper into the relationship between disasters and poverty through analysis of various
indicators: number of deaths, impact on housing and agricultural produce, poverty rate and the
percentage of poor households.
13
Importantly, the paper has developed a methodology that could be applied consistently to all districts,
where DRR measures could be taken which a higher statistical confidence. It also shows the potential for
carrying out disaster risk profiling for all provinces in the country. This kind of profiling could be a useful
input into various Government and non-Government programs, e.g. the community-based disaster risk
management (CBDRM) program.
Clearly, there are serious challenges in data gathering, processing and integration in Viet Nam. Still, the
availability of disaster data has been significantly improved through the establishment of a historical
disaster damage database, using the DesInventar software.
Despite this progress, limitations remain which makes analysis challenging or in some cases, impossible.
For this to improve, the following could be considered:
Avoid future inconsistencies in data collection through nationwide and recurrent training of
provincial and lower administrative level Committee for Flood and Storm Control staff on disaster
damage and needs assessment templates and data processing. The GSO could be involved in the
training to tap into their expertise and encourage collaboration.
Further enhance the disaster damage database by including district and commune disaggregated
data, further mining of existing data and inclusion of new data on other hazards: drought, salt
water intrusion and earthquakes to allow a multi-hazard assessment.
Link the historical disaster database managed by the Central Committee for Flood and Storm
Control, with other existing databases on socio-economic indicators, managed by the GSO and
ensure the access of information.
As seen in this case study, the relationship between disasters and poverty is complex and could not be
analyzed in detail due to a variety of limitations. The analysis undertaken showed no conclusive
relationship between poverty and disasters. However, further research is required to examine the
situation in greater detail and link disaster impact data with different sets of socio-economic data.
This case study is a starting point to show the potential for more in-depth analysis by including more
quantitative and qualitative data but also to show the usefulness of cross-sectoral analysis by including
underlying vulnerability factors of poverty, gender, education and other socio-economic indicators. This
could be a strong input in the development of new strategies, policies and plans for disaster risk
reduction and climate change adaptation but also poverty reduction, education and gender.
6. References
1. Assessing the Relationship between Natural Hazards and Poverty: A Conceptual and Methodological
Proposal. Regional Programme on capacity building for sustainable recovery and risk reduction,
United Nations Development Programme, Regional Centre, Bangkok, Thailand, 2009.
2. Assessing the Relationship between Natural Hazards and Poverty: Asia Country and State Case Study
Report. Regional Programme on capacity building for sustainable recovery and risk reduction, United
Nations Development Programme, Regional Centre, Bangkok, Thailand, 2009.
3. DesInventar Server 7 – DesConsultar Analysis and Query Module: User’s Manual, Version 7.0.1,
LaRed and United Nations Development Programme, 2006.
14
4. DesInventar Server 7 – Preliminary Analysis Methodology, Version 7.0.1, LaRed and United Nations
Development Programme, 2006.
5. DesInventar Disaster Inventory System – Methodological guide, Version 8.1.9, OSSO-Group de
Investigación and LaRed, 2009.
6. Poverty line, poverty measurement, monitoring and assessment of MDG in Vietnam. Phung Duc
Tung. General Statistical Office.
/>7. Relationship between natural disasters and poverty: A Fiji case study. United Nations International
Strategy for Disaster Reduction. April 2009.
8. Risk knowledge fundamentals: Guidelines and lessons establishing and institutionalizing disaster loss
databases, United Nations Development Programme, Regional Centre, Bangkok, Thailand, 2009.
9. 2011 Global Assessment Report on Disaster Risk Reduction: Revealing risk, redefining development,
United Nations, 2011.
i
Disaster damage data is collected by Government agencies through a parallel data collection and collation system operated by
the Central Committee for Flood and Storm Control (CCFSC) under the Ministry of Agriculture and Rural Development (MARD)
and by the General Statistics Office (GSO) under the Ministry for Planning and Investment (MPI). The data collected through the
CCFSC system is commonly referred to as the Damage and Needs Assessment system or DANA. Currently under DANA, data is
collected through one template containing more than 150 indicators. This data is collected and collated from the commune up
to the central level.
ii
The software of the Disaster Inventory System or ‘DesInventar’ is an online conceptual and methodological tool for
construction of databases of damage, losses and in general the effects of disasters. It is managed through free, open-source
software, including multi-user, remote data entry and data querying, reporting and analysis. The DesInventar software has been
used in more than sixteen countries and has also been applied for the development of the Global Assessment Report 2009 and
2011. />iii
The 2011 Global Assessment Report on Disaster Risk Reduction (GAR11) highlights the political and economic imperative to
reduce disaster risks, and the benefits to be gained from doing so. Importantly, it offers guidance and suggestions to
governments and nongovernmental actors alike on how they can, together, reduce disaster risks.
/>iv
District disaggregated data in both soft and hard copies were obtained from the Provincial Committee for Flood and Storm
Control. Data was inputted manually in DesInventar using the Data Entry module. District disaggregated data for Quang Binh is
available for the period 1997-2010, with data from 1997 to 2004 coming from disaster damage reports in hard copies while
data from 2005 to 2010 from electronic files in Excel spreadsheet format.
v The food poverty line is calculated as the expenditure required to meet a minimum number of calories needed to ensure good
nutritional status, which is 2100 calories per person per day. The general poverty line is based on the food poverty line but adds
minimum non-food expenditure. These poverty lines are adjusted depending on prices used to estimate expenditure.
vi
Programme 135 started in 1998 with the main objective to implement Government policies targeting the most vulnerable
communes, promoting production and access to basic infrastructure, improving education, training local officials and raising
people's awareness for better living standards and quality of life. The rationale for establishing the programme was to help
people in ethnic minority and mountainous areas overcome poverty, narrow the income gap with other communes in other
districts and provinces and eliminate risks for social instability. It was designed to address different causes of poverty particular
to ethnic minorities such as: low capacity; small landholdings; lack of knowledge, skills and market information; health
problems; large family size; unemployment; and vulnerability to risks (including social problems). The programme was
approved in 1998 for a period of seven years .A second phase was formulated in April 2005 and approved in January 2006 for
the programme to continue until 2010.
vii
Based on CCFSC data
viii
According to the “Climate change and sea level rise scenarios for Vietnam” published by Vietnam Ministry of Natural
Resources and Environment (Hanoi, 2011), the affected areas of storms and tropical cyclones have the tendency to move to the
southern region, numbers of very strong storms are increasing, the storm season seems to last longer (p.24).
ix
Statistical yearbook of Quang Binh Province 2010, posted in Quang Binh official website, accessed in January 2012
/>x
One disaster event in one province affecting a number of districts can be represented by different district datacards as each
datacard represents one particular district or administrative unit reporting on a particular disaster event. A higher number of
datacards can, for example, be more of a reflection of the geographical impact of a type of hazard, e.g. floods, than of the
actual number of hazards affecting the district. Still, the indicator, in terms of datacards, can show trends and patterns. In a
15
global analysis done under the GAR11 study, the average number of datacards per event is 1.2 or almost the same as the
number of events. />xi
In Viet Nam, at all administrative levels, disasters are not always consistently classified under the correct category, according
to CCFSC classification, or by using the internationally recognized terminology. For example the difference between a tropical
depression, storm and typhoon or the difference between a whirlwind (in most cases) and a tornado (not occurring in Viet
Nam) is not always harmonized. In this paper, the disaster type inputted by the district and provincial authorities at the time
the event occurred was utilized, except for clear mistakes where data mining was applied.
xii
In Viet Nam, storms and typhoons are classified with the number of occurrence during that year, and not by any
internationally recognized name.
xiii
Source: Decision 143/2001/QĐ-TTg for the period 2001-2005 and Decision 170/2005/QĐ-TTg for the period 2006-2010.
Decision 143 also sets a threshold for remote mountainous areas at VND80.000. This category was abandoned from 2006
onwards.
xiv
The poverty rate as in figure 4.1 is calculated at the end of each year. Therefore, the closest estimation of the poverty rate in
early 2008 is the figure for 2007.
xv
More frequent disasters in a particular district could also lead to a better preparedness and result in lower impact or even
have a positive impact on poverty by enhancing the capacity of the poor through more frequent and better targeted disaster
risk reduction initiatives. However, districts in Quang Binh are almost evenly affected by disasters, so it is assumed that almost
all districts have equally benefited from disaster risk reduction projects. This has to be further examined.
16