Giám sát của chính phủ và hành vi tìm kiếm trên internet search internet behavior
Bạn đang xem bản rút gọn của tài liệu. Xem và tải ngay bản đầy đủ của tài liệu tại đây (1.06 MB, 53 trang )
Government Surveillance and Internet Search Behavior
Alex Marthews∗
and Catherine Tucker†‡
February 17, 2017
Abstract
This paper displays data from the US and its top 40 trading partners on the search
volume of select keywords from before and after the surveillance revelations of June
2013, to analyze whether Google users’ search behavior changed as a result. The
surveillance revelations are treated as an exogenous shock in information about how
closely users’ internet searches were being monitored by the US government. Each
search term was independently rated for its degree of privacy sensitivity along multiple
dimensions. Using panel data, our results suggest that search terms that were deemed
both personally-sensitive and government-sensitive were most negatively affected by
the PRISM revelations, highlighting the interplay between privacy concerns relating
to both the government and the private individual. Perhaps surprisingly, the largest
‘chilling effects’ were not found in countries conventionally treated as intelligence targets by the US, but instead in countries that were more likely to be considered allies
of the US. We show that this was driven in part by a fall in searches on health-related
terms. Suppressing health information searches potentially harms the health of search
engine users and, by reducing traffic on easy-to-monetize queries, also harms search
engines’ bottom line. In general, our results suggest that there is a chilling effect on
search behavior from government surveillance on the Internet, and that government
surveillance programs may damage the profitability of US-based internet firms relative
to non-US-based internet firms.
Keywords: surveillance, Snowden, privacy, PRISM, chilling effects, search engines, international trade
JEL Classification: D12, D78, E65, F14, H56, M38
∗
Digital Fourth, Cambridge, MA.
MIT Sloan School of Management, MIT, Cambridge MA and National Bureau of Economic Research.
‡
We thank participants at the 2014 Future of Privacy & Data Security Regulation Roundtable, the 2014
Privacy Law Scholars Conference and the 2016 Hackers on Planet Earth conference for useful comments.
We acknowledge funding from the NSF, Law and Economics program at George Mason University and the
Vanguard Charitable Foundation. All errors are our own.
†
1
1
Introduction
On June 6, 2013, new information began to emerge about the surveillance practices of the
US government, starting with the publication of leaked classified documents in the British
‘Guardian’ newspaper. These contained revelations about the ‘PRISM’ program, a codename
for what appears to be a mass electronic surveillance data mining program managed by the
National Security Agency (NSA).The NSA’s slides disclosed partnerships of a kind with nine
major tech companies, including Microsoft, Google, Yahoo!, AOL, Skype and others, for the
NSA to obtain real-time data about US citizens.
The revelations provoked a highly public and ongoing controversy, both from domestic
privacy activists and from international governments concerned about the privacy of their
own citizens. What is not clear is how actual user online behavior changed as a result of the
controversy. Broad surveys of US residents report some ambivalence about the program. An
initial Pew survey conducted in July 2013 suggested that 50% of US citizens approved of the
government phone metadata and Internet data surveillance programs disclosed to that point,
and 44% disapproved of them;1 in a later Pew survey from January 2014, the proportion
disapproving had risen to 53%. A November 2013 survey by the US writers’ organization
PEN shows 28% of its responding members reporting as having self-censored in response to
the surveillance revelations.2 On the firm side, Castro (2013) discusses a survey conducted
by the Cloud Security Alliance, which showed 56 percent of non-US members saying that
they would be less likely to use a US-based cloud computing service as a consequence of the
PRISM revelations.
Unlike this survey-based data already in the public domain, our study aims to be the
1
Pew Research Center, “Few See Adequate Limits on NSA Surveillance Program,But More Approve than Disapprove”, July 26, 2013, available at />few-see-adequate-limits-on-nsa-surveillance-program/, accessed February 17, 2017.
2
“Chilling Effects: NSA Surveillance Drives US Writers to Self-Censor”, PEN American Center, November 12, 2013; available at />Chilling\%20Effects\%20w\%20Color\%20cover-UPDATED.pdf, accessed February 17, 2017.
2
first reasonably comprehensive empirical study to document whether and how actual user
behavior, in terms of the use of search engines, changed after the surveillance revelations
began.3 We examine whether search traffic for more privacy-sensitive search terms fell after
the exogenous shock of publicity surrounding the NSA’s activities. To be clear, we are
not measuring responses to the phenomenon of mass government surveillance per se. Such
surveillance has been conducted for a long time, with varying levels of public scrutiny and
concern. We instead measure the effects of such surveillance activities becoming much more
widely known and understood.
In general, after news spread of what the documents showed, there was much press
discussion about whether the revelations would in fact affect user behavior. On the one
hand, the revelations were of a nature that it might be intuitive to expect some change in
user search behavior within the US, and perhaps also in countries already known to be major
targets of US foreign surveillance, relating to search terms that they expected would be likely
to get them in trouble with the US government, such as, say, ‘pipe bomb’ or ‘anthrax.’ On
the other hand, the argument was also made that people were, or ought already to have been,
aware that the US government conducted surveillance on the Internet, and that they might
therefore already have ‘baked in’ an expectation of such surveillance into their behavior,
making a new effect as a result of these revelations unlikely to be observed (Cohen, 2013).
Last, it is not clear that even if people express concerns that their privacy has been intruded
upon, actual behavioral change will result. It is therefore an empirical question to determine
whether there were in fact such behavioral changes.
To explore this question, we collected data on internet search term volume before and
after June 6, 2013, to see whether the number of searches was affected by the PRISM
revelations. We collected this data using Google Trends, a publicly available data source
3
Though subsequent research papers (Penney, 2016; Cooper, 2017) have reused aspects of our methodology, it is still reasonable to characterize our study as the first to apply empirical techniques to the study of
the actual impact of surveillance on citizen behavior.
3
which has been used in other studies to predict economic and health behaviors (Choi and
Varian, 2012; Carneiro and Mylonakis, 2009). We collected data on the volume of searches
for the US and its top 40 international trading partners during all of 2013 for 245 search
terms.
These 245 search terms came from three different sources: A Department of Homeland
Security list of search terms it tracks on social media sites (DHS (2011), pp. 20-23); a
neutral list of search terms based on the most common local businesses in the US; and
a crowd-sourcing exercise to identify potentially embarrassing search terms that did not
implicate homeland security.
These sources are obviously non-random and are intended to provide an external source
of search terms to study. Having obtained this list, we then employed independent raters to
rank these search terms in terms of how likely their usage was to get the user in trouble with
the US government or with a ‘friend.’ We make this distinction between trouble with the
government and trouble with a friend in the ratings, to try to tease apart the potential for
differences in behavioral responses to privacy concerns emanating from the personal domain
and the public domain. There are different policy implications if users self-censor searches
that they believe may signal potentially criminal behavior, versus if users self-censor searches
that are personally sensitive without any criminal implications. We use these ratings as
moderators in our empirical analysis to understand the different effects of the revelations on
different search terms.
We find that the Google Trends search index fell, for search terms that were deemed
troubling from both a personal and private perspective, by roughly 4% after the revelations.
We check the robustness of these results in a variety of ways, including using different time
windows as a falsification check and using controls for news coverage. We then show that
internationally, the effect was stronger in countries where English is the first language. We
also show that the effect was stronger in countries where surveillance was less acceptable
4
and citizens were less used to surveillance by their government. Perhaps surprisingly, we
found that the largest ‘chilling’ effects were not found in countries traditionally considered
intelligence targets by the US, but instead in countries that were more likely to be considered
allies of the US.
The fact we observe any significant effect in the data is surprising, given skepticism about
whether the surveillance revelations were capable of affecting search traffic at such a macro
level in the countries concerned. First, there is an entire literature on political ignorance and
apathy (Somin, 2016), suggesting that broadly speaking, individuals are poorly informed
about political matters and have few incentives to become better informed. This scandal
could be expected to generate behavioral changes among a minority of politically engaged
people, but, given the low level of information on the part of the public about surveillance
matters, it might easily be considered unlikely to generate meaningful behavioral change
beyond that limited audience. Second, the lack of empirical proof of chilling effects has been
a topic of significant discussion in legal academia,4 so for this audience the very idea of a
study that is able to measure such effects is neither straightforward or intuitive.
This paper aims to contribute to three strands of the academic literature.
The first is an economic literature that aims to measure demand for privacy. Acquisti
et al. (2013) and Brandimarte et al. (2012) use behavioral economics to study what affects
consumer preferences for privacy. Gross and Acquisti (2005) examine demand for privacy
settings on a social network. Goldfarb and Tucker (2012) use refusals to volunteer private
information as a proxy measure for privacy demand, to study inter-generational shifts in
privacy demand. Since we differentiate between user behavior in 41 different countries, we
are able to compare quantitatively the reactions of users in those different countries to the
4
See, for example (Richards, 2013), published immediately before the Snowden revelations, which argues
that though the chilling effects of surveillance are ‘empirically unsupported, [...] such criticisms miss the
point. The doctrines encapsulated by the chilling effect reflect the substantive value judgment that First
Amendment values are too important to require scrupulous proof to vindicate them.’
5
same exogenous shock revealing the collection of their search data by the US government,
and therefore to assess in a novel manner the demand in those countries for privacy in their
search terms.
The second literature measures the effect on consumer behavior of government privacy
policies and practices and their implications for commercial outcomes. Miller and Tucker
(2009) and Adjerid et al. (2015) have shown mixed effects of privacy regulations on the
diffusion of digital health. Romanosky et al. (2008) show mixed effects for data breach
notification laws on identity theft, while Goldfarb and Tucker (2011); Campbell et al. (2015)
document potentially negative effects of privacy regulation for the competitiveness of digital
advertising. To our knowledge, there is little empirical research using observed behavior to
investigate how the policies of governments towards surveillance affect consumer behavior
and commercial outcomes.
The third literature we contribute to is on the privacy paradox. Those who have found
a privacy paradox (Gross and Acquisti, 2005; Barnes, 2006; Athey et al., 2017) identify that
people in practice, when faced with short-term decisions, do not change their information
sharing habits or are not willing to pay even a small amount for the preservation of the
privacy that they articulate as an important value to them; and that similarly, if a service is
offered to them that is privacy-compromising but free, most will opt for it over a service that
carries a fee but that does not compromise privacy. Here, we see that in the actual usage of
a free service, people will shape their searches in order to avoid surveillance.
6
2
Data
2.1
Search Engine Data
Table 1 uses data from the NSA’s PRISM slides on the dates major search engines began to
participate in the PRISM program.5 The three major US search firms - Microsoft, Yahoo!
and Google - are listed as the first three participants, and by the time of the surveillance
revelations of 2013 had been involved with the program for approximately six, five and four
years respectively.
Table 1: PRISM Data Collection Providers
Provider Name PRISM Data Collection Start Date
Microsoft
September 2007
Yahoo!
March 2008
January 2009
June 2009
PalTalk
Dec 2009
YouTube
December 2010
Skype
February 2011
AOL
March 2011
Apple
October 2012
Source: />prism-collection-documents/
The data we use is derived from Google Trends, which is a public source of cross-national
search volume for particular search terms. We focus on data on searches on Google, simply
due to international data availability. Google remains the world’s largest search engine, with
a market share of around 70% at the time of the PRISM revelations. We exploit variation in
the size of its presence in subsequent regressions cross-nationally where we explore differences
in consumer behavior in countries where Google’s search engine presence is less sizable.
Google Trends data has been used in a variety of academic studies to measure how many
5
The extent to which their participation has been active or passive, and the extent to which senior decision
makers at these firms were aware of the firms’ “participation” in PRISM, is still unclear, and is expected to
be clarified in the course of ongoing litigation.
7
people are searching for specific items in order to better inform economic and even health
forecasting (Choi and Varian, 2012; Carneiro and Mylonakis, 2009). The methodology behind
Google Trends is somewhat opaque. Google states that ‘Google Trends analyzes a percentage
of Google web searches to determine how many searches have been done for the terms you
have entered compared to the total number of Google searches done during that time.’
Google also says it excludes duplicate searches and searches made by a few people. The key
disadvantage of the Google Trends data from our perspective is that Google only provides the
data in a normalized format. Google states, ‘Normalized means that sets of search data are
divided by a common variable, like total searches, to cancel out the variable’s effect on the
data. To do this, each data point is divided by the total searches of the geography and time
range it represents, to compare relative popularity. The resulting numbers are then scaled
to a range of 0 to 100.’6 Theoretically, this does not affect the validity of the directional
nature of our results. The key issues come from the fact that the data is not provided in
terms of absolute number of searches, making it harder to project economic outcomes or
enumerate the actual changes to search volumes. However, as there are no alternative data
providers of clickstream data that provide sufficient international scope, we decided to accept
this limitation.
2.2
Search Terms
Prior to collecting this data, we had to identify a list of search terms which would provide
appropriate and reasonable coverage of the kind of search terms that may have been affected
by the PRISM revelation, and also a quasi-control set of search terms. We use search terms
from three sources: A DHS list, a crowdsourced “embarrassing terms” list, and baseline
searches for common local businesses and services.
We use search terms from a US government list (DHS, 2011) of “suspicious” selectors
6
/>
8
that might lead to a particular user being flagged for analysis by the NSA. This is a 2011 list
provided for the use of analysts working in the Media Monitoring Capability section of the
National Operations Center, an agency under the Department of Homeland Security. The
list was made public in 2012, and continued to be used and reproduced within DHS up to
the time of the surveillance revelations (DHS, 2013); as far as we are aware, it remains in
effect. It is therefore the most relevant publicly available document for assessing the kinds
of search terms which the US government might be interested in collecting under PRISM or
under its other programs aimed at gathering Google search data, even though it is focused
on surveillance of social media websites rather than search engines. The full list is in the
appendix as Tables A-1 and A-2.
Our overall aim in establishing a reasonable list of separate personally ‘embarrassing’
search terms was to find terms that would not implicate national security issues of interest
to DHS, or duplicate any term found in that list, but which would still plausibly cause
personal embarrassment if third parties found that you had been searching on them.7 We
crowdsourced this list for this purpose using a group of participants in the Cambridge CoWorking Center, a startup incubator located in Cambridge, MA. The participants were
young (20s-30s), well-educated, and balanced equally between men and women. The full list
of 101 search terms presented in Tables A-3 and A-4 in the appendix is the result of that
crowd-sourcing process.
We also wanted to obtain a list of more “neutral” search terms to use as a quasi-control.We
emphasize that our use of the term ‘quasi-control’ does not mean that our specification should
be thought of as a classic difference-in-difference. Instead, this more neutral set of search
terms should be thought of as simply a group of searches that were plausibly treated less
intensively by the revelations about PRISM.
To find a more neutral set of search terms we turned to the nature of Google as a search
7
We instructed the group to not include obscenities or words relating to obscene acts.
9
engine.8 Users across the world use Google to search for local services and businesses. This
type of search behavior provides a reasonable baseline measure of usage of search engines.
To obtain words to capture this behavior, we first obtained a list of the most common local
businesses in the US based on the North American Industry Classification System.9 We
associated this list with search terms that would plausibly capture these businesses.10
We then collected data on the weekly search volume for each of our 245 search terms
from Google Trends.11 We collected data separately on the volume of searches for the US
and its top 40 international trading partners according to the IMF.12 The top ten in order
are Canada, China, Mexico, Japan, Germany, South Korea, the United Kingdom, France,
Brazil and Saudi Arabia. The remaining 30 are Argentina, Australia, Austria, Belgium,
Colombia, Denmark, Egypt, Hong Kong (treated separately from China), India, Indonesia,
Iran, Israel, Italy, Malaysia, the Netherlands, Nigeria, Norway, Pakistan, the Philippines,
Poland, Russia, Singapore, South Africa, Spain, Sweden, Switzerland, Taiwan, Thailand,
Turkey and the United Arab Emirates. This led to a dataset of 523,340 observations on the
week-country-search term level.
Table 2 provides summary statistics of the distribution of the different search terms and
weekly search volume in our Google Trends data. The value of 0.396 for ‘Crowd-Sourced
8
In earlier versions of this paper, we used data from Google Zeitgeist (www.google.com/zeitgeist) as a
source of potentially neutral words. Since that earlier version, we have greatly expanded the list of countries
we study, rendering Zeitgeist no longer a satisfactory set of controls, because so much of it focused on US
cultural figures such as American football player Aaron Hernandez. This tended to provide a very uneven
baseline of search behavior internationally.
9
Fitness and Recreational Sports Centers (NAICS: 71394), Full-Service Restaurants (72211), Homes for
the Elderly (62331), All Other Amusement and Recreation Industries (71399), Used Merchandise Stores
(45331), Meat Processed from Carcasses (31161), Landscape Architectural Services (54132), Beauty Salons
(81211), Carpet and Upholstery Cleaning Services (56174), and Child Day Care Service (62441).
10
Most categories were straightforward and captured by the search terms: Gym, restaurant, nursing home,
thrift store, butcher, gardener, beauty salon, cleaners, and childcare. For the Amusement and Recreation
industry, we included arcade, movies and weather to capture searches an individual might perform related
to recreation.
11
www.google.com/trends
12
IMF World Economic Outlook Database, available at />2016/02/weodata/index.aspx, accessed February 16, 2017.
10
Embarrassing Term’ indicates that the crowd-sourced embarrassing terms comprise 39.6%
of the dataset. Similarly, the value .555 for ‘DHS Sensitive Search Term’ indicates that DHS
terms comprise 55.5% of the dataset. These summary statistics apply to the 2013 data we
focus on in our analysis, but we also collected data from 2012 that we use in subsequent
falsification checks.
Table 2: Summary Statistics for Google Trends Data
Search Volume
Crowd-Sourced Embarrassing Term
DHS Sensitive Search Term
Neutral
United States
After Prism Revelations
Number of News Stories
2.3
Mean Std Dev
10.19
15.4
0.396
0.49
0.555
0.50
0.0490
0.22
0.0244
0.15
0.577
0.49
18.57
105.5
Min
0
0
0
0
0
0
0
Max Observations
100
522340
1
522340
1
522340
1
522340
1
522340
1
522340
2313
522340
Sensitivity of Search Terms
Though we tried to collect search terms from a diverse set of sources, in order to obtain
a reasonable range of search terms that were neutral, personally sensitive or government
sensitive, it is not clear how an average user would view the privacy sensitivity of each search
term. For example, the DHS list of search terms contains phrases such as “agriculture” which
may not be commonly viewed as a search term which would get you into trouble with the
government or as something that the government may be tracking.13 Furthermore, some
phrases could be both personally sensitive and sensitive in the eyes of the government. For
example, a search term like ‘marijuana legalization’ may be personally embarrassing if friends
took support for legalization as evidence that you used the drug, and may also be viewed as a
13
We may reasonably infer that the US government was monitoring this particular term out of concern
about terrorist attacks on the agricultural supply chain, but the phrase by itself is not evocative of terrorist
threats.
11
search term that could lead to trouble with the US government given marijuana’s continued
illegal status under federal law.
To address this shortcoming and the variation within each list to which each search term
presented a privacy threat, we collected further data to try and establish externally which
of these search terms reflected politically and personally sensitive topics. We asked close to
5,000 workers on Amazon Mechanical Turk to evaluate a single search term each. Each of
our 246 keywords was rated by 20 different Mechanical Turkers.
We set a qualification level such that each worker had to have a ‘Hit Approval Rate (%),’
which is the proportion of tasks they have performed in the task that were approved by
the employer, of greater than 95%, to try to further assure the quality of the workers we
recruited. As it turned out, none of our workers had an approval rating of less than 100%.
We also checked to see if our ratings were altered if we removed workers who took a
shorter or longer time than usual, but did not see any significant effects.
Similar crowdsourcing techniques have been used by Ghose et al. (2012) to design rankings
for search results. Recent research into the composition of workers on Mechanical Turk
has suggested that in general they are reliable and representative for use as subjects in
psychological experiments (Paolacci et al., 2010; Buhrmester et al., 2011). However, we
recognize that in demographics they are likely to skew younger than the average population
(Tucker, 2015).
In the survey, we asked participants to rate a term by how likely it is that it would ‘get
them into trouble’ with their family, their close friends, or with the US government.14 Table
3 reproduces the survey questions we study in this paper. All ratings used a five-point Likert
scale, where 1 reflects the least ‘sensitive’ and 5 reflects the most ‘sensitive’ rating. Table
4 reports the results of this extra step in our search term evaluation process. As might be
14
We also asked them to rate how privacy-sensitive or embarrassing they considered the term, how much
they would like to keep the search secret, and how likely they would be to try and delete their search history
after using this term. In earlier versions of the paper we showed robustness to using these alternative metrics.
12
Table 3: Survey Questions Wording
How
How
How
How
likely
likely
likely
likely
is
is
is
is
it
it
it
it
that
that
that
that
you
you
you
you
would
would
would
would
be
be
be
be
in
in
in
in
trouble
trouble
trouble
trouble
if
if
if
if
the US government found out you used this search term?
your employer found out you used this search term?
a family member found out you used this search term?
a close friend found out you used this search term?
expected, the terms on the DHS list are most likely to be rated as ‘getting you in trouble
with the US government’, at a mean value of 1.62 out of 5; though overall the DHS terms are
not on average rated close to the highest value possible of 5 on the scale because they contain
many apparently innocuous terms, such as “cloud” and “incident.” The search terms from
the ‘embarrassing’ list were rated at a lower sensitivity value of 1.59 in terms of whether
the search would get them into trouble with the U. S. government, but at 1.64 in terms
of getting you in trouble with a friend. The local business terms, which are intended to
be neutral, were, as expected, generally rated the least embarrassing, with mean sensitivity
values ranging between 1.04 and 1.11 out of 5 on all measures. Table A-6 in the appendix
presents cross-index correlations.
Table 4: ‘Trouble’ Rating of Google Search Terms by Source
Trouble
Trouble
Trouble
Trouble
DHS Term
Mean
Employer
1.57
Family
1.42
Friend
1.41
Government
1.62
Embarrassing Term
Mean
1.87
1.71
1.64
1.59
13
Neutral
Mean
1.11
1.06
1.04
1.04
Total
Mean
1.67
1.52
1.49
1.58
2.4
Pre-trends in Data
In our data analysis we treat the PRISM revelations as having occurred on June 6, 2013.15
The US government emphasized in its initial response that the ‘authority [under which
the program falls] was created by the Congress and has been widely known and publicly
discussed.’ (DNI, 2013), but it was not generally understood prior to June 2013 that the authority in question, Section 702 of the FISA Amendments Act of 2008, authorized consumer
data held by such companies, including data on US individuals’ search behavior, to be made
available to the US government on a mass rather than an individualized basis.16 Therefore
we treat the PRISM revelations as an exogenous shock to how informed search engines users
were about the extent to which the US government was monitoring their search behavior.
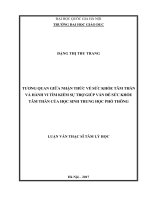
One concern, of course, is whether before the PRISM revelations the search volume for
the different terms were moving in a similar direction. To explore this, we constructed a
figure that explored the extent to which search terms of different types moved in parallel
prior to the revelations.
Figure 1 shows the pre-trends for each of the categories of keywords we study. They show
15
On the morning of June 6, 2013, the ‘Verizon scandal’ also disclosed to the public that phone companies
including Verizon had been ordered by a secret court to continuously disclose the metadata associated with
all calls - location, caller, callee and call duration - subject to a routine renewal every 90 days. Though
we believe that the PRISM revelations are likely to have a more direct causal mechanism when it comes to
search engine behavior, we acknowledge that the multiplicity of revelations on the same date means that we
cannot separately identify the effect of the PRISM and Verizon revelations. We also acknowledge that since
this date, many further scandals have resulted from the same set of leaked documents. However, it seems
appropriate to study the impact of the revelations as a whole, and therefore to begin at the point of initial
disclosure on June 6. Later information also suggested that the NSA might itself, on its disclosed slides, have
been overstating the official nature of its partnerships with the companies named. Further disclosures at later
dates relating to other programs, including Upstream, XKEYSCORE and TEMPORA, could also, for highly
informed users, have further affected their search behavior. However, as our study considers the impact on
search behavior among the general public of the publicization of surveillance, rather than the unpublicized
operation of the programs themselves, we believe these fine-grained distinctions are not material for our
analysis.
16
Freedom of Information Act litigation brought by privacy organization EPIC in 2013-14 would, had it
been successful, have required the release of the Office of Legal Counsel memos containing the interpretation
of Section 702 that authorizes collection under PRISM, but an adverse ruling means that these memos are
still secret. See EPIC v. DOJ, 2013 DC No. 1:13-cv-01848 (BAH), accessed at />doj/olc/prism on April 14, 2015.
14
Figure 1: Evidence of Common Trends Prior to the PRISM Revelations
similar trends.17
One worry is of course that the sensitivity of these metrics changed over the period we
study. To evaluate this, we repeated the ratings exercise two years after the initial Mechanical
Turk measurement exercise in the US, and observed an extremely high correlation between
the two measurement exercises - with a Spearman correlation of 0.95 - and a raw correlation
of 0.88. We also tried running our regression excluding the few search terms whose sensitivity
had changed during the time period - for example, celebrities such as ‘Honey Boo Boo’ who
are no longer as famous as they were in 2013. Our results remained the same.
17
The only notable exception is an uptick in searches for DHS terms in April 2013. This appears to have
been the result of the Boston Marathon bombing, as people searched for information about bombs. As a
result of this uptick, we ran a robustness study where we excluded April 2013 from our data, and obtained
similar results.
15
3
Empirical Analysis
3.1
Model-Free Analysis
Before turning to econometric analysis, we present some ‘model-free’ evidence about major
trends in the data in graph form.
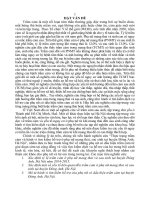
Figure 2: Search Volume Before and After PRISM Revelations
Figure 2 presents our initial analysis where we separate out aggregate search volume
for 2013 before and after the revelations and by whether that search term was rated as
above-median in terms of causing trouble for the searcher with the US government. Overall,
across the 41 countries we study, search terms that were rated as being unlikely to get you
in trouble with the US government exhibited a slight rise in traffic. However, search terms
that were rated as being more likely to get you in trouble with the US government exhibited
a distinct fall in traffic, particularly in the US.
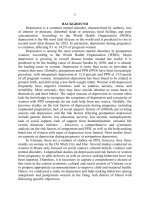
Next, we reran this analysis to compare search traffic in the countries using terms that
16
Figure 3: Search Volume Before and After PRISM Revelations
were rated as having a low level of likelihood that they would lead the user to be in trouble if
a close friend knew about the user’s search (“low-friend”), versus terms that had an abovemedian rating (“high-friend”). As shown by Figure 3, the overall pattern more or less holds:
traffic for low-friend terms holds steady, and traffic for high-friend terms falls, though by less
than in Figure 2 and in a less pronounced manner across the 40 non-US countries that we
collected data for.
17
3.2
Econometric Analysis
The empirical analysis is straightforward. We compare before and after the PRISM revelations with multiple different controls in a panel data setting to see whether there were
measurable shifts in the patterns of search behavior after the revelations relative to before.
This kind of approach has been described as ‘regression discontinuity’ in Busse et al. (2006),
which examines changes around a short time window surrounding a policy change. However, we recognize that in papers which use the exact timing of a particular event as their
discontinuity, rather than some arbitrary exogenous threshold, identification is always going
to be weaker than in a more standard regression discontinuity (Hahn et al., 2001).
We model the search volume rate SearchV olumeijt for search term i in country j on
week t in the following manner:
SearchV olumeijt = βT roubleCategoryi × Af terP rismt
+γi + θj + δt +
(1)
i
γ is a series of fixed effects for each of our 245 keywords, θj is a series of fixed effects
for each country, and δt is a series of fixed effects at the weekly level. The fixed effects
γ control for the different natural levels of search volume for each of the different search
terms. θj captures general differences in search volume across countries. δt captures weekby-week variation in search term volume that may be driven by work patterns or holidays.
This means that our major coefficient of interest is β, which measures the differential in
search volume for keywords that were more sensitive for this measure after the PRISM
revelations. The main effect of Af terP rism is collinear with the weekly fixed effects and is
consequently dropped from our regressions. Similarly, our variable categorizing the search
term according its ‘trouble index’, T roubleCategoryi , is collinear with the keyword fixed
18
effects and is consequently dropped from the regression.
Table 6 presents our initial results for our weekly data over the period January 1, 2013
to December 31, 2013. The first three columns focus on a specification where we categorize
our data based on median splits of the various trouble ratings.18
In particular, we isolate search terms which are above-median only in terms of ‘getting
you into trouble’ with a friend (10% of the sample), search terms that are above-median only
in terms of ‘getting you into trouble with the government’ (12% of the sample), and search
terms which are above-median in terms of both forms of trouble (44% of the sample). Table
5 summarizes the average Likert-scale ratings for each of these categories and indicates that
the above-median words on both scales were on average by far viewed as the most likely
terms both for getting you into trouble with the US government and with a friend.
Table 5: ‘Trouble’ Rating of Google Search Terms by Trouble Categorization
No Trouble
Mean
Trouble Friend
1.17
Trouble Government
1.20
Gov Trouble
Mean
1.28
1.65
Friend Trouble
Mean
1.57
1.29
All Trouble Total
Mean
Mean
1.77
1.49
1.93
1.58
Column (1) of Table 6 presents results for the US for the interaction between the indicator
for the post PRISM revelations and these different classes of words. It suggests that there is a
negative effect for the words that are perceived as having an above-median chance of getting
you both into trouble with the US government and a friend. However, there is no negative
effect for words which are perceived as troublesome in just a single dimension. This may
be because of there being fewer words in these categories. However, it may also reflect the
fact that, as shown in Table 5, the words that are above-median for both friend trouble and
government trouble, are on average perceived as far more likely to provoke trouble with the
18
In earlier versions of the paper we used the full indices rather than median splits, and obtained similar
results.
19
US government. The point estimate suggests a decrease of approximately one index point
from the baseline of 25 index points for these types of searches, or a four percent decrease in
total for these words that are perceived as the most potentially troublesome. Overall, this
provides empirical evidence that the surveillance revelations caused a substantial chilling
effect relating to users’ willingness to enter search terms that raters considered would get
you into trouble with the US government or with a friend.
Column (2) of Table 6 presents results where we demarcate the after PRISM period
into both the first quarter and the second quarter after the PRISM revelations. This result
suggests that the effect was the most pronounced in the first quarter after the PRISM
revelations, but that it also persisted afterwards.
Column (3) of Table 6 examines whether there is any kind of pre-trend in the data looking
at the previous month as an alternative ‘Fake PRISM’ start time. The coefficient for the
placebo dummy for the month prior to the PRISM revelations is not significant. This again
suggests there is no evidence of a measurable pre-trend in the data.
A natural concern is whether other factors could plausibly have shifted user behavior in
early June relating to these specific keywords. However, the keywords cover a large variety
of topics and a large variety of jurisdictions, so another news story relating to a small portion
of them, such as an extreme weather event (for the DHS search terms) or a change in laws
relating to childcare provision (for the local businesses terms) is unlikely to have shifted
behavior for the whole. To address this and tie the effect more closely to the actual PRISM
revelations, we tried to establish whether our finding was robust to a narrower time window,
so we reran the analysis using only data from five weeks before and five weeks after the first
surveillance revelations on June 6, 2013. Column (4) of Table 6 presents results where we
just look a shorter ten-week window around the PRISM revelations. The estimate of the
negative effect is slightly larger.
We also tried to rule out seasonality as being a driver of our results by repeating the
20
Table 6: In the US there was a decline in searches that were perceived as getting the searcher
in trouble both with a friend and the US government
After Prism × Gov Trouble
After Prism × Friend Trouble
After Prism × All Trouble
Base
(1)
0.0863
(0.290)
0.480
(0.354)
-0.942∗∗
(0.313)
Quarter After Prism × Gov Trouble
Longer Period
(2)
Shorter Period 2013
(4)
0.391
(0.704)
0.128
(0.652)
-1.460∗∗
(0.482)
2012
(5)
0.118
(0.592)
1.376
(0.945)
-1.374∗∗
(0.507)
0.0815
(0.294)
0.342
(0.339)
-0.875∗∗
(0.319)
Quarter After Prism × Friend Trouble
Quarter After Prism × All Trouble
Second Quarter After Prism × Gov Trouble
Second Quarter After Prism × Friend Trouble
Second Quarter After Prism × All Trouble
After Fake Prism × Gov Trouble
After Fake Prism × Friend Trouble
After Fake Prism × All Trouble
Keyword Fixed Effects
Week Fixed Effects
Observations
R-Squared
Pre-Trend
(3)
-0.00408
(0.321)
0.518
(0.396)
-0.943∗
(0.355)
Yes
Yes
12740
0.925
Yes
Yes
12740
0.925
-0.497
(0.429)
0.208
(0.536)
-0.00887
(0.463)
Yes
Yes
12740
0.925
Yes
Yes
2695
0.958
OLS Estimates. Dependent Variable Is Search Volume Index As Reported By Google Trends.
Weekly data over the period January 1, 2013 to December 31, 2013 in Columns (1)-(3). Weekly data for
the ten week period around the revelations in Column (4). Weekly data for the same ten week period in
2012 in Column (5)
Robust Standard Errors Clustered At Search Term Level. + p < 0.10, ∗p < 0.05, ∗ ∗ p < 0.01, ∗ ∗ ∗p < 0.001.
The main effects of Af terP rism and the trouble category ratings are collinear with the week and keyword
fixed effects and consequently both terms are dropped from the regression.
analysis of Column (4), using exactly the same June date but a year earlier in 2012. Column (5) of Table 6 repeats the analysis of Column (4) for 2012 to explore whether there
are commonly such extreme drops, in these kind of searches perhaps as a result of seasonal
variation. However, it finds no measurable effect. All the coefficients are reassuringly insignificant. This suggests that it is not seasonality brought about by comparing late spring
21
0.492
(0.498)
0.742
(0.574)
0.336
(0.457)
Yes
Yes
2695
0.967
with summer that is driving our results.
The results of Table 6, and in particular the fact that the negative effect of the PRISM
revelations on searches is most pronounced around the time of revelations, raises the question
of the extent to which this was driven simply by ongoing publicity surrounding the changes
rather than a response to the information itself.
Table 7: Robustness Checks for the US Results to News Coverage
After Prism × Gov Trouble
After Prism × Friend Trouble
After Prism × All Trouble
Gov Trouble × Number of News Stories
Friend Trouble × Number of News Stories
All Trouble × Number of News Stories
News Effects
(1)
-0.0322
(0.335)
0.123
(0.395)
-0.690+
(0.360)
0.000189
(0.000299)
0.000569
(0.000483)
-0.000401
(0.000317)
News+Short
(2)
0.433
(1.811)
-1.160
(1.159)
-2.352∗
(1.094)
-0.0000316
(0.00101)
0.000974
(0.000713)
0.000674
(0.000624)
Log News+Short
(3)
2.272
(4.604)
-6.291
(3.833)
-5.474+
(3.146)
Gov Trouble × Log News Stories
-0.252
(0.576)
Friend Trouble × Log News Stories
0.861+
(0.514)
All Trouble × Log News Stories
0.538
(0.407)
Keyword Fixed Effects
Yes
Yes
Yes
Week Fixed Effects
Yes
Yes
Yes
Observations
12740
2695
2695
R-Squared
0.925
0.958
0.958
OLS Estimates. Dependent Variable Is Search Volume Index As Reported By Google Trends.
Weekly data over the period January 1, 2013 to December 31, 2013 in Column (1). Weekly data for
ten-week window reported in Columns (2) and (3)
Robust Standard Errors Clustered At Search Term Level. + p < 0.10, ∗p < 0.05, ∗ ∗ p < 0.01, ∗ ∗ ∗p < 0.001.
The main effects of Af terP rism and the trouble category ratings are collinear with the week and keyword
fixed effects and consequently both terms are dropped from the regression.
To explore this, we gathered data from Factiva on the number of news stories in each
country which mentioned the NSA and Edward Snowden. We use this data as a proxy
for how extensive news coverage was in that country and in that week. Table 7 shows our
results, which reflect this additional robustness check. Our earlier results hold, though the
22
introduction of these additional controls appear to introduce suggesting that the change we
measure is not media-driven. Column (1) presents results for the full span of 2013. Column
(2) presents results for the shorter window. Our results suggest that especially in the shorter
period, the behavior we measure is not driven by news coverage.
Column (3) of Table 7 presents the results of using a logged measure to capture news
coverage to potentially control for the role of extreme values. However, we caution that
zeroes in our dataset are very prevalent.19 67.87% of our weeks did not have news stories
concerning the PRISM revelations, so the log specification may be limited here. In general,
news coverage seems to be negatively related to overall search volume, though none of our
estimates are precisely estimated.
Another concern is whether the particular definition or the approach we took to the
Mechanical Turk survey measures drove the results of Table 6. Table 8 investigates the
robustness of our measures to different survey measures. One concern is that the categorization displayed in Table 5 into ‘only friend trouble’ ‘only government trouble’ and ‘all trouble’
drove the results. To investigate this, Column (1) of Table 8 presents the results of a simpler
specification where we compare the results of an indicator for above-median ratings in the
‘trouble with a friend category’ and an indicator for above-median ratings in the ‘trouble
with the government’ category, with no attempt to account between the potential overlap
between the two. The results are similar to before, but we measure a negative effect for each
indicator.
Column (2) of Table 8 investigates our results when we look at extreme values of the
scale ratings: In this case, whether or not the rating was in the top decile. We observe a
large and negative effect for the top decile of government trouble ratings, but do not observe
an effect for the top decile of friend trouble ratings.
Another related concern is that our findings might be an artifact of the particular sensi19
We dealt with this issue by simply adding 0.5 to all news metrics so that the log of news is measurable.
23
Table 8: Robustness Checks for the US Results (Alternative Definitions)
Post Prism × High Friend Trouble
Post Prism × High Gov Trouble
Two Categories
(1)
-0.348+
(0.189)
-0.631∗
(0.264)
After Prism × Top Decile Friend
Extreme Values
(2)
Employer Trouble
(3)
0.532
(0.445)
-1.316∗
(0.535)
After Prism × Top Decile Gov
-1.407∗∗
(0.439)
-0.0117
(0.392)
-0.688∗
(0.290)
After Prism × Gov Trouble
After Prism × Employer Trouble
After Prism × All Trouble
-0.697∗
(0.301)
0.598+
(0.319)
-0.689∗
(0.322)
After Prism × Gov Trouble
After Prism × Family Trouble
After Prism × All Trouble
High Friend
High Gov
Keyword Fixed Effects
Week Fixed Effects
Observations
R-Squared
Family Trouble
(4)
58.18∗∗∗
(1.049)
-39.94∗∗∗
(1.068)
Yes
Yes
12740
0.925
Yes
Yes
12740
0.925
Yes
Yes
12740
0.925
Yes
Yes
12740
0.925
OLS Estimates. Dependent Variable Is Search Volume Index As Reported By Google Trends.
Weekly data over the period January 1, 2013 to December 31, 2013
Robust Standard Errors Clustered At Search Term Level. + p < 0.10, ∗p < 0.05, ∗ ∗ p < 0.01 ∗ ∗ ∗ p < 0.001.
The main effects of Af terP rism and the trouble category ratings are collinear with the week and keyword
fixed effects and consequently both terms are dropped from the regression.
tivity factors we decided to focus on; that is, whether the person felt that the use of such a
search term might get them into trouble with either the government or a friend. We chose
this distinction as it was a clear contrast between the personal and governmental domain
when it came to privacy sensitivity, but we wanted to check that there was not something
about the use, for example, of the term ‘friend’ that drove our results. Columns (3) and
(4) of Table 8 investigates what happens when we use alternative measures of the ‘personal’
24
dimension of privacy, namely trouble with an employer and trouble with a family member.
In both cases, we see a negative effect for the government trouble rating, and a somewhat
smaller negative effect for words that were rated highly for both government trouble and
trouble with the employer or family member. We speculate that the discrepancy in the
results could be explained by Turkers rating ‘time-wasting’ searches highly in terms of likely
employer trouble.20
One final concern is that Google could have strategically adjusted its algorithm so as to
give less prominence to search results for a particular search term, in a manner that was
contemporaneous with publicity about PRISM. This would affect clicks, but not the prior
likelihood of a person entering a given search term. A deeper concern is that Google may
have adjusted its search algorithm as a result of the search revelations, and in particular that
the change in algorithm meant that people were more or less likely to search subsequently
again for a different search term after the first set of search results failed to produce the
results they were seeking. For example, it could be that the first search for ‘pipe bomb’
was rendered intentionally less informative, and so people searched again. To examine for
this possibility, we went to Google Correlate, a Google database that allows a researcher to
see what search terms are temporally correlated with a particular search term. We looked
at the correlates of search terms for a random subsample of ten of the search terms in our
data. The idea is that if the algorithm changed, we should see a difference in its accuracy,
as reflected by how many times a Google users searches again as they were not able to find
the result they were looking for. We could not see any pattern, however, that suggested a
change in what search terms were used as substitutes for each other in June 2013, which
would be suggestive of a change in the Google algorithm. As a final check, we also used a
‘bounce back’ metric, which measures whether or not a user searches again after performing
20
As discussed by Acquisti and Fong (2013), an employer’s relationship with a employee and use of personal
data to shape that relationship is a new challenge for privacy policy in the internet era.
25