Tài liệu -Financial-Statement-Analysis pptx
Bạn đang xem bản rút gọn của tài liệu. Xem và tải ngay bản đầy đủ của tài liệu tại đây (466.5 KB, 51 trang )
Financial Statement Analysis Methods: Horizontal vs. Vertical Analysis
Introduction
Financial statement information is used by both external and internal users, including investors,
creditors, managers, and executives. These users must analyze the information in order to
make business decisions, so understanding financial statements is of great importance. Several
methods of performing financial statement analysis exist. This article discusses two of these
methods: horizontal analysis and vertical analysis.
Horizontal Analysis
Methods of financial statement analysis generally involve comparing certain information. The
horizontal analysis compares specific items over a number of accounting periods. For example,
accounts payable may be compared over a period of months within a fiscal year, or revenue
may be compared over a period of several years. These comparisons are performed in one of
two different ways.
Absolute Dollars
One method of performing a horizontal financial statement analysis compares the absolute
dollar amounts of certain items over a period of time. For example, this method would compare
the actual dollar amount of operating expenses over a period of several accounting periods.
This method is valuable when trying to determine whether a company is conservative or
excessive in spending on certain items. This method also aids in determining the effects of
outside influences on the company, such as increasing gas prices or a reduction in the cost of
materials.
Percentage
The other method of performing horizontal financial statement analysis compares the
percentage difference in certain items over a period of time. The dollar amount of the change is
converted to a percentage change. For example, a change in operating expenses from $1,000 in
period one to $1,050 in period two would be reported as a 5% increase. This method is
particularly useful when comparing small companies to large companies.
(1050 – 1000)/1000 X 100 = 5%
Vertical Analysis
Qazi Ashfaq | Financial Statement Analysis 1
The vertical analysis compares each separate figure to one specific figure in the financial
statement. The comparison is reported as a percentage. This method compares several items to
one certain item in the same accounting period. Users often expand upon vertical analysis by
comparing the analyses of several periods to one another. This can reveal trends that may be
helpful in decision making. An explanation of Vertical analysis of the income statement and
vertical analysis of the balance sheet follows.
Income Statement
Performing vertical analysis of the income statement involves comparing each income
statement item to sales. Each item is then reported as a percentage of sales. For example, if
sales equals $10,000 and operating expenses equals $1,000, then operating expenses would be
reported as 10% of sales.
1000/10,000 X 100 = 10%
Balance Sheet
Performing vertical analysis of the balance sheet involves comparing each balance sheet item to
total assets. Each item is then reported as a percentage of total assets. For example, if cash
equals $5,000 and total assets equals $25,000, then cash would be reported as 20% of total
assets.
References
Edmonds, C., Edmonds, T., Olds, P., & Schneider, N. (2006). "Fundamental Managerial
Accounting Concepts." 3rd ed. New York: McGraw-Hill Irwin.
Qazi Ashfaq | Financial Statement Analysis 2
Session 1: Vertical and Horizontal Analysis Technique
Session Learning Outcomes
Learners will understand and be appreciative on the use of the horizontal
and vertical analysis technique while analyzing the financial statements
information, its application and interpretation.
Important Learning Terms
• Financial analysis
• Horizontal financial statements analysis
• Vertical financial statements analysis
• Cross sectional financial statement analysis
Introduction
Financial analysis: is a process which involves reclassification and
summarization of information through the establishment of ratios and
trends.
Analysis of financial statement: Refers to the examination of the statements
for the purpose of acquiring additional information regarding the activities of
the business.
The users of the financial information often find analysis desirable for the
interpretation of the firm’s activities.
Note: The financial statement to be used for the purpose of analysis should
be the audited ones. The audited financial statements give the analyst the
auditor’s statement as to whether the records represent a fair view of the
company’s affairs.
The Objectives of Financial Statement Analysis
The overall objective of financial statement analysis is the examination of a
firm’s financial position and returns in relation to risk. This must be done
with a view to forecasting the firm’s future prospective.
For the purpose of understanding, the following financial statements will be
used.
Qazi Ashfaq | Financial Statement Analysis 3
A: Horizontal Financial Statement Analysis
This technique is also known as comparative analysis.
It is conducted by setting consecutive balance sheet, income statement or
statement of cash flow side-by-side and reviewing changes in individual
categories on a year-to-year or multiyear basis. The most important item
revealed by comparative financial statement analysis is trend.
A comparison of statements over several years reveals direction, speed and
extent of a trend(s). The horizontal financial statements analysis is done by
restating amount of each item or group of items as a percentage.
Qazi Ashfaq | Financial Statement Analysis 4
Such percentages are calculated by selecting a base year and assign a
weight of 100 to the amount of each item in the base year statement.
Thereafter, the amounts of similar items or groups of items in prior or
subsequent financial statements are expressed as a percentage of the base
year amount. The resulting figures are called index numbers or trend ratios.
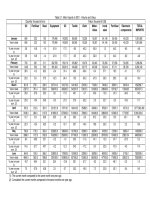
From the balance sheet statement in exhibit 1. The following indexed
balance sheet can be established.
As basis of Analysis, the analyst may seek variables which seem to improve
or deteriorate and bring a challenge to the stakeholders in their various
decisions. Example from the previous table one can ask the following
questions?
• Why is there an increase in the stock of the company? Has the
company changed its inventory policy?
• Why did taxation increase so tremendously? Were there any changes
in taxation? Is it reflected by the increase in sales? Profit?
Qazi Ashfaq | Financial Statement Analysis 5
• Why is there an increase in the fixed assets and at the same time
decrease in the long-term debt? How were these assets financed?
• And many more question which can be elaborated by the management
or which can be used as the basis for discussions.
Individual Assignment 1:
From the Exhibit 1, prepare horizontal analysis for the income statement of
TeleTalk (T) Ltd and comment on the relevant changes. Associate the
comments from the balance sheet and income statement you have
established, what is your general comment on the company undertakings in
the past three years of operation.
B: Vertical/Cross-Sectional/Common Size Analysis Techniques
Vertical/Cross-sectional/Common size statements came from the problems
in comparing the financial statements of firms that differ in size.
• In the balance sheet, for example, the assets as well as the liabilities
and equity are each expressed as a 100% and each item in these
categories is expressed as a percentage of the respective totals.
• In the common size income statement, turnover is expressed as 100%
and every item in the income statement is expressed as a percentage
of turnover (sales).
Qazi Ashfaq | Financial Statement Analysis 6
From the vertical analysis above, an analyst can compare the percentage
mark-up of asset items and how they have been financed. The strategies
may include increase/decrease the holding of certain assets. The analyst
may as well observe the trend of the increase in the assets and liabilities
over several years.
Example: It can be observed that there is an increase in the holding of the
current assets of the company. The management can seek the reasons of
why the holding of these assets is continuing increasing.
Exercise 2:
From the Exhibit 1, prepare vertical analysis for the income
statement of TeleTalk (T) Ltd and comment on the relevant changes.
Associate the comments from the balance sheet and income
statement you have established, what is your general comment on
the company undertakings in the past three years of operation.
Qazi Ashfaq | Financial Statement Analysis 7
Financial Analysis revised
Page 8 of 54 pages. Chapter: 17: Module 3.4: Sensitivity Analysis of ICT Invest
Session 1: Building a Financial Analysis Model for ICT
Session Learning Outcome
The purpose of this session is to show how the different variables studied in this
course and other courses can affect the analysis of a project. In actual undertakings
of projects, there are micro and micro variables which affect overall project analysis.
Introduction
Sensitivity Analysis (SA) is the study of how the variation in the output of a model
(numerical or otherwise) can be apportioned, qualitatively or quantitatively, to
different sources of variation.
Sensitivity Analysis (SA) aims to ascertain how the model depends upon the
information fed into it, upon its structure and upon the framing assumptions made to
build it. This information can be invaluable, as:
• Different level of acceptance (by the decision-makers and stakeholders) may be
attached to different types of uncertainty.
• Different uncertainties impact differently on the reliability, the robustness and
the efficiency of the model.
Sensitivity analysis is also referred to as “what if analysis”
Building Financial Analysis Model
Several activities can be considered in building financial analysis model. In the
building of the financial model the following have to be considered:
1. Conservative estimations of the revenues/benefits
This is helpful to ensure that the viability of the proposed project is not easily
threatened by unfavorable circumstances. The capital budgeting should be done
in a such a way that it has a build in system for conservative estimations. The
revenue figures should be justifiable given the capital expenditure proposals.
2. Safety Margin Cost figures
A margin of safety for the cost items should be estimated. He margin can be
between 10% -30%. For instance, in estimation of installation costs of a
wireless telephone system, 10%-30% of the normal installation costs can be
added. The management can decide on the percentages in the cost estimation
of various items depending on the experience and other firm considerations.
3. Flexible Investment yardsticks
Qazi Ashfaq | Financial Statement Analysis 8
Cutting point for the investments can be changed considerably to allow more
room for seeing beyond the normal cut-off points. Example if the policy of a
company is to accept the projects with payback period of less than three years,
the use of a prolonged period can be assessed to determine the impact thereto.
4. Calculating the Overall risk index
Some projects may call for the calculation of the overall risk index for various
project components. These cutoff points may be based on sales, prices,
operating cots, etc.
The company may vary all the items by 62% favorable, given the risks index
consideration.
5. Judgment on Three point estimation
Telecommunication companies may judge their operations on three point
estimation based on the hours of access as follows:
o Business (peak) hours
E.g. From 0800hrs – 1800hrs
o Evening/Morning (off-peak) hours
E.g. from 0600hrs – 0800 hrs and from 1800hrs – 2200hrs.
o Night Hours
E.g 2200hrs-0600hrs
Various interconnection and charging rates are considered between three
different times as indicated above. Reasons may be due to the fact that the use
of bandwidth (which is paid even if not consumed) varies from the three time
zones indicated above.
Other considerations may be backed on the market responses and returns. The
returns for this case may be classified as:
• Most pessimistic
• Most likely
Qazi Ashfaq | Financial Statement Analysis 9
Session 2: Ratio Analysis Techniques
Session Learning Outcome
Learners will understand and be appreciative on the use of the time series
analysis technique while analysing the financial statements information, its
application and interpretation
Important Learning Terms
• Ratio
• Types of Ratios
• Liquidity Ratios
• Asset management/Activity ratios
• Financial Leverage/Gearing ratios
• Profitability ratios
• Market valuation ratios
• Ratio limitations
A ratio: Is the mathematical relationship between two quantities in the form
of a fraction or percentage.
Ratio analysis: is essentially concerned with the calculation of relationships
which after proper identification and interpretation may provide information
about the operations and state of affairs of a business enterprise.
The analysis is used to provide indicators of past performance in terms of
critical success factors of a business. This assistance in decision-making
reduces reliance on guesswork and intuition and establishes a basis for
sound judgement.
Note: A ratio on its own has little or no meaning at all.
Consider a current ratio of 2:1. This means that for every 1 monetary value
of current liabilities there are 2 of assets. However each business is different
and each has different working capital requirements. From this ratio, we
cannot make any comments about the liquidity of the business, whether it
carries too much or too little working capital.
Qazi Ashfaq | Financial Statement Analysis 10
Significance of Using Ratios
The significance of a ratio can only truly be appreciated when:
1. It is compared with other ratios in the same set of financial
statements.
2. It is compared with the same ratio in previous financial statements
(trend analysis).
3. It is compared with a standard of performance (industry average).
Such a standard may be either the ratio which represents the typical
performance of the trade or industry, or the ratio which represents the
target set by management as desirable for the business.
Types of Ratios
Note that throughout this section, ratios are derived from Exhibit one in
Session 1 of this chapter
A: Liquidity Ratios
• Liquidity refers to the ability of a firm to meet its short-term financial
obligations when and as they fall due.
• The main concern of liquidity ratio is to measure the ability of the firms
to meet their short-term maturing obligations. Failure to do this will
result in the total failure of the business, as it would be forced into
liquidation.
Current Ratio
The Current Ratio expresses the relationship between the firm’s current
assets and its current liabilities.
Current assets normally includes cash, marketable securities, accounts
receivable and inventories. Current liabilities consist of accounts payable,
short term notes payable, short-term loans, current maturities of long term
debt, accrued income taxes and other accrued expenses (wages).
The rule of thumb says that the current ratio should be at least 2, that is the
current assets should meet current liabilities at least twice.
What does the calculated ratio tells us? In 2000, the company only had 85
Qazi Ashfaq | Financial Statement Analysis 11
cents worth of current assets for every dollar of liabilities. This grew to 92
cents in 2002 indicating increasing trend on liquidity, however the company
is still unable to support its short-term debt from its currents assets.
Quick Ratio
Measures assets that are quickly converted into cash and they are compared
with current liabilities. This ratio realizes that some of current assets are not
easily convertible to cash e.g. inventories.
The quick ratio, also referred to as acid test ratio, examines the ability of the
business to cover its short-term obligations from its “quick” assets only (i.e.
it ignores stock). The quick ratio is calculated as follows
insert
Clearly this ratio will be lower than the current ratio, but the difference
between the two (the gap) will indicate the extent to which current assets
consist of stock.
B: Asset Management/Activity Ratios
If a business does not use its assets effectively, investors in the business
would rather take their money and place it somewhere else. In order for the
assets to be used effectively, the business needs a high turnover.
Unless the business continues to generate high turnover, assets will be idle
as it is impossible to buy and sell fixed assets continuously as turnover
changes. Activity ratios are therefore used to assess how active various
assets are in the business.
Note: Increased turnover can be just as dangerous as reduced turnover if
the business does not have the working capital to support the turnover
increase. As turnover increases more working capital and cash is required
and if not, overtrading occurs.
Asset Management ratios are discussed next.
Average Collection Period
The average collection period measures the quality of debtors since it
indicates the speed of their collection.
• The shorter the average collection period, the better the quality of
debtors, as a short collection period implies the prompt payment by
debtors.
• The average collection period should be compared against the firm’s
credit terms and policy to judge its credit and collection efficiency.
Qazi Ashfaq | Financial Statement Analysis 12
• An excessively long collection period implies a very liberal and
inefficient credit and collection performance.
• The delay in collection of cash impairs the firm’s liquidity. On the other
hand, too low a collection period is not necessarily favourable, rather it
may indicate a very restrictive credit and collection policy which may
curtail sales and hence adversely affect profit.
Inventory Turnover
This ratio measures the stock in relation to turnover in order to determine
how often the stock turns over in the business.
It indicates the efficiency of the firm in selling its product. It is calculated by
dividing he cost of goods sold by the average inventory.
The ratio shows a relatively high stock turnover which would seem to
suggest that the business deals in fast moving consumer goods.
• The company turned over stock every 24 days in 2000 and every 28
days in 2002.
• The trend shows a marginal increase in days which indicates a slow
down of stock turnover.
Qazi Ashfaq | Financial Statement Analysis 13
• The high stock turnover ratio would also tend to indicate that there
was little chance of the firm holding damaged or obsolete stock.
Total Assets Turnover
Asset turnover is the relationship between sales and assets
• The firm should manage its assets efficiently to maximise sales.
• The total asset turnover indicates the efficiency with which the firm
uses all its assets to generate sales.
• It is calculated by dividing the firm’s sales by its total assets.
• Generally, the higher the firm’s total asset turnover, the more
efficiently its assets have been utilised.
Fixed Asset Turnover
The fixed assets turnover ratio measures the efficiency with which the firm
has been using its fixed assets to generate sales.
It is calculated by dividing the firm’s sales by its net fixed assets as follows:
• Generally, high fixed assets turnovers are preferred since they indicate
a better efficiency in fixed assets utilisation.
From the above calculations:
• It appears that the activity of the business is relatively constant, with
a slight upward trend.
• The ratio also confirms that the business places a much greater
reliance on working capital than it does on the fixed assets as the fixed
assets (2001 and 2002) turned over more quicker than stock turnover.
C: Financial Leverage (Gearing) Ratios
Qazi Ashfaq | Financial Statement Analysis 14
• The ratios indicate the degree to which the activities of a firm are
supported by creditors’ funds as opposed to owners.
• The relationship of owner’s equity to borrowed funds is an important
indicator of financial strength.
• The debt requires fixed interest payments and repayment of the loan
and legal action can be taken if any amounts due are not paid at the
appointed time. A relatively high proportion of funds contributed by
the owners indicates a cushion (surplus) which shields creditors
against possible losses from default in payment.
Note: The greater the proportion of equity funds, the greater the
degree of financial strength. Financial leverage will be to the
advantage of the ordinary shareholders as long as the rate of earnings
on capital employed is greater than the rate payable on borrowed
funds.
The following ratios can be used to identify the financial strength and
risk of the business.
Equity Ratio
The equity ratio is calculated as follows:
This indicates that only 32.1% of the total assets in 2002 is supplied by the
ordinary stockholders and this has shown a slight decrease from 32.8% in
2000.
• A high equity ratio reflects a strong financial structure of the company.
A relatively low equity ratio reflects a more speculative situation
because of the effect of high leverage and the greater possibility of
financial difficulty arising from excessive debt burden.
Debt Ratio
This is the measure of financial strength that reflects the proportion of
capital which has been funded by debt, including preference shares.
This ratio is calculated as follows:
Qazi Ashfaq | Financial Statement Analysis 15
With higher debt ratio (low equity ratio), a very small cushion has developed
thus not giving creditors the security they require. The company would
therefore find it relatively difficult to raise additional financial support from
external sources if it wished to take that route. The higher the debt ratio the
more difficult it becomes for the firm to raise debt.
Debt to Equity ratio
This ratio indicates the extent to which debt is covered by shareholders’
funds. It reflects the relative position of the equity holders and the lenders
and indicates the company’s policy on the mix of capital funds. The debt to
equity ratio is calculated as follows:
• The debt to equity ratio shows that for every 1 dollar of shareholders
funds in 2002 there was 2.12 dollars of debt. This compares to 2.05
dollars in 2000. This ratio is extremely high and indicates the financial
weakness of the business.
Times Interest Earned Ratio
This ratio measure the extent to which earnings can decline without causing
financial losses to the firm and creating an inability to meet the interest cost.
• The times interest earned shows how many times the business can
pay its interest bills from profit earned.
• Present and prospective loan creditors such as bondholders, are vitally
interested to know how adequate the interest payments on their loans
are covered by the earnings available for such payments.
• Owners, managers and directors are also interested in the ability of
the business to service the fixed interest charges on outstanding debt.
The ratio is calculated as follows:
Qazi Ashfaq | Financial Statement Analysis 16
• The company’s major forms of credit are non-interest bearing (trade
creditors) which results in the business enjoying very healthy interest
coverage rates. In 2002 the company could pay their interest bill 16.5
times from earnings before interest and tax. However this is a massive
drop from 51.5 times in 2001 and 37.7 times in 2000.
D: Profitability Ratios
Profitability is the ability of a business to earn profit over a period of time.
Although the profit figure is the starting point for any calculation of cash
flow, as already pointed out, profitable companies can still fail for a lack of
cash.
Note: Without profit, there is no cash and therefore profitability must be
seen as a critical success factors.
• A company should earn profits to survive and grow over a long period
of time.
• Profits are essential, but it would be wrong to assume that every
action initiated by management of a company should be aimed at
maximising profits, irrespective of social consequences.
The ratios examined previously have tendered to measure management
efficiency and risk.
Profitability is a result of a larger number of policies and decisions. The
profitability ratios show the combined effects of liquidity, asset management
(activity) and debt management (gearing) on operating results. The overall
measure of success of a business is the profitability which results from the
effective use of its resources.
Gross Profit Margin
• Normally the gross profit has to rise proportionately with sales.
• It can also be useful to compare the gross profit margin across similar
businesses although there will often be good reasons for any disparity.
Qazi Ashfaq | Financial Statement Analysis 17
• The ratio above shows the increasing trend in the gross profit since the
ratio has improved from 15.2% in 2000 to 20.3% on 2002. This
indicates that the rate in increase in cost of goods sold are less than
rate of increase in sales, hence the increased efficiency.
Net Profit Margin
This is a widely used measure of performance and is comparable across
companies in similar industries. The fact that a business works on a very low
margin need not cause alarm because there are some sectors in the industry
that work on a basis of high turnover and low margins, for examples
supermarkets and motorcar dealers.
What is more important in any trend is the margin and whether it compares
well with similar businesses.
The net margin ratio shows that the margin is fairly stable over time with
slight improvement to 1.73% in 2001. However, to know how well the firm
is performing one has to compare this ratio with the industry average or a
firm dealing in a similar business.
Return on Investment (ROI)
Income is earned by using the assets of a business productively. The more
efficient the production, the more profitable the business. The rate of return
on total assets indicates the degree of efficiency with which management
has used the assets of the enterprise during an accounting period. This is an
important ratio for all readers of financial statements.
Investors have placed funds with the managers of the business. The
managers used the funds to purchase assets which will be used to generate
returns. If the return is not better than the investors can achieve elsewhere,
they will instruct the managers to sell the assets and they will invest
elsewhere. The managers lose their jobs and the business liquidates.
Qazi Ashfaq | Financial Statement Analysis 18
• The ratio indicates that there is increase in the ROI from 8.38% in
2000 to 8.95% in 2002.
Return on Equity (ROE)
This ratio shows the profit attributable to the amount invested by the owners
of the business. It also shows potential investors into the business what they
might hope to receive as a return. The stockholders’ equity includes share
capital, share premium, distributable and non-distributable reserves. The
ratio is calculated as follows:
Again, the profitability to ordinary shareholders is strong and showing an
upward trend. Note that the return in 2002 as in all the years is after tax
and the shareholders should be extremely comfortable with these returns.
Earning Per Share (EPS)
Whatever income remains in the business after all prior claims, other than
owners claims (i.e. ordinary dividends) have been paid, will belong to the
ordinary shareholders who can then make a decision as to how much of this
income they wish to remove from the business in the form of a dividend, and
how much they wish to retain in the business. The shareholders are
particularly interested in knowing how much has been earned during the
financial year on each of the shares held by them. For this reason, an
earning per share figure must be calculated. Clearly then, the earning per
share calculation will be:
Exercises
Qazi Ashfaq | Financial Statement Analysis 19
1. Reconsider the ratios which have been calculated for analysis on
profitability. In your own words, analyse the trends in these ratios
and discuss the linkage between ROI and ROE.
2. How will the gross margin ratio assist you in determining the
profitability of a business?
3. In your own words, explain the calculation used for ROI.
4. When calculating EPS, explain how we should deal with
preference shares dividends.
E: Market Value Ratios
These ratios indicate the relationship of the firm’s share price to dividends
and earnings. Note that when we refer to the share price, we are talking
about the Market value and not the Nominal value as indicated by the par
value.
For this reason, it is difficult to perform these ratios on unlisted companies
as the market price for their shares is not freely available. One would first
have to value the shares of the business before calculating the ratios. Market
value ratios are strong indicators of what investors think of the firm’s past
performance and future prospects.
Dividend Yield Ratio
The dividend yield ratio indicates the return that investors are obtaining on
their investment in the form of dividends. This yield is usually fairly low as
the investors are also receiving capital growth on their investment in the
form of an increased share price. It is interesting to note that there is strong
correlation between dividend yields and market prices. Invariably, the higher
the dividend, the higher the market value of the share. The dividend yield
ratio compares the dividend per share against the price of the share and is
calculated as:
Notice a healthy increase in the yield from 2000 to 2002. The main reason
for this is that the dividend per share increased while at the same time, the
price of a share dropped.
Qazi Ashfaq | Financial Statement Analysis 20
This is fairly unusual because share prices usually increase when dividends
increase. However there could be number of reasons why this has happened,
either due to the economy or to mismanagement, leading to a loss of faith in
the stock market or in this particular stock.
Normally a very high dividend yield signals potential financial difficulties and
possible dividend payout cut. The dividend per share is merely the total
dividend divided by the number of shares issued. The price per share is the
market price of the share at the end of the financial year.
Price/Earning Ratio (P/E ratio)
• P/E ratio is a useful indicator of what premium or discount investors
are prepared to pay or receive for the investment.
• The higher the price in relation to earnings, the higher the P/E ratio
which indicates the higher the premium an investor is prepared to pay
for the share. This occurs because the investor is extremely confident
of the potential growth and earnings of the share.
The price-earning ratio is calculated as follows:
1. High P/E generally reflects lower risk and/or higher growth prospects
for earnings.
2. The above ratio shows that the shares were traded at a much higher
premium in 2000 than were in 2002. In 2000 the price was 26.8 times
higher than earnings while in 2002, the price was only 12 times
higher.
Dividend Cover
• This ratio measures the extent of earnings that are being paid out in
the form of dividends, i.e. how many times the dividends paid are
covered by earnings (similar to times interest earned ratio discussed
above).
• A higher cover would indicate that a larger percentage of earnings are
being retained and re-invested in the business while a lower dividend
cover would indicate the converse.
Qazi Ashfaq | Financial Statement Analysis 21
Dividend pay-out ratio
This ratio looks at the dividend payment in relation to net income and can be
calculated as follows:
Note: Even though the dividend yield has increased, the dividend payout
ratio has reduced, showing that a lower proportion of earnings was paid out
as dividend. The ratio has only reduced slightly, however, from 50.7% in
2000 to 49.4% in 2002. Generally, the low growth companies have higher
dividends payouts and high growth companies have lower dividend payouts.
Exercise:
1. In your own words, comment on the market value ratios in our
example. In your answer, assume the following industry average for
2002
Dividend yield: 3.2%
P/E Ratio: 12.8 times.
2. What is the purpose of calculating the market value ratio?
3. What actions can directors take to ensure a stable dividend yield
growth over time?
4. The P/E ratio indicates the premium an investor is prepared to
pay for a share. Discuss?
5. Explain what activities can cause the dividend payout ratio to
change.
Relationship Among Ratios
Qazi Ashfaq | Financial Statement Analysis 22
Qazi Ashfaq | Financial Statement Analysis 23
Qazi Ashfaq | Financial Statement Analysis 24
Qazi Ashfaq | Financial Statement Analysis 25