Tài liệu Semiconductor MaterialsS. K. Tewksbury Microelectronic Systems Research Center Dept. of Electrical ppt
Bạn đang xem bản rút gọn của tài liệu. Xem và tải ngay bản đầy đủ của tài liệu tại đây (485.35 KB, 32 trang )
Semiconductor Materials
S. K. Tewksbury
Microelectronic Systems Research Center
Dept. of Electrical and Computer Engineering
West Virginia University
Morgantown, WV 26506
(304)293-6371
Sept. 21, 1995
Contents
1 Introduction 2
2 Crystalline Structures 3
2.1 Basic Semiconductor Materials Groups 3
2.1.1 Elemental (IV-IV) Semiconductors 3
2.1.2 Compound III-V Semiconductors 4
2.1.3 Compound II-VI Semiconductors 6
2.2 Three-Dimensional Crystal Lattice 6
2.3 Crystal Directions and Planes 7
3 Energy Bands and Related Semiconductor Parameters 8
3.1 Conduction and Valence Band 9
3.2 Direct Gap and Indirect Gap Semiconductors 12
3.3 Effective Masses of Carriers 13
3.4 Intrinsic Carrier Densities 14
3.5 Substitutional Dopants 16
4 Carrier Transport 18
4.1 Low Field Mobilities 19
4.2 Saturated Carrier Velocities 21
5 Crystalline Defects 23
5.1 Point Defects 23
5.2 Line Defects 24
5.3 Stacking Faults and Grain Boundaries 26
5.4 Unintentional Impurities 26
5.5 Surface Defects: The Reconstructed Surface 27
1
6 Summary 29
1 Introduction
A semiconductor material has a resistivity lying between that of a conductor and that of an
insulator. However, in contrast to the granular materials used for resistors, a semiconductor
establishes its conduction properties through a complex quantum mechanical behavior within
a periodic array of semiconductor atoms, i.e., within a crystalline structure. For appropriate
atomic elements, the crystalline structure leads to a disallowed energy band between the
energy level of electrons bound to the crystal’s atoms and the energy level of electrons
free to move within the crystalline structure (i.e., not bound to an atom). This “energy
gap” fundamentally impacts the mechanisms through which electrons associated with the
crystal’s atoms can become free and serve as conduction electrons. The resistivity of a
semiconductor is proportional to the free carrier density, and that density can be changed
over a wide range by replacing a very small portion (about 1 in 10
6
) of the base crystal’s
atoms with different atomic species (doping atoms). The majority carrier density is largely
pinned to the net dopant impurity density. By selectively changing the crystalline atoms
within small regions of the crystal, a vast number of small regions of the crystal can be given
different conductivities. In addition, some dopants establish the electron carrier density
(free electron density) while others establish the “hole” carrier density (holes are the dual of
electrons within semiconductors). In this manner, different types of semiconductor (n-type
with much higher electron carrier density than the hole density and p-type with much higher
hole carrier density than the electron carrier density) can be located in small but contacting
regions within the crystal.
By applying electric fields appropriately, small regions of the semiconductor can be
placed in a state in which all the carriers (electron and hole) have been expelled by the
electric field, and that electric field sustained by the exposed dopant ions. This allows electric
switching between a conducting state (with a settable resistivity) and a non-conducting state
(with conductance vanishing as the carriers vanish).
This combination of localized regions with precisely controlled resistivity (dominated by
electron conduction or by hole conduction) combined with the ability to electronically control
the flow of the carriers (electrons and holes) leads to the semiconductors being the foundation
for contemporary electronics. This foundation is particularly strong because a wide variety of
atomic elements (and mixtures of atomic elements) can be used to tailor the semiconductor
material to specific needs. The dominance of silicon semiconductor material in the electronics
area (e.g., the VLSI digital electronics area) contrasts with the rich variety of semiconductor
materials widely used in optoelectronics. In the latter case, the ability to adjust the bandgap
to desired wavelengths of light has stimulated a vast number of optoelectronic components,
based on a variety of technologies. Electronic components also provide a role for non-silicon
semiconductor technologies, particularly for very high bandwidth circuits which can take
advantage of the higher speed capabilities of semiconductors using atomic elements similar to
those used in optoelectronics. This rich interest in non-silicon technologies will undoubtedly
continue to grow, due to the rapidly advancing applications of optoelectronics, for the simple
2
reason that silicon is not suitable for producing an efficient optical source.
This chapter provides an overview of many of the semiconductor materials in use. To
organize the information, the topic is developed from the perspective of the factors contribut-
ing to the electronic behavior of devices created in the semiconductor materials. Section 2
discusses the underlying crystalline structure and the semiconductor parameters which result
from that structure. Section 3 discusses the energy band properties in more detail, extract-
ing the basic semiconductor parameters related to those energy bands. Section 4 discusses
carrier transport. Crystalline defects, which can profoundly impact the behavior of devices
created in the semiconductors, are reviewed in Section 5.
2 Crystalline Structures
2.1 Basic Semiconductor Materials Groups
Most semiconductor materials are crystals created by atomic bonds through which the va-
lence band of the atoms are filled with 8 electrons through sharing of an electron from each of
four nearest neighbor atoms. These materials include semiconductors composed of a single
atomic species, with the basic atom having four electrons in its valence band (supplemented
by covalent bonds to four neighboring atoms to complete the valence band). These elemental
semiconductors therefore use atoms from group IV of the atomic chart. Other semiconduc-
tor materials are composed of two atoms, one from group N (N<4) and the other from
group M (M>4) with N + M = 8, filling the valence bands with 8 electrons. The major
categories of semiconductor material are summarized below.
2.1.1 Elemental (IV-IV) Semiconductors
Elemental semiconductors consist of crystals composed of only a single atomic element from
group IV of the periodic chart, i.e., germanium (Ge), silicon (Si), carbon (C), and tin (Sn).
Silicon is the most commonly used electronic semiconductor material, and is also the most
common element on earth. Table 1 summarizes the naturally occurring abundance of some
elements used for semiconductors, including non-elemental (compound) semiconductors.
Table 1: Abundance (fraction of elements occurring on earth) of common elements used for
semiconductors.
Element Abundance
Si 0.28
Ga 1.5 ×10
−5
As 1.8 ×10
−6
Ge 5 × 10
−6
Cd 2 ×10
−7
In 1 × 10
−7
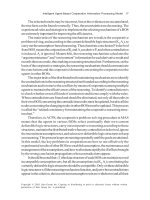
Figure 1a illustrates the covalent bonding (sharing of outer shell, valence band electrons
3
IV IV IV IV
IV IV IV IV
IV IV IV IV
IV IV IV IV
Si
III V III V
V III V III
III V III V
V III V III
Ga
II VI II VI
VI II VI II
II VI II VI
VI II VI II
Cd
As
Se
Group IV Group III Group V Group II Group VI
(a) (b) (c)
by two atoms) through which each group IV atom of the crystal is bonded to four neighboring
group IV atoms, creating filled outer electron bands of 8 electrons.
In addition to crystals composed of only a single group IV atomic species, one can
also create semiconductor crystals consisting of two or more atoms, all from group IV.
For example, silicon carbide (SiC) has been investigated for high temperature applications.
Si
x
Ge
1−x
semiconductors are under present study to achieve bandgap engineering within the
silicon system. In this case, a fraction x (0 <x<1) of the atoms in an otherwise silicon
crystal are silicon while a fraction 1 − x have been replaced by germanium. This ability to
replace a single atomic element with a combination of two atomic elements from the same
column of the periodic chart appears in the other categories of semiconductor described
below (and is particularly important for optoelectronic devices).
Figure 1: Bonding arrangements of atoms in semiconductor crystals. (a) Elemental semi-
conductor such as silicon. (b) Compound III-V semiconductor such as GaAs. (c) Compound
II-VI semiconductor such as CdS.
2.1.2 Compound III-V Semiconductors
The III-V semiconductors are prominent (and will gain in importance) for applications of
optoelectronics. In addition, III-V semiconductors have a potential for higher speed opera-
tion than silicon semiconductors in electronics applications, with particular importance for
areas such as wireless communications. The compound semiconductors have a crystal lat-
tice constructed from atomic elements in different groups of the periodic chart. The III-V
semiconductors are based on an atomic element A from Group III and an atomic element
B from Group V. Each Group III atom is bound to four Group V atoms, and each Group
V atom is bound to four Group III atoms, giving the general arrangement shown in Figure
1b. The bonds are produced by sharing of electrons such that each atom has a filled (8
4
electron) valence band. The bonding is largely covalent, though the shift of valence charge
from the Group V atoms to the Group III atoms induces a component of ionic bonding to
the crystal (in contrast to the elemental semiconductors which have purely covalent bonds).
Representative III-V compound semiconductors are GaP, GaAs, GaSb, InP, InAs, and InSb.
GaAs is probably the most familiar example of III-V compound semiconductors, used
for both high speed electronics and for optoelectronic devices. Optoelectronics has taken
advantage of ternary and quaternary III-V semiconductors to establish optical wavelengths
and to achieve a variety of novel device structures. The ternary semiconductors have the
general form (A
x
,A
1−x
)B (with two group III atoms used to fill the group III atom positions
in the lattice) or A(B
x
,B
1−x
) (using two group V atoms in the Group V atomic positions
in the lattice). The quaternary semiconductors use two Group III atomic elements and
two Group V atomic elements, yielding the general form (A
x
,A
1−x
)(B
y
,B
1−y
). In such
constructions, 0 ≤ x ≤ 1. Such ternary and quaternary versions are important since the
mixing factors (x and y) allow the bandgap to be adjusted to lie between the bandgaps
of the simple compound crystals with only one type of Group III and one type of Group
V atomic element. The adjustment of wavelength allows the material to be tailored for
particular optical wavelengths, since the wavelength λ of light is related to energy (in this
case the gap energy E
g
)byλ=hc/E
g
, where h is Plank’s constant and c is the speed
of light. Table 2 provides examples of semiconductor laser materials and a representative
optical wavelength for each, providing a hint of the vast range of combinations which are
available for optoelectronic applications. Table 3, on the other hand, illustrates the change
in wavelength (here corresponding to color in the visible spectrum) by adjusting the mixture
of a ternary semiconductor.
Table 2: Semiconductor optical sources and representative wavelengths.
Material layers used wavelength
ZnS 454 nm
AlGaInP/GaAs 580 nm
AlGaAs/GaAs 680 nm
GaInAsP/InP 1580 nm
InGaAsSb/GaSb 2200 nm
AlGaSb/InAsSb/GaSb 3900 nm
PbSnTe/PbTe 6000 nm
Table 3: Variation of x to adjust wavelength in GaAs
x
P
1−x
semiconductors.
Ternary Compound Color
GaAs
0.14
P
0.86
Yellow
GaAs
0.35
P
0.65
Orange
GaAs
0.6
P
0.4
Red
5
FCC Lattice
A
FCC Lattice
B
(a) (b) (c)
In contrast to single element elemental semiconductors (for which the positioning of
each atom on a lattice site is not relevant), III-V semiconductors require very good control
of stoichiometry (i.e., the ratio of the two atomic species) during crystal growth. For example,
each Ga atom must reside on a Ga (and not an As) site and vice versa. For these and other
reasons, large III-V crystals of high quality are generally more difficult to grow than a large
crystal of an elemental semiconductor such as Si.
2.1.3 Compound II-VI Semiconductors
These semiconductors are based on one atomic element from Group II and one atomic el-
ement from Group VI, each type being bonded to four nearest neighbors of the other type
as shown in Figure 1c. The increased amount of charge from Group VI to Group II atoms
tends to cause the bonding to be more ionic than in the case of III-V semiconductors. II-VI
semiconductors can be created in ternary and quaternary forms, much like the III-V semi-
conductors. Although less common than the III-V semiconductors, the II-VI semiconductors
have served the needs of several important applications. Representative II-VI semiconductors
are ZnS, ZnSe,and ZnTe (which form in the zinc blende lattice structure discussed below);
CdS and CdSe, (which can form in either the zinc blende or the wurtzite lattice structure)
and CdTe which forms in the wurtzite lattice structure.
2.2 Three-Dimensional Crystal Lattice
The two-dimensional views illustrated in the previous section provide a simple view of the
sharing of valence band electrons and the bonds between atoms. However, the full 3-D lattice
structure is considerably more complex than this simple 2-D illustration. Fortunately, most
semiconductor crystals share a common basic structure, developed below.
Figure 2: Three-dimensional crystal lattice structure. (a) Basic cubic lattice. (c) Face-
centered cubic (fcc) lattice. (c) Two interpenetrating fcc lattices. In this figure, the dashed
lines between atoms are not atomic bonds but instead are used merely to show the basic
outline of the cube.
The crystal structure begins with a cubic arrangement of 8 atoms as shown in Figure
2a. This cubic lattice is extended to a face-centered cubic (fcc) lattice, shown in 2b, by
6
adding an atom to the center of each face of the cube (leading to a lattice with 14 atoms).
The lattice constant is the side dimension of this cube.
The full lattice structure combines two of these fcc lattices, one lattice interpenetrating
the other (i.e., the corner of one cube is positioned within the interior of the other cube,
with the faces remaining parallel), as illustrated in Figure 2c. For the III-V and II-VI
semiconductors with this fcc lattice foundation, one fcc lattice is constructed from one type
of element (e.g., type III) and the second fcc lattice is constructed from the other type of
element (e.g., group V). In the case of ternary and quaternary semiconductors, elements
from the same atomic group are placed on the same fcc lattice. All bonds between atoms
occur between atoms in different fcc lattices. For example, all Ga atoms in the GaAs crystal
are located on one of the fcc lattices and are bonded to As atoms, all of which appear on
the second fcc lattice. The interatomic distances between neighboring atoms is therefore less
than the lattice constant. For example, the interatomic spacing of Si atoms is 2.35
˚
A but
the lattice constant of Si is 5.43
˚
A.
If the two fcc lattices contain elements from different groups of the periodic chart,
the overall crystal structure is called the zinc blende lattice. In the case of an elemental
semiconductor such as silicon, silicon atoms appear in both fcc lattices and the overall
crystal structure is called the diamond lattice (carbon crystallizes into a diamond lattice
creating true diamonds, and carbon is a group IV element). As in the discussion regarding
III-V semiconductors above, the bonds between silicon atoms in the silicon crystal extend
between fcc sublattices.
Although the common semiconductor materials share this basic diamond/zinc blende
lattice structure, some semiconductor crystals are based on a hexagonal close-packed (hcp)
lattice. Examples are CdS and CdSe. In this example, all the Cd atoms are located on
one hcp lattice while the other atom (S or Se) is located on a second hcp lattice. In the
spirit of the diamond and zinc blende lattices above, the complete lattice is constructed by
interpenetrating these two hcp lattices. The overall crystal structure is called a wurtzite
lattice. Type IV-VI semiconductors (PbS, PbSe, PbTe, and SnTe) exhibit a narrow band
gap and have been used for infrared detectors. The lattice structure of these example IV-VI
semiconductors is the simple cubic lattice (also called an NaCl lattice).
2.3 Crystal Directions and Planes
Crystallographic directions and planes are important in both the characteristics and the ap-
plications of semiconductor materials since different crystallographic planes can exhibit sig-
nificantly different physical properties. For example, the surface density of atoms (atoms/cm
2
)
can differ substantially on different crystal planes. A standardized notation (the so-called
Miller indices) is used to define the crystallographic planes and directions normal to those
planes.
The general crystal lattice defines a set of unit vectors (a,b, and c) such that an entire
crystal can be developed by copying the unit cell of the crystal and duplicating it at integer
offsets along the unit vectors, i.e., replicating the basis cell at positions n
a
a + n
b
b + n
c
c,
where n
a
, n
b
, and n
c
are integers. The unit vectors need not be orthogonal in general. For
7
(a) (b) (c)
x
z
y
the cubic foundation of the diamond and zinc blende structures, however, the unit vectors
are in the orthogonal x, y, and z directions.
Figure 3 shows a cubic crystal, with basis vectors in the x,y, and z directions. Su-
perimposed on this lattice are three planes (Figures 3a, b and c). The planes are defined
relative to the crystal axes by a set of three integers (h, k, l) where h corresponds to the
plane’s intercept with the x-axis, k corresponds to the plane’s intercept with the y-axis and
l corresponds to the plane’s intercept with the z-axis. Since parallel planes are equivalent
planes, the intercept integers are reduced to the set of the three smallest integers having the
same ratios as the above intercepts. The (100), (010) and (001) planes correspond to the
faces of the cube. The (111) plane is tilted with respect to the cube faces, intercepting the
x, y, and z axes at 1, 1, and 1, respectively. In the case of a negative axis intercept, the
corresponding Miller index is given as an integer and a bar over the integer,e.g., (
¯
100), i.e.,
similar to (100) plane but intersecting x-axis at -1.
Figure 3: Examples of crystallographic planes within a cubic lattice organized semiconductor
crystal. (a) (010) plane. (b) (110) plane. (c) (111) plane.
Additional notation is used to represent sets of planes with equivalent symmetry and to
represent directions. For example, {100} represents the set of equivalent planes (100), (
¯
100).
(010), (0
¯
10), (001), and (00
¯
1). The direction normal to the (hkl) plane is designated [hkl].
The different planes exhibit different behavior during device fabrication and impact electrical
device performance differently. One difference is due to the different reconstructions of the
crystal lattice near a surface to minimize energy. Another is the different surface density of
atoms on different crystallographic planes. For example, in Si the (100), (110), and (111)
planes have surface atom densities (atoms per cm
2
)of6.78×10
14
,9.59×10
14
, and 7.83×10
14
,
respectively.
3 Energy Bands and Related Semiconductor Parameters
A semiconductor crystal establishes a periodic arrangement of atoms, leading to a periodic
spatial variation of the potential energy throughout the crystal. Since that potential energy
8
varies significantly over interatomic distances, quantum mechanics must be used as the basis
for allowed energy levels and other properties related to the semiconductor. Different semi-
conductor crystals (with their different atomic elements and different inter-atomic spacings)
lead to different characteristics. However, the periodicity of the potential variations leads
to several powerful general results applicable to all semiconductor crystals. Given these
general characteristics, the different semiconductor materials exhibit properties related to
the variables associated with these general results. A coherent discussion of these quantum
mechanical results is beyond the scope of this chapter and we therefore take those general
results as given.
In the case of materials which are semiconductors, a central result is the energy-
momentum functions defining the state of the electronic charge carriers. In addition to
the familiar electrons, semiconductors also provide holes (i.e. positively charged particles)
which behave similarly to the electrons. Two energy levels are important: one is the energy
level (conduction band) corresponding to electrons which are not bound to crystal atoms and
which can move through the crystal and the other energy level (valence band) corresponds to
holes which can move through the crystal. Between these two energy levels, there is a region
of “forbidden” energies (i.e., energies for which a free carrier can not exist). The separation
between the conduction and valence band minima is called the energy gap or band gap. The
energy bands and the energy gap are fundamentally important features of the semiconductor
material and are reviewed below.
3.1 Conduction and Valence Band
In quantum mechanics, a “particle” is represented by a collection of plane waves (e
j(ωt−
k·x)
)
where the frequency ω is related to the energy E according to E =¯hω and the momentum
p is related to the wave vector by p =¯h
k. In the case of a classical particle with mass m
moving in free space, the energy and momentum are related by E = p
2
/(2m) which, using
the relationship between momentum and wave vector, can be expressed as E =(¯hk)
2
/(2m).
In the case of the semiconductor, we are interested in the energy/momentum relationship for
a free electron (or hole) moving in the semiconductor, rather than moving in free space. In
general, this E-k relationship will be quite complex and there will be a multiplicity of E-k
“states” resulting from the quantum mechanical effects. One consequence of the periodicity
of the crystal’s atom sites is a periodicity in the wave vector k, requiring that we consider
only values of k over a limited range (with the E-k relationship periodic in k).
Figure 4 illustrates a simple example (not a real case) of a conduction band and a valence
band in the energy-momentum plane (i.e., the E vs k plane). The E vs k relationship of the
conduction band will exhibit a minimum energy value and, under equilibrium conditions,
the electrons will favor being in that minimum energy state. Electron energy levels above
this minimum (E
c
) exist, with a corresponding value of momentum. The E vs k relationship
for the valence band corresponds to the energy-momentum relationship for holes. In this
case, the energy values increase in the direction toward the bottom of the page and the
“minimum” valence band energy level E
v
is the maximum value in Figure 4. When an
electron bound to an atom is provided with sufficient energy to become a free electron, a
9
ΓΚL [111] direction [100] direction
kk
Energy E
E
c
E
v
Conduction band
minimum
(free electrons)
Valence band
minimum
(free holes)
Energy gap
E
g
Figure 4: General structure of conduction and valence bands.
hole is left behind. Therefore, the energy gap E
g
= E
c
−E
v
represents the minimum energy
necessary to generate an electron-hole pair (higher energies will initially produce electrons
with energy greater than E
c
, but such electrons will generally lose energy and fall into the
potential minimum).
The details of the energy bands and the bandgap depend on the detailed quantum
mechanical solutions for the semiconductor crystal structure. Changes in that structure
(even for a given semiconductor crystal such as Si) can therefore lead to changes in the
energy band results. Since the thermal coefficient of expansion of semiconductors is non-
zero, the band gap depends on temperature due to changes in atomic spacing with changing
temperature. Changes in pressure also lead to changes in atomic spacing. Though these
changes are small, the are observable in the value of the energy gap. Table 4 gives the room
temperature value of the energy gap E
g
for several common semiconductors, along with the
rate of change of E
g
with temperature (T ) and pressure (P ) at room temperature.
The temperature dependence, though small, can have a significant impact on carrier
densities. A heuristic model of the temperature dependence of E
g
is E
g
(T )=E
g
(0
o
K) −
αT
2
/(T + β). Values for the parameters in this equation are provided in Table 5. Between
0K and 1000K, the values predicted by this equation for the energy gap of GaAs are accurate
to about 2 ×10
−3
eV (electron volts).
10
Table 4: Variation of energy gap with temperature and pressure. Adapted from [5].
Semiconductor E
g
(300K) dE
g
/dT (meV/
o
K) dE
g
/dP (meV/kbar)
Si 1.110 -0.28 -1.41
Ge 0.664 -0.37 5.1
GaP 2.272 -0.37 10.5
GaAs 1.411 -0.39 11.3
GaSb 0.70 -0.37 14.5
InP 1.34 -0.29 9.1
InAs 0.356 -0.34 10.0
InSb 0.180 -0.28 15.7
ZnSe 2.713 -0.45 0.7
ZnTe 2.26 -0.52 8.3
CdS 2.485 -0.41 4.5
CdSe 1.751 0.36 5.
CdTe 1.43 -0.54 8
Table 5: Temperature dependence parameters for common semiconductors. Adapted from
[4].
E
g
(0
o
K) α(×10
−4
) β E
g
(300K)
GaAs 1.519 eV 5.405 204 1.42 eV
Si 1.170 eV 4.73 636 1.12 eV
Ge 0.7437 eV 4.774 235 0.66 eV
11
Energy gap
Conduction
band
minimum
Valence band
minimum
0
1
2
3
4
5
6
-1
-2
-3
[111]
[100]
Γ
LK
[111]
[100]
Γ
LK
[111]
[100]
Γ
LK
Germanium Silicon GaAs
Wave Vector
Energy (eV)
(a) (b) (c)
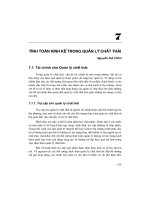
3.2 Direct Gap and Indirect Gap Semiconductors
Figure 5 illustrates the energy bands for Ge, Si and GaAs crystals. In Figure 5b, for silicon,
the valence band has a minimum at a value of
k different than that for the conduction band
minimum. This is an indirect gap, with generation of an electron-hole pair requiring an
energy E
g
and a change in momentum (i.e., k). For direct recombination of an electron-hole
pair, a change in momentum is also required. This requirement for a momentum change (in
combination with energy and momentum conservation laws) leads to a requirement that a
phonon participate with the carrier pair during a direct recombination process generating
a photon. This is a highly unlikely event, rendering silicon ineffective as an optoelectronic
source of light. The direct generation process is more readily allowed (with the simultaneous
generation of an electron, a hole, and a phonon), allowing silicon and other direct gap
semiconductors to serve as optical detectors.
Figure 5: Conduction and valence bands for (a) germanium, (b) silicon, and (c) GaAs.
Adapted from [4].
12
In Figure 5c, for GaAs, the conduction band minimum and the valence band minimum
occur at the same value of momentum, corresponding to a direct gap. Since no momentum
change is necessary during direct recombination, such recombination proceeds readily, pro-
ducing a photon with the energy of the initial electron and hole (i.e., a photon energy equal
to the bandgap energy). For this reason, direct gap semiconductors are efficient sources of
light (and use of different direct gap semiconductors with different E
g
provides a means of
tailoring the wavelength of the source). The wavelength λ corresponding to the gap energy
is λ = hc/E
g
.
Figure 5c also illustrates a second conduction band minimum with an indirect gap, but
at a higher energy than the minimum associated with the direct gap. The higher conduction
band minimum can be populated by electrons (which are in an equilibrium state of higher
energy) but the population will decrease as the electrons gain energy sufficient to overcome
that upper barrier.
3.3 Effective Masses of Carriers
For an electron with energy close to the minimum of the conduction band, the energy vs
momentum relationship is approximately given by E(k)=E
0
+a
2
(k−k
∗
)
2
+a
4
(k−k
∗
)
4
+
Here, E
0
= E
c
is the “ground state energy” corresponding to a free electron at rest and k
∗
is
the wave vector at which the conduction band minimum occurs. Only even powers of k −k
∗
appear in the expansion of E(k) around k
∗
due to the symmetry of the E-k relationship
around k = k
∗
. The above approximation holds for sufficiently small increases in E above
E
c
. For sufficiently small movements away from the minimum (i.e., sufficiently small k −k
∗
),
the terms in k−k
∗
higher than quadratic can be ignored and E(k) ≈ E
0
+a
2
k
2
, where we have
taken k
∗
= 0. If, instead of a free electron moving in the semiconductor crystal, we had a free
electron moving in free space with potential energy E
0
, the energy-momentum relationship
would be E(k)=E
0
+(¯hk)
2
/(2m
0
), where m
0
is the mass of an electron. By comparison of
these results, it is clear that we can relate the curvature coefficient a
2
associated with the
parabolic minimum of the conduction band to an effective mass m
∗
e
, i.e., a
2
=(¯h
2
)/(2m
∗
e
)or
1
m
∗
e
=
2
¯h
2
·
∂
2
E
c
(k)
∂k
2
.
Similarly for holes, an effective mass m
∗
h
of the holes can be defined by the curvature of
the valence band minimum, i.e.,
1
m
∗
h
=
2
¯h
2
·
∂
2
E
v
(k)
∂k
2
.
Since the energy bands depend on temperature and pressure, the effective masses can also
be expected to have such dependencies, though the room temperature and normal pressure
value is normally used in device calculations.
The above discussion assumes the simplified case of a scalar variable k. In fact, the wave
vector
k has three components (k
1
,k
2
,k
3
), with directions defined by the unit vectors of the
underlying crystal. Therefore, there are separate masses for each of these vector components
13
of
k, i.e., masses m
1
,m
2
,m
3
. A scalar mass m
∗
can be defined using these directional masses,
the relationship depending on the details of the directional masses. For cubic crystals (as in
the diamond and zinc blende structures), the directions are the usual orthonormal directions
and m
∗
=(m
1
·m
2
·m
3
)
1/3
. The three directional masses effectively reduce to two components
if two values are equal (e.g., m
1
= m
2
), as in the case of longitudinal and transverse effective
masses (m
l
and m
t
, respectively) seen in silicon and several other semiconductors. In this
case, m
∗
=[(m
t
)
2
·m
l
]
1/3
.If all three values of m
1
,m
2
,m
3
are equal, then a single value m
∗
can be used.
An additional complication is seen in the valence band structures in Figure 5. Here,
two different E-k valence bands have the same minima. Since their curvatures are different,
the two bands correspond to different masses, one corresponding to heavy holes with mass
m
h
and the other to light holes with mass m
l
. The effective scalar mass in this case is
m
∗
=(m
3/2
h
+m
3/2
l
)
2/3
.Such light and heavy holes occur in several semiconductors, including
Si.
Values of effective mass are given in Tables 8 and 13.
3.4 Intrinsic Carrier Densities
The density of free electrons in the conduction band depends on two functions. One is the
density of states D(E) in which electrons can exist and the other is the energy distribution
function F (E,T) of free electrons.
The energy distribution function (under thermal equilibrium conditions) is given by the
Fermi-Dirac distribution function
F (E)=
1 + exp
E − E
f
k
B
T
−1
which, in most practical cases, can be approximated by the classical Maxwell-Boltzmann
distribution. These distribution functions are general functions, not depending on the specific
semiconductor material.
The density of states D(E), on the other hand, depends on the semiconductor material.
A common approximation is
D
n
(E)=M
c
√
2
π
2
(E−E
c
)
1
/2
¯h
3
(m
∗
e
)
3
/2
for electrons and
D
p
(E)=M
v
√
2
π
2
(E
v
−E)
1
/2
¯h
3
(m
∗
h
)
3
/2
for holes. Here, M
c
and M
v
are the number of equivalent minima in the conduction band
and valence band, respectively. Note that necessarily E ≥ E
c
for free electrons and E ≤ E
v
for free holes due to the forbidden region between E
c
and E
v
.
The density n of electrons in the conduction band can be calculated as
n =
∞
E=E
c
F (E,T)D(E)dE.
14
For Fermi levels significantly (more than a few k
B
T ) below E
c
and above E
v
, this integration
leads to the results
n = N
c
e
−(E
c
−E
f
)/k
b
T
and
p = N
v
e
−(E
f
−E
v
)/k
b
T
where n and p are the densities of free electrons in the conduction band and of holes in the
valence band, respectively. N
c
and N
v
are effective densities of states which vary with temper-
ature (slower than the exponential in the equations above), effective mass, and other condi-
tions. Table 6 gives values of N
c
and N
v
for several semiconductors. Approximate expressions
for these densities of state are N
c
= 2(2πm
∗
e
k
B
T/¯h
2
)
3/2
M
c
and N
v
= 2(2πm
∗
e
k
B
T/¯h
2
)
3/2
M
v
.
These effective densities of states are fundamental parameters used in evaluating the elec-
trical characteristics of semiconductors. The equations above for n and p apply both to
intrinsic semiconductors (i.e., semiconductors with no impurity dopants) as well as to semi-
conductors which have been doped with donor and/or acceptor impurities. Changes in the
interrelated values of n and p through introduction of dopant impurities can be represented
by changes in a single variable, the Fermi level E
f
.
The product of n and p is independent of Fermi level and is given by
n ·p = N
c
· N
v
e
−E
g
/k
B
T
where the energy gap E
g
= E
c
− E
v
. Again, this holds for both intrinsic semiconductors
and for doped semiconductors. In the case of an intrinsic semiconductor, charge neutrality
requires that n = p ≡ n
i
, where n
i
is the intrinsic carrier concentration and
n
2
i
= N
c
· N
v
e
−E
g
/k
B
T
.
Since, under thermal equislibrium conditions np ≡ n
2
i
(even under impurity doping condi-
tions), knowledge of the density of one of the carrier types (e.g., of p) allows direct deter-
mination of the density of the other (e.g., n = n
2
i
/p). Values of n
i
vary considerably among
semiconductor materials: 2 ×10
−3
/cm
3
for CdS, 3.3 ×10
6
/cm
3
for GaAs, 0.9 ×10
10
/cm
3
for
Si, 1.9 ×10
13
/cm
3
for Ge, and 9.1 ×10
14
for PbS.
Since there is appreciable temperature dependence in the effective density of states,
the equations above do not accurately represent the temperature variations in n
i
over wide
temperature ranges. Using the approximate expressions for N
c
and N
v
above,
n
i
= 2(2πk
B
T/¯h
2
)
3/2
(m
∗
e
m
∗
h
)
3/4
M
c
M
v
e
−E
g
/k
B
T
,
exhibiting a T
3/2
temperature dependence superimposed on the exponential dependence on
1/T . For example, at 300K,
n
i
(T )=1.76 ×10
16
T
3/2
e
−4550/T
cm
−3
for Ge and
n
i
(T )=3.88 ×10
16
T
3/2
e
−7000/T
cm
−3
for Si.
15
Table 6: N
c
and N
v
at 300K. Adapted from [5].
N
c
(×10
19
/cm
3
) N
v
(×10
19
/cm
3
)
Ge 1.54 1.9
Si 2.8 1.02
GaAs 0.043 0.81
GaP 1.83 1.14
GaSb 0.021 0.62
InAs 0.0056 0.62
InP 0.052 1.26
InSb 0.0043 0.62
CdS 0.224 2.5
CdSe 0.11 0.74
CdTe 0.13 0.55
ZnSe 0.31 0.87
ZnTe 0.22 0.078
3.5 Substitutional Dopants
An intrinsic semiconductor material contains only the elemental atoms of the basic material
(e.g., silicon atoms for Si, gallium and arsenic atoms for GaAs, etc.). The resistivity is quite
high for such intrinsic semiconductors and doping is used to establish a controlled lower
resistivity material (and to establish pn junctions for active devices). Doping concentrations
are generally in the range 10
14
to 10
17
/cm
3
, small relative to the density of atoms in the
crystal (e.g., to the density 5 ×10
22
atoms/cm
3
of silicon atoms in Si crystals). Table 7 lists
a variety of dopants and their energy levels for Si and GaAs.
Table 7: Acceptor and donor impurities used in Si and GaAs. Adapted from [1].
Donor E
c
− E
d
(eV) Acceptor E
a
− E
v
(eV)
Si crystal Sb 0.039 B 0.045
P 0.045 Al 0.067
As 0.054 Ga 0.073
GaAs crystal S 0.006 Mg 0.028
Se 0.006 Zn 0.031
Te 0.03 Cd 0.035
Si 0.058 Si 0.026
Figure 6a illustrates acceptor dopants and donor dopants in silicon. In the case of
acceptor dopants, group III elements of the periodic chart are used to substitute for the
group IV silicon atoms in the crystal. This acceptor atom has one fewer electron in its
outer shell than the silicon atom, and readily captures a free electron to provide the missing
16
electron needed to complete the outer shells (8 electrons) provided by the covalent bonds.
The acceptor atom, with a captured electron, becomes a negative ion. The electron captured
from the outer shell of a neighboring silicon atom leaves behind a hole at that neighboring
silicon atom (i.e., generates a free hole when ionized). By using acceptor doping densities N
A
substantially greater than n
i
, a net hole density p n
i
is created. With np = n
2
i
a constant,
the electron density n decreases as p increases above n
i
. The resulting semiconductor material
becomes p-type. In the case of donor dopants, group V elements are used to substitute for
a silicon atom in the crystal. The donor atom has one extra electron in its outer shell,
compared to a silicon atom, and that extra electron can leave the donor site and become a
free electron. In this case, the donor becomes a positive ion, generating a free electron. By
using donor doping densities N
D
substantially greater than n
i
, a net electron density n n
i
is created, and p decreases substantially below n
i
to maintain the np product np = n
2
i
.An
n-type semiconductor is produced.
Figure 6b illustrates the alternative doping options for a III-V semiconductor (GaAs
used as an example). Replacement of a Group III element with a Group II element renders
that Group II element an acceptor (one fewer electron). Replacement of a Group V element
with a Group VI element renders that Group VI element a donor (one extra electron). Group
IV elements such as silicon can also be used for doping. In this case, the Group IV element
is a donor if it replaces a Group III element in the crystal and is an acceptor if it replaces
a Group V element in the crystal. Impurities which can serve as either an acceptor or as a
donor within a crystal are called amphoteric impurities.
Acceptor and donor impurities are most effectively used when the energy required to
generate a carrier is small. In the case of small ionization energies (in the crystal lattice), the
energy levels associated with the impurities lie within the bandgap close to their respective
bands (i.e., donor ionization energies close to the conduction band and acceptor ionization
energies close to the valence band). If the difference between the ionization level and the
corresponding valence/conduction band is less than about 3k
B
T (≈ 0.075 eV at 300K), then
the impurities (called shallow energy level dopants) are essentially fully ionized at room tem-
perature. The dopants listed in Table 7 are such shallow energy dopants. A semiconductor
doped with N
A
n
i
acceptors then has a hole density p ≈ N
A
and a much smaller electron
density n ≈ n
2
i
/N
A
. Similarly, a semiconductor doped with N
D
n
i
donors has an electron
density n ≈ N
D
and a much smaller hole density p = n
2
i
/N
D
. From the results given earlier
for carrier concentrations as a function of Fermi level, the Fermi level is readily calculated
(given the majority carrier concentration).
Most semiconductors can be selectively made (by doping) either n-type or p-type, in
which case they are called ambipolar semiconductors. Some semiconductors can be selectively
made only n-type or only p-type. For example, ZnTe is always p-type while CdS is always
n-type. Such semiconductors are called unipolar semiconductors.
Dopants with energy levels closer to the center of the energy gap (i.e., the so called
deep energy level dopants) serve as electron-hole recombination sites, impacting the minority
carrier lifetime and the dominant recombination mechanism in indirect band gap semicon-
ductors.
17
Si
Group
IV
III
Accepto
r
Accepts electron
to mimic Si
V
Donor
Forfeits electron
to mimic Si
Ga
Group
III
II
Acceptor
Accepts electron
to mimic Ga
IV
Donor
Forfeits electron
to mimic Ga
As
Group
V
IV
Acceptor
Accepts electron
to mimic As
VI
Donor
Forfeits electron
to mimic As
Substitutes
Group IV
Substitutes
Group III
Substitutes
Group V
Group IV
Semiconductor
Group III-V
Semiconductor
(a)
(b)
Figure 6: Substitution of dopant atoms for crystal atoms. (a) IV-IV semiconductors (e.g.,
silicon). (b) III-V semiconductors (e.g., GaAs).
4 Carrier Transport
Currents in semiconductors arise both due to movement of free carriers in the presence of
an electric field and due to diffusion of carriers from high, carrier density regions into lower,
carrier density regions. Currents due to electric fields are considered first.
In earlier discussions, it was noted that the motion of an electron in a perfect crystal
can be represented by a free electron with an effective mass m
∗
e
somewhat different than the
18
real mass m
e
of an electron. In this model, once the effective mass has been determined, the
atoms of the perfect crystal can be discarded and the electron viewed as moving within free
space. If the crystal is not perfect, however, those deviations from perfection remain after
the perfect crystal lattice has been discarded and act as scattering sites within the “free
space” seen by the electron in the crystal.
Substitution of a dopant for an element of the perfect crystal leads to a distortion of
the perfect lattice from which electrons can scatter. If that substitutional dopant is ionized,
the electric field of that ion adds to the scattering. Impurities located at interstitial sites
(i.e., between atoms in the normal lattice sites) also disrupt the perfect crystal and lead
to scattering sites. Crystal defects (e.g., a missing atom) disrupt the perfect crystal and
appears as a scattering site in the “free space” seen by the electron. In useful semiconductor
crystals, the density of such scattering sites is small relative to the density of silicon atoms.
As a result, removal of the silicon atoms through use of the effective mass leaves a somewhat
sparsely populated space of scattering sites.
The perfect crystal corresponds to all atomic elements at the lattice positions and not
moving, a condition which can occur only at 0K. At temperatures above absolute zero, the
atoms have thermal energy which causes them to move away from their ideal site. As the
atom moves away from the nominal, equilibrium site, forces act to return it to that site,
establishing the conditions for a classical oscillator problem (with the atom oscillating about
its equilibrium location). Such oscillations of an atom can transfer to a neighboring atom
(by energy exchange), leading to the oscillation propagating through space. This wave-like
disturbance is called a phonon and serves as a scattering site (phonon scattering, also called
lattice scattering) which can appear anywhere in the crystal.
4.1 Low Field Mobilities
The dominant scattering mechanisms in silicon are ionized impurity scattering and phonon
scattering, though other mechanisms such as mentioned above do contribute. Within this
“free space” contaminated by scattering centers, the free electron moves at a high velocity
(the thermal velocity v
therm
) set by the thermal energy (k
B
T ) of the electron, with 2k
B
T/3=
0.5m
∗
e
v
2
therm
and therefore v
therm
=
4k
B
T/3m
∗
e
. At room temperature in Si, the thermal
velocity is about 1.5 × 10
7
cm/sec, substantially higher than most velocities which will be
induced by applied electric fields or by diffusion. Thermal velocities depend reciprocally on
effective mass, with semiconductors having lower effective masses displaying higher thermal
velocities than semiconductors with higher effective masses. At these high thermal velocities,
the electron will have an average mean time τ
n
between collisions with the scattering centers
during which it is moving as a free electron in free space. It is during this period between
collisions that an external field acts on the electron, creating a slight displacement of the
orbit of the free electron. Upon colliding, the process starts again, producing again a slight
displacement in the orbit of the free electron. This displacement divided by the mean free
time τ
n
between collisions represents the velocity component induced by the external electric
field. In the absence of such an electric field, the electron would be scattered in random
directions and display no net displacement in time. With then applied electric field, the
19
electron has a net drift in the direction set by the field. For this reason, the induced velocity
component is called the drift velocity and the thermal velocities can be ignored.
By using the standard force equation F = eE = m
∗
e
dv/dt with velocity v = 0 at time
t = 0 and with an acceleration time τ
n
, the final velocity v
f
after time τ
n
is then simply
v
f
= eτ
n
E/m
∗
e
and, letting v
drif t
= v
f
/2, v
drif t
= eτ
n
E/(2m
∗
e
).
The drift velocity v
drif t
in an external field E is seen above to vary as v
drif t
= µ
n
E, where
the electron’s low field mobility µ
n
is given approximately by µ
n
≈ eτ
n
/(2m
∗
e
). Similarly,
holes are characterized by a low field mobility µ
p
≈ eτ
p
/(2m
∗
h
), where τ
p
is the mean time
between colisions for holes.
This simplified mobility model yields a mobility which is inversely proportional to the
effective mass. The effective electron masses in GaAs and Si are 0.09m
e
and 0.26m
e
, re-
spectively, suggesting a higher electron mobility in GaAs than in Si (in fact, the electron
mobility in GaAs is about 3 times greater than that in Si). The electron and hole effective
masses in Si are 0.26m
e
and 0.38m
e
, respectively, suggesting a higher electron mobility than
hole mobility in Si (in Si, µ
n
≈ 1400 cm
2
/V ·sec and µ
p
≈ 500 cm
2
/V ·sec). The simplified
model for µ
n
and µ
p
above is based on the highly simplified model of the scattering con-
ditions encountered by carriers moving with thermal energy. Far more complex analysis is
necessary to obtain theoretical values of these mobilities. For this reason, the approximate
model should be regarded as a guide to mobility variations among semiconductors and not
as a predictive model.
Table 8: Conductivity effective masses for common semiconductors
Ge Si GaAs
m
∗
e
0.12 m
0
0.26 m
0
0.063 m
0
m
∗
h
0.23 m
0
0.38 m
0
0.53
Table 9: Mobility and temperature dependence at 300K. Mobility is in cm
2
/V · sec. Adapted
from [11].
Ge Si GaAs
µ
n
µ
p
µ
n
µ
p
µ
n
µ
p
Mobility 3900 1900 1400 470 8000 340
Temperature dependence T
−1.66
T
−2.33
T
−2.5
T
−2.7
– T
−2.3
The linear dependence of the mobility µ
n
(µ
p
)onτ
n
(τ
p
), suggested by the simplified
development above, also provides a qualitative understanding of the mobility dependence
on impurity doping and on temperature. As noted earlier, phonon scattering and ionized
impurity scattering are the dominant mechanisms controlling the scattering of carriers in
most semiconductors. At room temperature and for normally used impurity doping con-
centrations, phonon scattering typically dominates ionized impurity scattering. As the tem-
perature decreases, the thermal energy of the crystal atoms decreases, leading to a decrease
20
in the phonon scattering and an increase in the mean free time between phonon scattering
events. The result is a mobility µ
phonon
which increases with decreasing temperature accord-
ing to µ
phonon
≈ B
1
T
−α
where α is typically between 1.6 and 2.8 at 300K. Table 9 gives the
room temperature mobility and temperature dependence of mobility at 300K for Ge, Si, and
GaAs. In the case of ionized impurity scattering, the lower temperature leads to a lower
thermal velocity, with the electrons passing ionized impurity sites more slowly and suffering
a stronger scattering effect. As a result, the mobility µ
ion
decreases with decreasing tem-
perature. Starting at a sufficiently high temperature that phonon scattering dominates, the
overall mobility will initially increase with decreasing temperature until the ionized impurity
scattering becomes dominant, leading to subsequent decreases in the overall mobility with
decreasing temperature.
In Si, Ge, and GaAs, for example, the mobility increases by a factor of roughly 7 at
77K relative to the value at room temperature, illustrating the dominant role of phonon
scattering in these semiconductors under normal doping conditions.
Since scattering probabilities for different mechanisms add to yield the net scattering
probability which, in turn, defines the overall mean free time between collisions, mobilities
(e.g., phonon scattering mobility and lattice scattering mobility) due to different mechanisms
are combined as µ
−1
= µ
−1
phonon
+ µ
−1
ion
, i.e., the smallest mobility dominates.
The mobility due to lattice scattering depends on the density of ionized impurity sites,
with higher impurity densities leading to shorter distances between scattering sites and
smaller mean free times between collisions. For this reason, the mobility shows a strong de-
pendence on impurity doping levels at temperatures for which such scattering is dominant.
As the ionized impurity density increases, the temperature at which the overall mobility
becomes dominated by impurity scattering increases. In Si at room temperature, for exam-
ple, µ
e
≈ 1400 and µ
p
≈ 500 for dopant concentrations below ≈ 10
15
cm
3
, decreasing to
approximately 300 and 100, respectively, for concentrations > 10
18
cm
3
.
These qualitative statements above can be made substantially more quantitative by
providing detailed plots of mobility vs temperature and vs impurity density for the various
semiconductor materials. Examples of such plots are provided in several references (e.g.,
[1]-[10]).
Diffusion results from a gradient in the carrier density. For example, the flux of electrons
due to diffusion is given by F
e
= −D
n
dn/dx, with F
p
= −D
p
dp/dx for holes. The diffusion
constants D
n
and D
p
are related to the mobilities above by D
n
= µ
n
(k
b
T/e)µ
e
and D
p
=
(k
B
T/e)µ
p
, the so-called Einstein relations. In particular, the mean time between collisions
t
col
determines both the mobility and the diffusion constant.
4.2 Saturated Carrier Velocities
The mobilities discussed above are called “low field” mobilities since they apply only for
sufficiently small electric fields. The low field mobilities represent the scattering from distor-
tions of the perfect lattice, with the electron gaining energy from the electric field between
collisions at such distortion sites. At sufficiently high electric fields, the electron gains suffi-
cient energy to encounter inelastic collisions with the elemental atoms of the perfect crystal.
21
Since the density of such atoms is very high (i.e., compared to the density of scattering sites),
this new mechanism dominates the carrier velocity at sufficiently high fields and causes the
velocity to become independent of the field (i.e., regardless of the electric field strength, the
electron accelerates to a peak velocity at which the inelastic collisions appear and the energy
of the electron is lost). The electric field at which velocities become saturated is referred to
as the critical field E
cr
. Table 10 summarizes the saturated velocities and critical fields for
electrons and holes in Si. The saturated velocities in GaAs and Ge are about 6 ×10
6
cm/sec,
slightly lower than the saturated velocity in Si.
Table 10: Saturated velocity and critical field for Si at room temperature. Adapted from [1].
Saturated velocity Critical electric field
Electrons 1.1 ×10
7
cm/sec 8 ×10
3
V/cm
Holes 9.5 × 10
6
cm/sec 1.95 × 10
4
V/cm
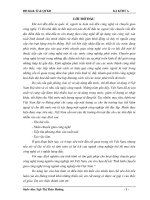
Figure 7 shows representative velocity vs electric field characteristics for electrons in
silicon and in GaAs. The linear dependence at small fields illustrates the low field mobility,
with GaAs having a larger low field mobility than silicon. However, the saturated velocities
v
sat
do not exhibit such a large difference between Si and GaAs. Also, the saturated velocities
do not exhibit as strong a temperature dependence as the low field mobilities (since the
saturated velocities are induced by large electric fields, rather than being perturbations on
thermal velocities).
Figure 7 also exhibits an interesting feature in the case of GaAs. With increasing
electric field, the velocity initially increases beyond the saturated velocity value, falling at
higher electric fields to the saturated velocity. This negative differential mobility region
has been discussed extensively as a potential means of achieving device speeds higher than
would be obtained with fully saturated velocities. Table 11 summarizes the peak velocities
for various semiconductors.
Table 11: Saturated velocity and critical field for various semiconductors.
Semiconductor Peak velocity
(cm/sec)
AsAs 6 ×10
6
AlSb 7 × 10
6
GaP 1.2 × 10
7
GaAs 2 × 10
7
PbTe 1.7 ×10
7
InP 4 ×10
7
InSb 7 ×10
7
As device dimensions have decreased, the saturated velocities have become a more severe
limitation. With critical fields in silicon about 10
4
V/cm, one volt across one micron leads to
22
10
5
10
6
10
7
10
8
10
2
10
3
10
4
10
5
10
6
Electric field (V/cm)
Carrier drift velocity (cm/sec)
GaAs
(electrons)
Si
(electrons)
Si
(holes)
Figure 7: Velocity versus electric field for silicon and GaAs semiconductors. Adapted from
[4].
saturated velocities. Rather than achieving a current proportional to applied voltage (as in
the case of the low field mobility condition), currents become largely independent of voltage
under saturated velocity conditions. In addition, the emergence of saturated velocities also
compromises the speed advantages implied by high mobilities for some semiconductors (e.g.,
GaAs vs Si). In particular, although higher low field velocities generally lead to higher device
speeds under low field conditions, the saturated velocities give similar speed performance at
high electric fields.
5 Crystalline Defects
A variety of defects occur in semiconductor crystals, many of which lead to degradations
in performance and require careful growth and fabrication conditions to minimize their oc-
currence. Other defects are relatively benign. This section summarizes several of the defect
types.
5.1 Point Defects
The point defects correspond to a lattice atom missing from its position. Two distinct
cases appear, as shown in Figure 8. Schottky defects, shown in Figure 8a, result when an
atom is missing from a lattice site. Typically the atom is assumed to have migrated to the
surface (during crystal growth) where it takes a normal position at a surface lattice site. An
23
(a) (b)
energy E
s
is required to move a lattice atom to the crystal surface, that energy serving as an
activation energy for Schottky defects. At temperature T , the equilibrium concentration N
sd
of Schottky defects is given by N
sd
= N
L
exp(−E
sd
/kT ), where N
L
is the density of lattice
atoms, and there is necessarily some non-zero concentration of such defects appearing while
the crystal is at the high temperatures seen during growth. The high temperature defect
densities are “frozen” into the lattice as the crystal cools.
Figure 8: Point defects in semiconductors. (a) Schottky defects. (b) Frenkle defects.
Frenkle defects result when an atom moves away from a lattice site and assumes a
position between lattice sites (i.e., takes an interstitial position), as shown in Figure 8b. The
Frenkle defect therefore corresponds to a pair of defects, namely the empty lattice site and
the extra interstitially positioned atom. The activation energy E
fd
required for formation of
this defect pair again establishes a non-zero equilibrium concentration N
fd
of Frenkle defects
given by N
fd
=
√
N
L
N
I
exp(−E
fd
/kT ). Again, the Frenkle defects tend to form during
crystal growth and are “frozen” into the lattice as the crystal crystallizes.
These point defects significantly impact semiconductor crystals formed mainly through
ionic bonding. However, the covalent bonds of Group IV and the largely covalent bonds of
Group III-V semiconductors are much stronger than ionic bonds, leading to much higher
activation energies for point defects and a correspondingly lower defect density in semicon-
ductors with fully or largely covalent bonds. For this reason, the Schottky and Frenkle
defects are not of primary importance in the electronic behavior of typical IV-IV and III-V
semiconductors.
5.2 Line Defects
Three major types of line defects (edge dislocations, screw dislocations, and antiphase de-
fects) are summarized here. The line defects are generally important factors in the electrical
behavior of semiconductor devices since their influence (as trapping centers, scattering sites,
etc.) extends over distances substantially larger than atomic spacings.
Edge dislocations correspond to an extra plane inserted orthogonal to the growth direc-
tion of a crystal, as illustrated in Figure 8a. The crystalline lattice is disrupted in the region
near where the extra plane starts, leaving behind a line of dangling bonds, as shown. The
dangling bonds can lead to a variety of effects. The atoms at the start of the dislocation
24
(a) (b)
Normal Crystal Crystal with antiphase defect plane
Ga
As
Defect plane
(c)
Figure 9: Line defects. (a) Edge dislocation. (b) Screw dislocation. (c) Antiphase defect.
are missing a shared electron in their outer band, suggesting that they may act as traps,
producing a linear chain of trap sites with interatomic spacings (vastly smaller than normally
encountered between intentionally introduced acceptor impurities. In addition to their im-
pact on the electrical performance, such defects can compromise the mechanical strength of
the crystal.
Screw dislocations result from an extra plane of atoms appearing at the surface. In
this case (illustrated in Figure 8b), the growth process leads to a spiral structure growing
vertically (from the edge of the extra plane. The change in lattice structure over an extended
region as the crystal grows can introduce a variety of changes in the etching properties of
the crystal, degraded junctions, etc. In addition, the dangling bonds act as traps, impacting
electrical characteristics.
Antiphase defects occur in compound semiconductors. Figure 8c illustrates a section of
a III-V semiconductor crystal in which the layers of alternating Ga and As atoms on the right
side is one layer out of phase relative to the layers on the left side. This phase error leads to
bonding defects in the plane joining the two sides, impacting the electrical performance of
devices. Such defects require precision engineering of the growth of large diameter crystals
to ensure that entire planes form simultaneously.
25