Tài liệu User Experience Re-Mastered Your Guide to Getting the Right Design- P3 pdf
Bạn đang xem bản rút gọn của tài liệu. Xem và tải ngay bản đầy đủ của tài liệu tại đây (579.16 KB, 50 trang )
User Experience Re-Mastered: Your Guide to Getting the Right Design
86
me what you are thinking as you are grouping the cards. If you go quiet, I will
prompt you for feedback.”
Whenever participants make a change to a card, we strongly encourage them to
tell us about it. It helps us to understand why they are making the change. In a
group session, it offers us the opportunity to discuss the change with the group.
We typically ask questions like
John just made a good point. He refers to a “travel reservation” as a “travel
booking.” Does anyone else call it that?
or
Jane noticed that “couples-only resorts” is missing. Does anyone else book
“couples-only resorts?”
If anyone nods in agreement, we ask him/her to discuss the issue. We then ask
all the participants who agree to make the same change to their card(s). Par-
ticipants may not think to make a change until it is brought to their attention,
otherwise they may believe they are the only ones who feel a certain way and
do not want to be “different.” Encouraging the discussion helps us to decide
whether an issue is pervasive or limited to only one individual.
Participants typically make terminology and defi nition changes while they are
reviewing the cards. They may also notice objects that do not belong and remove
them during the review process. Most often, adding missing cards
and deleting cards that do not belong are not done until
the sorting stage – as participants begin to organize the
information.
Labeling Groups
Once the sorting is complete, the participants
need to name each of the groups. Give the fol-
lowing instructions:
Now I would like for you to name each of your
groups. How would you describe the cards in
each of these piles? You can use a single word,
phrase, or sentence. Please write the name of
each group on one of the blank cards and place
it on top of the group. Once you have fi nished,
please staple each group together, or if it is too
large to staple, use a rubber band. Finally, place all of
your bound groups in the envelope provided.
DATA ANALYSIS AND INTERPRETATION
There are several ways to analyze the plethora of data you will collect in
a card sort exercise. We describe here how to analyze the data via pro-
grams designed specifically for card sort analysis as well as with statistical
TIP
We prefer to
staple the groups
together because we do not
want cards falling out. If your
cards get mixed with others, your
data will be ruined; so make sure
your groups are secured and that each
participant’s groups remain separate!
We mark each envelope with the
participant’s number and seal it until
it is time to analyze the data. This
prevents cards from being
confused between
participants.
Please purchase PDF Split-Merge on www.verypdf.com to remove this watermark.
Card Sorting
CHAPTER 3
87
packages (e.g., SPSS, SAS, STATISTICA ™ ) and spreadsheets. We also show
how to analyze data that computer programs cannot handle. Finally, we
walk you through an example to demonstrate how to interpret the results of
your study.
When testing a small number of participants (four or less) and a limited num-
ber of cards, some evaluators simply “eyeball” the card groupings. This is not
precise and can quickly become unmanageable when the number of partici-
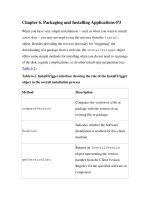
pants increases. Cluster analysis allows you to quantify the data by calculat-
ing the strength of the perceived relationships between pairs of cards, based
on the frequency with which members of each possible pair appear together.
In other words, how frequently did participants pair two cards together in the
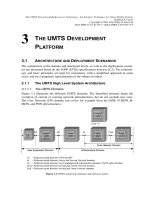
same group? The results are usually presented in a tree diagram or dendrogram
(see Figs 3.4 and 3.5 for two examples). This presents the distance between
pairs of objects, with 0.00 being closest and 1.00 being the maximum distance.
A distance of 1.00 means that none of the participants paired the two particu-
lar cards together; whereas 0.00 means that every participant paired those two
cards together.
FIGURE 3.4
Dendrogram for our
travel Web site using
EZCalc.
Books
Links to travel gear sites
Luggage
Travel games
Family friendly travel information
Currency
Languages
Tipping information
Featured destinations
Travel alerts
Travel deals
Weekly travel polls
Chat with travel agents
Chat with travelers
Post and read questions on bulletin boards
Rate destinations
Read reviews
(Average)
0.50 1.00
Please purchase PDF Split-Merge on www.verypdf.com to remove this watermark.
User Experience Re-Mastered: Your Guide to Getting the Right Design
88
Create a new message
Send current message
Attach file to a message
Spell-check current message
Reply to a message
Forward a message
Print a message
Get new messages
View next message
Delete a message
Save message to a file
Append message to a file
Create a new folder
Delete an existing folder
Rename an existing folder
View another folder
Overview of folders
Delete the trash folder
Move message between folders
Copy message between folders
Overview of messages in folder
0
2000
Complete linkageSingle linkage
4000
6000
8000
10000
12000
14000
16000
18000
20000
22000
24000
26000
28000
FIGURE 3.5
Tree diagram of
WebCAT data analysis
for an e-mail system.
BRIEF DESCRIPTION OF HOW PROGRAMS
CLUSTER ITEMS
Cluster analysis can be complex, but we can describe it only briefl y here. To learn more
about it, refer to Aldenderfer and Blashfi eld (1984), Lewis (1991), or Romesburg (1984).
The actual math behind cluster analysis can vary a bit, but the technique used in most
computer programs is called the “amalgamation” method. Clustering begins with every
item being its own single-item cluster. Let’s continue with our travel example. Below are
eight items from a card sort:
Participants sort the items into groups. Then every item’s difference score with every
other item is computed (i.e., considered pair-by-pair). Those with the closest (smallest)
difference scores are then joined. The more participants who paired two items together,
Hotel reservation Airplane ticket Rental auto Rental drop-off
point
Frequent-guest
credit
Frequent-fl yer
miles
Rental pick-up
point
Featured
destinations
Please purchase PDF Split-Merge on www.verypdf.com to remove this watermark.
Card Sorting
CHAPTER 3
89
the shorter the distance. However, not all the items are necessarily paired at this step. It
is entirely possible (and in fact most probable) that some or many items will not be joined
with anything until a later “round” or more than two items may be joined. So after Round 1,
you may have the following:
Hotel reservation and frequent-guest credit ■
Airplane ticket and frequent-fl yer miles ■
Rental auto, pick-up point, and drop-off point ■
Featured destinations ■
Now that you have several groups comprised of items, the question is “How do you con-
tinue to join clusters?” There are several different amalgamation (or linkage) rules available
to decide how groups should next be clustered, and some programs allow you to choose
the rule used. Below is a description of three common rules.
Single Linkage
If any members of the groups are very similar (i.e., small distance score because many
participants have sorted them together), the groups will be joined. So if “frequent-guest
credit” and “frequent-fl yer miles” are extremely similar, it does not matter how different
“hotel reservation” is from “airplane ticket” (see Round 1 groupings above); they will be
grouped in Round 2.
This method is commonly called the “nearest neighbor” method, because it takes only two
near neighbors to join both groups. Single linkage is useful for producing long strings of
loosely related clusters. It focuses on the similarities among groups.
Complete Linkage
This is effectively the opposite of single linkage. Complete linkage considers the most
dissimilar pair of items when determining whether to join groups. Therefore, it doesn’t mat-
ter how extremely similar “frequent-guest credit” and “frequent-fl yer miles” are; if “hotel
reservation” and “airplane ticket” are extremely dissimilar (because few participants sorted
them together), they will not be joined into the same cluster at this stage (see “Round 1”
groupings above).
Not surprisingly, this method is commonly called the “furthest neighbor” method, because
the joining rule considers the difference score of the most dissimilar (i.e., largest difference)
pairs. Complete linkage is useful for producing very tightly related groups.
Average Linkage
This method attempts to balance the two methods above by taking the average of the
difference scores for all the pairs when deciding whether groups should be joined. So
the difference in score between “frequent-guest credit” and “frequent-fl yer miles” may
be low (very similar), and the difference score of “hotel reservation” and “airplane ticket”
may be high but, when averaged, the overall difference score will be somewhere in the
middle (see Round 1 groupings above). Now the program will look at the averaged score
to decide whether “hotel reservation” and “frequent-guest credit” should be joined with
“airplane ticket” and “frequent-fl yer miles” or whether the fi rst group is closer to the third
group, “rental auto” and “rental pick-up point.”
Please purchase PDF Split-Merge on www.verypdf.com to remove this watermark.
User Experience Re-Mastered: Your Guide to Getting the Right Design
90
SUGGESTED RESOURCES FOR ADDITIONAL
READING
If you would like to learn more about cluster analysis, you can refer to:
Aldenderfer, M. S. & Blashfi eld, R. K. (1984). ■ Cluster analysis. Sage
University paper series on quantitative applications in the social sciences,
No. 07-044. Beverly Hills, (CA): Sage Publications.
Lewis, S. (1991). Cluster analysis as a technique to guide interface design. ■
Journal of Man-Machine Studies, 10 , 267–280.
Romesburg, C. H. (1984). ■ Cluster analysis for researchers. Belmont, (CA):
Lifetime Learning Publications (Wadsworth).
You can analyze the data from a card sort with a software program specifi cally
designed for card sorting or with any standard statistics package. We will describe
each of the programs available and why you would use it.
Analysis with a Card Sorting Program
At the time of publication, there are at least four programs available on ■
the Web that are designed specifi cally for analyzing card sort data: NIST’s
WebCAT® ( )
WebSort ( ) ■
CardZort/CardCluster ( ■
cardzort.htm )
XSort ( ) ■
UserZoom ( ) ■
OptimalSort ( ) ■
Data analysis using these tools has been found to be quicker and easier than
using manual methods (Zavod, Rickert & Brown, 2002).
Analysis with a Statistics Package
Statistical packages like SAS, SPSS, and STATISTICA are not as easy to use
as specialized card sort programs when analyzing card sort data; but when
you have over 100 cards in a sort, some packages cannot be used. A program
like SPSS is necessary, but any package that has cluster analysis capabilities
will do.
Analysis with a Spreadsheet Package
Most card sort programs have a maximum number of cards that they can
support. If you have a very large set of cards, a spreadsheet (e.g., Microsoft
Excel) can be used for analysis. The discussion of how to accomplish this
is complex and beyond the scope of this book. You can fi nd an excellent,
step-by-step description of analyzing the data with a spreadsheet tool at
http://www. boxesandarrows.com/view/analyzing_card_sort_results_with_a_
spreadsheet_ template .
Please purchase PDF Split-Merge on www.verypdf.com to remove this watermark.
Card Sorting
CHAPTER 3
91
Data That Computer Programs Cannot Handle
Computer programs can be great, but they often do not do all the analysis for
you. Below are some of the issues that we have encountered when using differ-
ent electronic programs. Although the data analysis for these elements is a little
awkward, we think the value that the data bring makes them worth collecting.
ADDING OR RENAMING OBJECTS
One of the basic requirements of cluster analysis is that all participants must
have the exact set of cards in terms of name and number. If participants renamed
any of the objects or if they added any cards, you will not be able to add this
information into the program. You will need to record this information for each
participant on a sheet of paper and analyze it separately. The number of cards
added or changed tends to be very small but it is an extra step to take. Returning
to our earlier example, you notice that Participant 1 added the object “airport
code.” Write this down and then tally the number of other participants who did
the same thing. At the end, you will likely have a small list of added and renamed
objects, along with the number of participants who made those changes. Based
on the number of participants who added it, you can assess its importance.
GROUP NAMES
The group names that participants provide are not presented in the analysis. You
will need to record the pile names that participants suggested and do your best
to match them to the results. We typically write down the names of each group
for each participant and look for similarities at the end. How many participants
created an “Airline Travel” group? How many created a “Hotel” group? When
examining the dendrogram, you will notice clusters of objects. See if there is
a match between those clusters and the names of the groups that participants
created.
DUPLICATE OBJECTS
As we discussed earlier, sometimes participants ask to place an item in multiple
locations. Because the computer programs available do not allow you to enter
the same card more than once and you must have the same number of cards for
each participant, include the original card in the group the participant placed
it. The duplicate cards placed in the secondary groups will have to be examined
and noted manually.
DELETED OBJECTS
EZCalc is the only program we are aware of that can handle discards automati-
cally, but IBM has pulled EZCalc off its main site. The only location for down-
loading EZCalc is . Many computer
programs cannot deal with deleted cards. For these programs, if you have allowed
participants to create a discard or miscellaneous pile of cards that they do not
believe belong in the sort, there is a workaround you need to do. You cannot
enter this collection of discarded cards as a group into a computer program since
Please purchase PDF Split-Merge on www.verypdf.com to remove this watermark.
User Experience Re-Mastered: Your Guide to Getting the Right Design
92
the cluster analysis would treat these cards as a group of objects that participants
believe are related. In reality, these cards are not related to any of the other cards.
Place each rejected card in a group by itself to demonstrate that it is not related
to any other card in the cluster analysis. For example, if participants placed
“Frequent-Flyer Miles,” “Companions,” and “Meal Requests” in the discard pile,
you should enter “Frequent-Flyer Miles” in one group, “Companions” in a sec-
ond group, and “Meal Requests” in a third group.
Interpreting the Results
You now have a collection of rich data. The dendrogram displays groups of
objects that the majority of participants believe belong together.
Changes that participants make to cards can make interpretation of the results
tricky. When a deleted object is repeatedly placed in a group by itself (or left out,
in the case of EZCalc) , you may see it on a branch by itself or loosely attached
to a group that it really doesn’t belong with. Additionally, if participants place
an object in multiple groups, they may not have agreed on the “best” location
to place it. Consequently, you may fi nd the object is living on a branch by itself
or loosely attached to a group that it really doesn’t belong with. You must use
your knowledge of the domain or product to make adjustments when ambigu-
ity exists. Use the additional data you collected like new objects, group names,
changed terminology, and think-aloud data to help interpret the data.
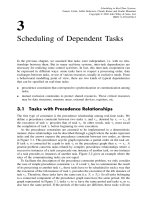
Let’s walk through our travel example and interpret the results of our dendrogram
shown earlier in Fig. 3.4 . Using our domain knowledge and the group labels
participants provided in the card sort, we have named each of the clusters in
the dendrogram (see Fig. 3.6 ). We appear to have four clear groups: “Products,”
“Resources,” “News,” and “Opinions.”
It is important to note that the card sort methodology will not provide you with
information about the type of architecture you should use (e.g., tabs, menus).
This decision must be made by a design professional. Instead, the tree diagram
demonstrates how participants expect to fi nd information grouped. In the case
of a Web-based application with tabs, the tree may present the recommended
name of the tab and the elements that should be contained within that particu-
lar tab.
Now, you should examine the list of changes that participants made (e.g., renamed
cards, additional cards) to discover whether there is high agreement among
participants.
What objects did participants feel you were missing? ■
What objects did participants feel did not belong? ■
What are all the terminology changes participants made? ■
What defi nitions did participants change? ■
What items did users want in multiple locations? ■
Use this information to determine whether your product needs to add or
remove information or tasks to be useful to participants. You may recommend
Please purchase PDF Split-Merge on www.verypdf.com to remove this watermark.
Card Sorting
CHAPTER 3
93
to the team that they conduct a competitive analysis (if they haven’t already) to
discover whether other products support such functionality. Similarly, use the
information about deleted objects to recommend the team to examine whether
specifi c information or tasks are unnecessary.
Terminology can be specifi c to a company, area of the country, or individual. With
each terminology change, you will need to investigate whether it is a “standard” –
and therefore needs to be incorporated – or whether there are several different
possible terms. When several terms exist, you will want to use the most common
term but allow your product to be customized so that it is clear to all your users.
Finally, examine the defi nition changes. Were the changes minor – simply an
issue of clarifi cation? If so, there isn’t anything to change in your product. If, how-
ever, there were many changes, you have an issue. This may mean that the prod-
uct development team does not have a good grasp of the domain or that there is
disagreement within the team about what certain features of the product do.
COMMUNICATE THE FINDINGS
Preparing to Communicate Your Findings
The specifi c data that you communicate to product teams can vary depending
upon the activity you conducted, but some elements of how you communicate
the results are the same regardless of the method.
FIGURE 3.6
Dendrogram of a
travel Web site card
sort with group names
added.
Books
Links to travel gear sites
Luggage
Travel games
Family friendly travel information
Currency
Languages
Tipping information
Featured destinations
Travel alerts
Travel deals
Weekly travel polls
Chat with travel agents
Chat with travelers
Post and read questions on bulletin boards
Rate destinations
Read reviews
(Average)
0.50 1.00
Products
Resources
News
Opinions
Please purchase PDF Split-Merge on www.verypdf.com to remove this watermark.
User Experience Re-Mastered: Your Guide to Getting the Right Design
94
When we present the results of a card sort
analysis to executives or teams, we present the
actual dendrogram generated by the applica-
tion (as in Fig. 3.6 ) and a simple table to review
(see Fig. 3.7 ). We also present a table of changes
that participants made to the cards (added
objects, deleted objects, terminology changes,
and defi nition changes) and any sketches the
designers may have produced to illustrate the
recommendations.
As with all the other user requirement methodolo-
gies, the card sort is a valuable addition to your
software requirement documentation. These results
can be incorporated into documentation such as
the Detailed Design Document. Ideally, additional
user requirement techniques should be used along the way to capture new require-
ments and verify your current requirements.
MODIFICATIONS
Below are a few modifi cations on the card sorting technique we have presented.
You can limit the number of groups users can create, use computerized tools for
the sort instead of physical cards, provide the groups for users to place the cards
in, ask users to describe the items they would fi nd in a particular category, or
physically place groups that are related closer to each other.
Limit the Number of Groups
You may need to limit the number of groups a participant can create. For exam-
ple, if you are designing a Web site and your company has a standard of no
more than seven tabs, you can ask participants to create seven or fewer groups.
Alternatively, you can initially allow participants to group the cards as they see
fi t; then, if they create more than seven groups, ask them to regroup their cards
into higher-level groups. In the second case, you should staple all the lower-level
groups together and then bind the higher-level groups together with a rubber
band. This will allow you to see and analyze both levels of groupings.
Electronic Card Sorting
There are tools available that allow users to sort the cards electronically rather
than using physical cards (e.g., OptimalSort, WebSort, xSort, and CardZort). Elec-
tronic card sorting can save you time during the data analysis phase because
the sorts are automatically saved in the computer. Another advantage is that,
depending on the number of cards, users can see all the cards available for sort-
ing at the same time. Unless you have a very large work surface for users to
spread their physical cards on, this is not possible for manual card sorts. Elec-
tronic sorting has the disadvantage that, if you run a group session, you will
FIGURE 3.7
Travel card sort table
of recommendations.
Tab name
Resources
Languages
Currency
Family friendly travel information
News
Travel alerts
Featured destinations
Weekly travel polls
Opinions
Post and read questions on bulletin boards
Chat with travel agents
Rate destinations
Products
Luggage
Books
Links to travel gear sites
Objects to be located within the tab
Tipping information
Travel deals
Read reviews
Travel games
Please purchase PDF Split-Merge on www.verypdf.com to remove this watermark.
Card Sorting
CHAPTER 3
95
need a separate computer for each participant. This means money and potential
technical issues. In addition, you need to provide a brief training session to
explain how to use the software. Even with training, the user interface may be
diffi cult for users to get the hang of.
Some tools support remote testing, which allows you to gather data from users
anywhere. However, users may have a more diffi cult time without a facilitator in
the room to answer questions.
Unfortunately, none of the computer-based programs provides a defi nition with
the objects. Also, they do not allow users to add, delete, or rename the objects.
In our opinion, this is a serious shortcoming of the tools and the reason why we
do not use them.
SUGGESTED RESOURCES FOR ADDITIONAL
READING
Prename the Groups
You may already know the buckets that the objects being sorted must fi t into.
Going back to our Web site example, if you cannot completely redesign your
site, you may want to provide participants with the names of each tab, section,
or page of your site. Provide participants with a “placemat” for each group. The
placemat should state the name of the group and provide a clear description of
it. Participants would then be tasked with determining what objects fi t into the
predetermined groups.
To go one step further, you may have the structure for your entire application
already laid out and simply want to fi nd out whether you are correct.
The article below provides a nice comparison of some of the automated card sorting tools
available (at the time of publication) if electronic card sorting is of interest to you:
Zavod, M. J., Rickert, D. E. & Brown, S. H. (2002). The automated card-sort as an ■
interface design tool: A comparison of products. In : Proceedings of the human
factors and ergonomics society 46th annual meeting, Baltimore, MD,
30 September–4 October, pp. 646–650.
EDITOR’S NOTE: CLOSED AND REVERSE CARD SORTING
The last example where you provide users with the names of categories and then put items
into those categories is called closed card sorting. Closed sorting is useful when you are
verifying an existing hierarchy or structure (e.g., the main menu of an application or Web
site) or adding new items to an existing structure. Closed sorting can be a follow-up to
open sorting and be used to validate the categories that emerged from the open sorting.
Please purchase PDF Split-Merge on www.verypdf.com to remove this watermark.
User Experience Re-Mastered: Your Guide to Getting the Right Design
96
LESSONS LEARNED
The fi rst time we used EZSort (IBM’s predecessor to USort/EZCalc ) , we did
not know that the program would choke if given over 90 cards. We prepared
the material, ran the study, and then entered the data for 12 participants and
92 cards. When we press the button to compute the results, it blew up. There was
no warning and nothing to prevent us from making the mistake. It took exten-
sive investigation to determine the cause of the problem, including contacting
the creators of EZSort. By that point, there wasn’t much we could do. We were
forced to divide the data, enter it in chunks, and compute it. This had to be done
several times so that the data overlapped. This was a painful lesson to learn. Rest
assured that we never use a free program now without thoroughly reviewing the
“Release Notes” and Web site from where we downloaded the program. We also
look for other documents such as “Known Bugs.”
PULLING IT ALL TOGETHER
In this chapter, we have discussed what a card sort is, when you should conduct
one, and things to be aware of. We also discussed how to prepare for and con-
duct a card sort, along with several modifi cations. Finally, we have demonstrated
Reverse card sorting is similar to closed sorting. In reverse card sorting, participants are
asked to place cards that represent navigation items onto a diagram of a hierarchy (or
other structure) and optionally, rate how certain they are that they are putting the card
into the “right” place on the hierarchy. The average percentage of cards that are sorted
into the correct place in the hierarchy would indicate how well your users understand
the structure. This method is useful for validating changes to Web site navigation or task
structures. Human Factors International, for example, used reverse card sorting to com-
pare an old design with a new design of a Web site. In their study, “… 96 percent of the
users understood the new site’s categorizations and task groupings, compared with only
45 percent on the old design” (Human Factors International, ND, anfac-
tors.com/about/arinc.asp ).
Ginny Redish conducted a card sort for the National Cancer
Institute’s Division of Cancer Prevention. Since she does
not work for the National Cancer Institute, she describes
how she worked as a consultant with the development team
and gained the domain knowledge necessary to conduct
the card sort. She describes in wonderful detail the process
of understanding the user profi le, identifying the objects
for sorting, creating the materials, and recruiting the par-
ticipants. She provides a unique perspective because she
conducted the sort individually with think-aloud protocol
and opted not to use cluster analysis software.
Case Study
Please purchase PDF Split-Merge on www.verypdf.com to remove this watermark.
Card Sorting
CHAPTER 3
97
various ways to analyze the data and used our travel example to show you how
to interpret and present the results.
Below, Ginny Redish presents a case study to share with readers how she recently
employed a card sort to build the information architecture for a government
Web site.
HOW CARD SORTING CHANGED A WEB SITE TEAM’S
VIEW OF HOW THE SITE SHOULD BE ORGANIZED
Janice (Ginny) Redish
Redish & Associates, Inc.
This case study is about the Web site of the U.S. National Cancer Institute’s
Division of Cancer Prevention. When the study began, the division’s Web site
focused on its mission and internal organization (see Fig. 3.8 ).
Our Approach
I was brought in as a consultant to help the division’s Web project team revise
the site. They knew it needed to change, and the division’s new Communica-
tions Manager, Kara Smigel-Croker, understood that it did not have the public
focus that it needed.
We began by having me facilitate a two-hour meeting of the division’s Web proj-
ect team at which we discussed and listed the purposes of the site and the many
user groups the site must serve.
Although the site, at that time, refl ected the organization of the division and the
research that it funds, the project team agreed that the mission of the Web site was
to be the primary place that people come to for information on preventing cancer.
FIGURE 3.8
The Web site before
card sorting.
Please purchase PDF Split-Merge on www.verypdf.com to remove this watermark.
User Experience Re-Mastered: Your Guide to Getting the Right Design
98
When we listed audiences, we found many potential users – from the public to
medical professionals to researchers to students – and, of course, realized that
there would be a wide range of knowledge and experience within each of these
audiences.
In addition to listing purposes and audiences, the third activity in our initial
meeting was to understand the scenarios that users would bring to the site.
I handed out index cards, and each member of the project team wrote a sample
scenario. The most interesting and exciting result was that after just our brief
discussions of purposes and audiences, 17 of 18 members of the project team
wrote a scenario about a member of the public coming for information about
preventing cancer, even though, at that time, there was almost no information
on the site for the general public! (The eighteenth scenario was about a gradu-
ate student seeking a postdoctoral fellowship – a very legitimate scenario for the
Web site.)
The stage was now set for card sorting. The project team agreed that card sorting
was the way to fi nd out how members of the public and medical professionals
would look for information on the site.
Planning and Preparing for the Card Sorting
Members of the project team wrote cards for topics. In addition to the top-
ics from each research group and from the offi ce that handles fellowships, we
added cards for types of cancer and for articles that existed elsewhere in the
many National Cancer Institute Web sites to which we could link.
HOW MANY CARDS?
We ended up with 300 cards – many more than we could expect users to sort in
an hour. How did we winnow them down? We used examples rather than hav-
ing a card for every possible instance of a type of topic or type of document.
For example, although there are many types of cancer, we limited the cards to
about 10 types. For each type of cancer, you might have information about pre-
vention, screening, clinical trials, etc. Instead of having a card for each of these
for each type of cancer, we had these cards for only two types of cancer – and our
card sorters quickly got the point that the fi nal Web site would have comparable
entries for each type of cancer. Instead of having a card for every research study,
we had examples of research studies.
Even with the winnowing, we had about 100 cards – and that was still a lot for
some of our users. An ideal card sorting set seems to be about 40–60 cards.
WHAT DID THE CARDS LOOK LIKE?
Figure 3.9 shows examples of the cards. Each topic went on a separate 3 ϫ 5 inch.
white index card. We typed the topics in the template of a page of stick-on labels,
printed the topics on label paper, and stuck them onto the cards – one topic per card.
We created two “decks” of cards so that we could have back-to-back sessions.
Please purchase PDF Split-Merge on www.verypdf.com to remove this watermark.
Card Sorting
CHAPTER 3
99
FIGURE 3.9
Examples of the cards
used.
Skin Cancer
SELECT
DCP Staff Bios
Cancer Prevention
Fellowship programs
Promotional information for
breast cancer prevention study
with tamoxifen and raloxifene
Summary on cancer risks
from smoking cigarettes
We also numbered the topics, putting the appropriate number on the back of
each card. Numbering is for ease of analysis and for being able to have back-to-
back sessions. Here’s how it worked. In hour 1, Participant 1 sorted Deck 1. In
hour 2, Participant 2 sorted Deck 2 while someone copied down what Partici-
pant 1 did, using the numbers on the back of the cards to quickly write down
what topics Participant 1 put into the same pile. Deck 1 was then reshuffl ed for
use in hour 3 by Participant 3, and so on.
With stick-on labels and numbers for the topics, you can make several decks of
the cards and have sessions going simultaneously as well as consecutively.
RECRUITING USERS FOR THE CARD SORTING
We had two groups of users:
Eight people from outside who came one at a time for an hour each ■
About 12 people from inside – from the project team – who came either ■
singly or in pairs for an hour each; pairs worked together, sorting one
set of cards while discussing what they were doing – like codiscovery in
usability testing
The National Cancer Institute worked with a recruiting fi rm to bring in can-
cer patients/survivors, family members of cancer patients/survivors, members
of the public interested in cancer, doctors, and other health professionals. Our
eight external users included people from each of these categories. The external
people were paid for their time.
CONDUCTING THE CARD SORTING SESSIONS
The only real logistic need for card sorting is a large table so that the par-
ticipant can spread out the cards. We held sessions in an empty offi ce
with a large desk, in a conference room, and on a round conference table
Please purchase PDF Split-Merge on www.verypdf.com to remove this watermark.
User Experience Re-Mastered: Your Guide to Getting the Right Design
100
in another offi ce. The conference room table worked best; one participant
especially liked the chair on wheels so he could roll up and down next to
the table looking at his groupings. Other participants sorted the cards stand-
ing up so they could reach along the table to work with the cards they had
already put out.
In addition to the deck of cards with topics on them, we also had:
Extra white cards for adding topics
■
Sticky notes for indicating cross-links (when participants wanted a ■
topic to be in two places, we asked them to put it in the primary place
and write a sticky note to indicate what other group should have a
link to it)
Cards in a color for putting names on the groups at the end ■
Rubber bands for keeping each group of cards together at the end ■
Pens for writing new topics, cross-links, and group names ■
The instructions for card sorting are very simple. You put the fi rst card on the
table. You then look at the second card and decide whether it goes into the
same group as the fi rst or not. If yes, you put the two cards together. If no, you
start a second pile. And so on. Participants had no diffi culty understanding
what to do.
We also explained that we were building the home page and navigation for a
Web site. This gave participants a sense of about how many piles (groups) it
would make sense to end up with.
Participants were also told that they could:
Rearrange the cards and groups as they went – that’s why the topics are ■
on separate cards
Reject a card – put it aside or throw it on the fl oor – if they did not know ■
what it meant or if they did not think that it belonged on the site
Write a card if they thought a topic was missing ■
Write a sticky note if they would put the card in one group but also have ■
a link to it from another group
We encouraged the participants to think-aloud, and we took notes. However, we
found that the notes we have from think-aloud in card sorting are not nearly as
rich as those we have from usability testing and that the card sorts themselves
hold the rich data. Therefore, we have done card sorting studies for other proj-
ects in which we have run simultaneous sessions without a note-taker in each
– and thus without anyone listening to a think-aloud. (We did not tape these
sessions.) In these other projects, several sorters worked at the same time, but
each worked independently, in different rooms, with the facilitator just checking
in with each card sorter from time to time and doing a debrief interview as each
person fi nished.
Please purchase PDF Split-Merge on www.verypdf.com to remove this watermark.
Card Sorting
CHAPTER 3
101
When the participants had sorted all the cards, we gave them the colored cards
and asked them to name each of their groups. We also asked them to place the
groups on the table in the approximate confi guration that they would expect to
fi nd the groups on the home page of a Web site.
The Analysis
In this study, we found that we did not need to do a formal analysis of the data
to meet our goals of understanding at a high level what categories people wanted
on the home page, where on the home page they would put each category, and
the general type of information (topics) that they would expect in each category.
We did not do a formal analysis with complex cluster analysis software for at
least four reasons:
This was a very small study – eight users. ■
We were looking only at the top level of an information architecture. Our in- ■
terest was the home-page categories with names and placement on the page
for those categories and a general sense for
the types of information that would go in
each category. We were not doing an entire
information architecture or putting every
underlying piece of content into a category.
This was just one step in an iterative pro- ■
cess. Our goal was to get input for a proto-
type that we would take to usability testing.
The project continued through several
rounds of prototypes and usability testing.
It was obvious as soon as the sessions ■
were over that there was incredibly high
agreement among the users on the catego-
ries, names, and placements.
If any of these four had not been the case, a for-
mal analysis with one of the available software
tools would have been imperative.
We put each person’s results on a separate piece
of paper – with the group (category) names in
the place they would put it (see Fig. 3.10 ).
We spread these pages out on a conference room
table and looked them over for similarities and
differences. The similarities were very striking, so
we took that as input to a fi rst prototype of a new
Web site, which we then refi ned during iterative
usability testing.
FIGURE 3.10
Example sketch of one user’s placement and names for
categories.
Please purchase PDF Split-Merge on www.verypdf.com to remove this watermark.
User Experience Re-Mastered: Your Guide to Getting the Right Design
102
Main Findings
ACHIEVING CONSENSUS
Card sorting can produce a high degree of consensus about what a home page
should look like. In this case, looking just at the eight external card sorters’ topics
for the home page:
Seven had types of cancer or some variant – and they put it in the upper ■
left corner of the page.
Six participants had prevention or lifestyle or some variant. This category ■
included topics such as exercise, tobacco cessation, nutrition, eating hab-
its, as well as general information about preventing cancer.
Five participants had clinical trials or some variant. They wanted a main ■
entry to all the clinical trials as well as a link to each from the relevant
type of cancer.
Six participants had ■ About NCI DCP or Administration. This category
included the mission statement, organization chart, directory, etc.
Although two of the eight participants also wanted a very brief
mission statement with a link in the upper left corner of the home
page, all six put the About NCI DCP category in the lower right of
the page.
OPENING INTERNAL USERS’ EYES
The technique itself can open the eyes of internal users to the problems with the
way the site is currently designed.
The participants from the Web project team (the internal users) all started by
sorting cards into their organizational groups, creating once again the old Web
site. However, after fi ve to 10 minutes (and sometimes with a bit of prodding
to “think about the users and scenarios you wrote in the meeting”), they made
comments like this: “How would someone from the public know that you have
to look under [this specifi c research group] to fi nd out about that?”; “The public
would want to look up a specifi c type of cancer.”; “The public would want to
look up information about diet or nutrition.”
In the end, each of the internal users came to very similar groupings as the
public. They also realized on their own that information about the organiza-
tion would not be the most important reason people came to the site. Like
the public users, they put the About NCI DCP category in the lower right of
the page.
If you think of internal users as “developers,” you may wonder whether it was
wise to let them do the card sorting. Of course, you do not want to have the
developers (or internal users) be the only card sorters. The primary audience for
the site must be the primary participants in any card sorting study.
Please purchase PDF Split-Merge on www.verypdf.com to remove this watermark.
Card Sorting
CHAPTER 3
103
In this case, however, the internal users were very curious about the technique.
They wanted to try it, too. If we could have set up the card sorting sessions with
the project team as observers (as we typically do for a usability test), that might
have satisfi ed their curiosity. However, we did not have the facilities for observa-
tion for this particular study, so we decided to let them try the card sorting for
themselves.
The danger, of course, was that they would remain in their own frame and not
get beyond creating once again the site they knew. Just a little prodding to “think
about the users,” however, made these internal project team members realize for
themselves both that they could put themselves into the users’ frame and that,
once in that frame, they could see how the users would want the site to be orga-
nized. Letting the internal people also do the card sorting might not always be
wise; but in this case, for many of them, it was a “lightbulb moment” that made
them empathize even more with the external users.
DISCOVERING GAPS IN UNDERSTANDING
With card sorting, you can fi nd out about words that users do not know. All
the external card sorters ended up with some cards in a pile of “I can’t sort this
because I don’t know what it means.”
The most common cards in that pile were ones with acronyms like ALTS, STAR,
SELECT. Others were words like “biomarkers” and “chemoprevention.” This was
a huge surprise to many of the NCI researchers. It was a critical learning for
them; the acronyms refer to clinical trials that the division is funding. Informa-
tion about these clinical trials is one of the great values of the site, but people
will not fi nd the information if it is hidden under an acronym that they do not
recognize.
GETTING A BETTER UNDERSTANDING OF CARD SORTING
Card sorting is like usability testing in that you have to be concerned about
recruiting representative users, but it is logistically easier than usability testing.
You need only a conference table, cards, someone to get the user going and – if
you are running consecutive sessions – someone to record what each partici-
pant has done and reshuffl e the cards for another participant. The diffi cult part
of card sorting is deciding on the topics to include and limiting the number of
cards by choosing good exemplars of lower-level content rather than including
every single article that might be on the site.
What Happened to the Web site?
Figure 3.11 is the “after” version that was launched in the summer of 2001. (The
current site at is a later update following
NCI’s adoption of new look and feel standards.)
Please purchase PDF Split-Merge on www.verypdf.com to remove this watermark.
User Experience Re-Mastered: Your Guide to Getting the Right Design
104
ACKNOWLEDGMENTS
My time as a consultant to the NCI Division of Cancer Prevention (DCP) came
through my work with the NCI Communication Technologies Branch (CTB) in
the NCI Offi ce of Communication. NCI is part of the U.S. National Institutes
of Health, Department of Health and Human Services. I thank Kara Smigel-
Croker (DCP Communications Manager) for leading this project and Madhu
Joshi (who was a CTB Technology Transfer Fellow at the time) for handling all
logistics and support.
FIGURE 3.11
The Web site
after card sorting,
prototyping, and
iterative usability
testing.
Please purchase PDF Split-Merge on www.verypdf.com to remove this watermark.
PART 2
PART 2
Generating Ideas
Please purchase PDF Split-Merge on www.verypdf.com to remove this watermark.
This page intentionally left blank
Please purchase PDF Split-Merge on www.verypdf.com to remove this watermark.
107
CHAPTER 4
CHAPTER 4
Brainstorming
Chauncey Wilson
INTRODUCTION
Brainstorming is an individual or group method for generating ideas, increas-
ing creative effi cacy, or fi nding solutions to problems. This chapter focuses on
group brainstorming where participants generate ideas on a particular topic or
problem in a nonjudgmental environment following a set of ground rules. The
basic procedure for group brainstorming involves the following:
Selecting a group of three to 10 participants with different backgrounds 1.
Posing a clear problem, question, or topic to the group 2.
Asking the group to generate solutions or ideas with no criticism or 3.
attempts to limit the type and number of ideas
EDITOR’S COMMENTS
Nearly every organization engages in “brainstorming,” but few do it effectively. There is a
belief (you might call it a myth) that brainstorming is easy; but in fact, good brainstorming
is a complex social activity where there is evaluation apprehension, behaviors that can
block the production of ideas, and the reality that only one person can present an idea
while the other 10 people are trying to remember their ideas. This chapter describes how
to plan and conduct good group brainstorming sessions. You will fi nd dozens of tips,
guidelines, and ground rules that will increase the quantity of ideas that emerge from your
brainstorming sessions. Good brainstorming!
Copyright
©
2010 Elsevier, Inc. All rights Reserved.
Please purchase PDF Split-Merge on www.verypdf.com to remove this watermark.
User Experience Re-Mastered: Your Guide to Getting the Right Design
108
Discussing, critiquing, and possibly prioritizing the brainstorming 4.
results for subsequent action (this last step is often called the “conver-
gent” phase where there is a winnowing of all the ideas into the ones
that are judged as most applicable to a problem)
Variations on this group brainstorming procedure can be used to gather ideas
from large groups, geographically dispersed individuals, or participants who are
inhibited by their personality, the social environment, or cultural norms. These
variations are described later in this chapter.
Alex Osborn, an advertising executive, is generally credited with developing
modern organizational brainstorming procedures in the 1940s and 1950s
( Osborn, 1963 ). Osborn’s brainstorming process (originally called “thinking
up”) is described in his classic book, Applied Imagination: Principles and Proce-
dures of Creative Problem-Solving.
There are three fundamental principles for group brainstorming:
1. Aim for sheer quantity . Quantity, not quality, is the sole goal of brain-
storming. The only criterion for the success of brainstorming is the sheer
number of ideas that are generated. Anything that limits the number
of ideas is contrary to the intent of brainstorming. For example, brain-
storming participants should not be taking their own notes because that
reduces their cognitive resources available for generating ideas. Partici-
pants should not be monitoring e-mail (so easy now with wireless con-
nections) or reading reports during brainstorming. All the resources of
the participants should be focused on generating as many ideas as pos-
sible. The principle that “more is always better” is generally supported
in the research literature although there are issues with defi ning exactly
what quality means in brainstorming.
2. Defer judgment about the quality of ideas . Do not criticize the ideas of
others either implicitly (for example, through facial expressions or other
nonverbal behaviors) or explicitly (for example, saying “Wow! That is
a crazy idea!”). While the rule about criticism is well known, another
more subtle rule is to avoid praise, just as you avoid criticism. Prais-
ing an idea is attaching a judgment to the idea, which means that lack
of praise can be construed as tacit criticism. So, it is best to avoid both
praise and criticism.
EDITOR’S NOTE: “BRAIN STORMS” AS MENTAL DISEASE
AND FORTUNATE THOUGHTS
In the early part of the twentieth century, “brain storm” referred to violent bouts of temper or
bouts of lethargy and depression. Toward the middle of the twentieth century, the usage of
“brainstorm” changed to mean “sudden and fortunate thoughts” ( OED, n.d. ). Alex Osborn,
the “father of brainstorming” used the term “brain storm session” in the mid-1950s to
describe his method of generating solutions to problems ( Osborn, 1963 ).
Please purchase PDF Split-Merge on www.verypdf.com to remove this watermark.
109
Brainstorming
CHAPTER 4
3. Encourage wild ideas and new ideas formed by synthesizing ideas, stretching
ideas (bigger, faster, smaller), applying metaphors, or improving on existing
ideas . Wild ideas that may not be directly applicable to a brainstorming
topic can serve as triggers for ideas that are potentially useful. Ideas from
science fi ction stories or movies, for example, might seem odd but many
existing products are fi lled with concepts like teleportation, invisibility,
and the ability to travel back in time ( Freeman & Gelernter, 1996 ).
The apparent simplicity of these principles leads many people to assume that
successful brainstorming is easy and can be done by anyone. However, this is
an assumption that is not always warranted. Good brainstorming is rare, and
in many cases what people consider “good brainstorming” is often seriously
defi cient.
Osborn’s “structured brainstorming” approach with clear ground rules and
procedures contrasts with “unstructured brainstorming,” in which a group
gets together to generate ideas without a facilitator and clear ground rules.
Ideas that emerge from unstructured brainstorming are often criticized as
they are generated and loud or dominant individuals can exert inordinate
infl uence on the quiet participants, thus limiting the number of ideas that
participants are willing to express. This chapter will focus on structured brain-
storming where there is generally a facilitator and a set of explicit rules for
participants.
When Should You Use Brainstorming?
You can use brainstorming to:
Generate ideas or requirements
■
Find solutions to problems ■
EDITOR’S NOTE: DON’T BELIEVE ALL THAT YOU READ ON
THE WEB: GROUP BRAINSTORMING ISN’T SIMPLE!
Although group brainstorming seems simple, there are many social issues like status
differences, shyness, informal relationships, ego, and cultural factors that can affect the
quantity of ideas. Camacho and Paulus (1995) found, for example, that social anxiety
had a signifi cant effect on brainstorming productivity and suggested that “… interactive
[group] brainstorming may be best suited for people who are low in social anxiety.”
(p. 1,078). A trained facilitator can mitigate some of these factors, but even a good
facilitator won’t have total insight into all the social forces and group dynamics that can
infl uence productivity. Jared Sandberg (2006) summarizes some key requirements for
successful group brainstorming:
“In fact, great brainstorming sessions are possible, but they require the planning of
a state dinner, plenty of rules, and the suspension of ego, ingratiation, and political
railroading.”
Please purchase PDF Split-Merge on www.verypdf.com to remove this watermark.
User Experience Re-Mastered: Your Guide to Getting the Right Design
110
Support conceptual design ■
Explore new design spaces ■
Generate social cohesion among product teams by having them work on ■
ideas and solutions together
Brainstorming is often used in the early to middle stages of product develop-
ment; however, this method is applicable at any time when new ideas or solu-
tions are required. If you have an unexpected and diffi cult problem just before
you release a product, brainstorming would be an appropriate method for gen-
erating potential solutions.
Strengths of Brainstorming
It has name recognition. Most people have some sense of what a brain- ■
storming session is like.
It helps identify ideas that could lead to solutions for the problems. ■
It provides many ideas quickly. ■
It requires few material resources. Paper, pens, sticky notes, and tape are ■
all that you require unless you are doing remote brainstorming.
It is a useful way to get over design blocks that are holding up a project. ■
It is a democratic way of generating ideas (assuming that particular indi- ■
viduals don’t dominate and you have a good facilitator).
It provides social interaction – people like to work together in groups to ■
solve problems.
Weaknesses of Brainstorming
The focus on the quantity of ideas can be derailed easily by criticism or ■
poor facilitation.
It requires an experienced facilitator who is sensitive to group dynamics ■
and social pressures.
It is sometimes less effective than having the same number of partici- ■
pants generating ideas individually. The quantity of ideas can suffer
when one person in the brainstorming group blocks the production of
ideas by other participants by telling “war stories” or whispering to a
colleague and distracting the rest of the group.
It can be chaotic and intimidating to the quiet or shy individual. ■
It can reduce individual recognition for good ideas (though you can ■
compensate for this by being known as a “good brainstormer” and cre-
ative contributor).
It may be diffi cult in some countries or cultures where “wild ideas” ■
may be viewed as inappropriate because those ideas are contrary
to those of more senior colleagues, corporate initiatives, or cultural
norms.
The status or experience differences among participants can reduce brain- ■
storming effectiveness. Mixing senior and junior colleagues can result in
the junior people deferring to their more senior colleagues.
Please purchase PDF Split-Merge on www.verypdf.com to remove this watermark.