Tài liệu Chapter 3_Project management process improvement pptx
Bạn đang xem bản rút gọn của tài liệu. Xem và tải ngay bản đầy đủ của tài liệu tại đây (224.5 KB, 23 trang )
3
Assessing and Reporting Maturity Level
At this point we have a good grasp of the CMM
®
as applied to project
management. We have described maturity at all five levels for each of the 39
processes that makes up the nine knowledge areas of the PMBOK standard. We
have seen that level 3 is the transition between having a documented process
(level 2) and having all project teams using the process (level 3). Level 3 defines
project management process practice (PP) level maturity. Level 2 defines project
management process definition (PD) level maturity. Levels 1, 4, and 5 define
both PD and PP level maturity. In this chapter we turn to the measurement and
assessment of project management maturity in the organization. One survey
document has been established to measure both PD and PP maturity. In other
words, our assessment of level 2 maturity will be totally based on a review of the
established and documented processes for completeness. All other maturity lev
-
els will assess not only process by further examination of PD and documentation
but also by an examination of if and how project teams are using the defined
processes. In other words the practice component of maturity is measured by
examining ongoing and recently completed projects and how the defined and
documented processes were used in the execution of the projects. The survey has
been designed to accommodate either PD or PP maturity assessments. The sur
-
vey is modular. A single process may be assessed for either PD or PP maturity or
both. Also, all of the processes that define a specific knowledge area may be simi
-
larly assessed.
PD is the documented and standardized processes that drive all project
management activity in the organization. It is developed in collaboration with
those who are expected to utilize it as well as all those managers who either affect
it or are affected by it. The development of PD is only the first step in creating a
73
project management culture in an organization. The second, and more difficult
step, is the adoption of the project management processes. This will be meas
-
ured by PP. Project managers, especially those who have come from other
organizations, will bring their own approaches to project management. They
will be comfortable using their own processes and will have to be sold on PD as
being a better approach. Tracking changing values of PD and PP over time will
be an important indicator of the success of any project management improve
-
ment efforts. All of the data used in this chapter is real data taken from a recent
client engagement.
3.1 Overview of the Survey Questionnaire
The initial version of the survey questionnaire was developed as part of a larger
consulting engagement aimed at establishing a continuous quality improvement
program for project management at a large retailer. The actual questions devel-
oped for that engagement are given in the Appendix.
3.1.1 Design of the Survey
From the outset it was clear that two types of assessments would be needed. The
first was an assessment of the maturity of the process based solely on a review of
its documentation. Whatever the current state of the process definition, it cer-
tainly would not be the complete definition. Parts would be missing and some
parts may not be correctly defined or documented and in need of further devel-
opment. Some parts might be adequately defined but not compatible with the
culture of the organization and in need of further development. Still others may
be correctly defined and documented but need training support for the teams to
use them correctly. The assessment would define exactly where the project man
-
agement processes were with respect to their level of maturity, and given that
there were established goals for maturity, a baseline would be established as well
as the gap between target PD maturity and actual PD maturity.
The second was an assessment of how projects were putting the processes
into practice. Each project would have its own assessment. Some projects could
be expected to operate below the baseline maturity level, others near the base
-
line, and still others above the baseline. It was clear that the ability to compare
process maturity and practice maturity was necessary. To that end, the survey
was designed so that we could conduct the two types of assessments with the
same survey.
To cover all 39 processes at all five maturity levels required 195 separate
maturity assessments, and each maturity assessment would most likely include
two or more questions. The total number of questions could easily get out of
74 Project Management Process Improvement
hand. Even with the efforts to contain that number, the total number needed to
adequately cover all 195 categories was 807. To conduct such a survey without
overwhelming the person being interviewed led me to structure the sequence of
questions in such a way as to minimize the time and effort required of both the
interviewee and the interviewer. The questions had to be stated simply and in
such a fashion that individual biases would be minimized. I decided to structure
each question so that it could be answered either “Yes,” “No,” or “Not Applica
-
ble.” Since the attainment of a maturity level was dependent on having attained
the immediately preceding maturity level, I decided to sequence the questions
within process by maturity level. That meant that if questions at one level were
largely answered with a “No” response, the same would likely be the case for
questions at all higher maturity levels. That is not to say that all further ques
-
tions had to have a “No” response, but that the preponderance of questions
would have a “No” response. In actual practice, that seemed to hold true and
did translate into a more humane treatment of the interviewee. As I observed
through the interviews, the sequencing did create a learning curve effect. Inter-
viewees quickly learned the structure and could answer blocks of questions at
one time rather than having to answer questions one at a time. The typical inter-
view covered all 807 questions in a little less than 2 hours.
The “Not Applicable” response was used exclusively in the assessment of
PP. For example, some projects did not include a procurement phase, and there-
fore, questions about the procurement management processes were outside the
scope of the project. Procurement management may, in fact, be part of the proj-
ect management processes, but that assessment would be covered by the PD.
Once a PD baseline maturity level had been established, further assessments
would only have to include those processes that had changed. PD maturity level
assessments could also be done on selected processes that had been problematic
or otherwise were areas of concern.
3.1.2 Defining Maturity Level Penetration
Simple ratios are used to define maturity level penetration (MLP) at both the
process level and at the summary level for each knowledge area. MLP is a
numeric value that states the highest maturity level attainment plus the propor
-
tion of the next maturity level attained. To attain a specific maturity level, a
process must meet all the requirements of that level as well as all previous levels.
In other words, maturity is a cumulative measure. The maturity level penetra
-
tion of process i at maturity level j is calculated using the formula
mlp
ij
= (# of Yes responses at level j )/
(# of Yes responses at level j + # of No responses at level j )
for i =1,2,…39,j =1,2,…5
Assessing and Reporting Maturity Level 75
Notice that the “Not Applicable” response is not included in the calcula
-
tion. MLP is a very flexible and useful metric that we will have occasion to use
frequently in the remainder of the book. To see exactly how we will use it let us
look at an example.
Example.
In this example we have calculated the following values for process i
definition:
mlp(pd )
i1
= 1.0
mlp(pd )
i2
= 1.0
mlp(pd )
i3
= 1.0
mlp(pd )
i4
= 0.2 implies that MLP(PD)
i
= 3.2
mlp(pd )
i5
= 0.1
This profile of mlp values tells us that process i meets all of the require-
ments to be at level 1, level 2, and level 3, and 20% of the level 4 requirements.
By definition of maturity levels, we know that a process must meet all require-
ments of the previous maturity levels to be considered at the next level. For this
example, that means that process i has attained maturity level 3. Furthermore, it
has penetrated 20% into the next maturity level, maturity level 4. Therefore, we
define the MLP of process i to be 3.2. That is, MLP(PD)
i
= 3.2.
Continuing the example, suppose we calculated the following values for
process i practice from a project that has just been completed:
mlp(pp)
i1
= 1.0
mlp(pp)
i2
= 0.3 implies that MLP(PP)
i
= 1.3
mlp(pp)
i3
= 0.1
mlp(pp)
i4
= 0.2
mlp(pp)
i5
= 0.0
Because MLP(PD)
i
= 3.2 and MLP(PP)
i
= 1.3, the project that gave rise to
this data operated below the baseline maturity level for process i. This may be an
anomaly, in which case the project should be further audited to discover and
correct the problem. Other projects may exhibit the same performance in which
76 Project Management Process Improvement
case the problem may be systemic. In that case further analysis at the PD level is
required. The root cause has to be identified and corrected. We will deal with
the details in Chapters 5 and 6.
For the sake of another example let us reverse the data so that MLP(PD)
i
=
1.3 and MLP(PP)
i
= 3.2. While this may seem to be an anomaly, it is a possibil
-
ity. This is an indication that there may be level 3 best practices in the project
being assessed that can be used by other projects and used to increase MLP(PD)
to 3. This should be further investigated through process improvement initia
-
tives for process i. We will deal with the details in Chapters 5 and 6.
3.2 Reporting the Process Maturity Baseline
All of the maturity data that we will be reporting lends itself to graphical repre
-
sentation. This section and the next introduce, with applications, two graphical
tools that are intuitive and insightful of the underlying PD and PP maturity and
the relation between them. They are the Kiviatt Charts and Box & Whisker
Plots. These tools are flexible and adaptive and can be formatted to allow us to
superimpose multiple sets of PD and PP maturity data on the same graphical
plot and draw a variety of inferences and conclusions.
3.2.1 Kiviatt Charts
A Kiviatt Chart (source unknown) uses a circle to portray multidimensional
data. Each dimension is represented by a line segment radiating from the center
of the circle and extending out to the outer edge of the circle. The line segments
are equally distributed around the circle. Every line segment has the same scale.
Low values are at the center of the circle and high values at the outer edge of the
circle. I have used Kiviatt Charts to represent as many as 20 dimensions and
have not sacrificed the intuitive properties of this charting process. Kiviatt
Charts have been in use for a number of years in a variety of applications. Several
examples follow.
Figure 3.1 is an example that shows thinking style data produced by the
Herrmann Brain Dominance Instrument (HBDI) [1]. There are four dimen
-
sions: analyze, organize, personalize, and strategize. The analyze thinking style is
characteristic of an individual who thinks logically, who is analytic, who is gen
-
erally a technical person, often mathematical, and one who likes to solve prob
-
lems. The organize thinking style is characteristic of an individual who tends to
be administratively focused; they are often conservative and like to follow
process and procedure; these individuals lead a controlled work life and like
planning and related tasks. The personalize thinking style is characteristic of an
individual who is very “touchy-feely.” They are interpersonal, emotional, and
Assessing and Reporting Maturity Level 77
very social, and often they are spiritual and musically inclined. The strategize
thinking style is characteristic of an individual who is a conceptualizer, who is
imaginative, and one who is particularly good at synthesizing a situation. Each
dimension is measured on a scale that ranges from 0 to 133. The data points are
determined from a 180-question survey that the individual completes. The
responses are analyzed and filtered through an algorithm and four scores are pro
-
duced. In the example the four scores are 114, 84, 55, and 42, respectively. A
closed quadrilateral, called a kite, is formed from the four scores, as shown in
Figure 3.1. High scores indicate a preference for that style of thinking. Low
scores indicate an avoidance of that thinking style. The example is of an individ
-
ual who is primarily a left-brain person as indicated by the high scores on the A
and B quadrants. The kite can be symmetric, representing those individuals who
equally prefer and use all four thinking styles. The kite can be very asymmetric,
representing those individuals who have a strong preference for three, two, or
one thinking style. A strong preference for a single thinking style and an avoid
-
ance of the other three produces the most asymmetric kite.
Figure 3.2 is another example of the Kiviatt Chart. Here the figure dis
-
plays the skill profile of a project team on five skill groupings: project manage
-
ment, management, business, interpersonal, and personal. Each skill grouping
consists of an aggregate score based on a number of individual skill proficiencies.
78 Project Management Process Improvement
42
56
84
33 33
33
33
67 67
67
67
100 100
100
100
114
D
Strategize
C
Personalize
B
Organize
A
Analyze
Figure 3.1 Use of the Kiviatt Chart to display HBDI data.
The bar represents the range of proficiencies of the team. Superimposed on the
Kiviatt Chart are the ranges of skill levels that should be present in a team for a
specific type of project. For this example there are four types of projects that
range in complexity from critical mission (type I) to simple (type IV). This par-
ticular team does not display a skill profile sufficient for type I projects.
Figure 3.2 displays only the range of skill proficiencies. Some prefer to see
actual values. Figure 3.3 displays the skill proficiencies of each team member on
each of the five skill groups superimposed on one Kiviatt Chart. Knowing the
distribution of skill proficiencies within the range does convey more informa
-
tion than the range alone but it is a more complex graphic. I guess you get what
you pay for. For even more detail, the skills in a specific skill group could be dis
-
played individually in the Kiviatt Chart format.
Figure 3.4 shows a Kiviatt Chart for nine dimensions. You can see that the
figure is still quite intuitive and not at all cluttered even for this many variables.
The data here represents the affinity of a project team for each of the nine roles
that Belbin’s [2] research shows is essential for every team to be effective.
Following are brief definitions of each of the nine roles.
•
Plant: Someone who is expected to bring creative and new ideas to the
team. They often will be instrumental in helping the team solve
problems.
•
Resource investigator: These individuals are good at reaching out for
resources and linking the team to external ideas that may be useful.
Assessing and Reporting Maturity Level 79
Legend:
Projects
Management
Business
Type IVType II and III projectsType I projects
Interpersonal
Personal
Project management
80
80
80
80
80
60
60
60
60
60
40
40
40
40
40
20
20
20
20
20
Figure 3.2 Use of the Kiviatt Chart to display a skills profile
•
Coordinator: These are the leaders of the team. They take advantage of
team strengths and avoid weaknesses and generally make sure that the
project plan moves ahead smoothly.
•
Shaper: These are the planners. They set objectives and establish
priorities.
80 Project Management Process Improvement
Project management
Management
Business
Interpersonal
Personal
Legend:
Pro
j
ect
Type IV
Type II and III projectsType I projects
80
80
80
80
80
60
60
60
60
60
40
40
40
40
40
20
20
20
20
20
Figure 3.3 Use of the Kiviatt Chart to display several individual skill profiles.
Resource investigator
Coordinator
Shaper
Monitor evaluator
T
ea
mw
o
rk
e
r
Implementer
Completer finisher
Specialist
Plant
Figure 3.4 Use of the Kiviatt Chart to display Belbin’s team role data.
•
Monitor evaluator: These are the analytical members of the team. They
study the team’s problems and evaluate alternative solutions. They are a
good balancing factor on the team when it comes to decision-making.
•
Teamworker: These team members have a talent for bringing the team
members together into a functioning unit.
•
Implementer: These team members have a talent for turning the plan
into action. They make things happen.
•
Completer/finisher: These are the detail members of the team. They
make sure that things happen as they are supposed to happen.
•
Specialist: These are the subject matter experts on the team. They are
expected to contribute their expertise and that is all.
Higher values are plotted towards the outer edges of the circles. This team
has an observed weakness in plant, resource investigator, and coordinator roles.
For a discussion of these roles see Belbin [2].
The Kiviatt Chart can also be used to compare two sets of data along the
same dimensions. For example, the team’s HBDI profile from Figure 3.1 can be
superimposed on the project’s HBDI profile, producing Figure 3.5. This use of
the Kiviatt Chart is unique and provides a powerful tool for the project
Assessing and Reporting Maturity Level 81
33 33
33
33
67 67
67
67
100 100
100
100
D
Strategize
C
Personalize
B
Organize
A
Analyze
Figure 3.5 Use of the Kiviatt Chart to compare the team and project HBDI profiles.
manager. It shows the degree of alignment between the project and the team
using the HBDI as the metric on which that comparison is made. In this exam
-
ple the team has a preference for left-brain thinking. The project, on the other
hand, displays more of a balance among all four thinking styles. In this case
there is a distinct gap in the personalize and strategize quadrants. The project
manager is aware of this misalignment and can put the appropriate corrective
measures in place. The interested reader can consult Wysocki [3] for more detail
on how to analyze this type of data.
As you can see, the Kiviatt Chart is quite adaptable to a number of situa
-
tions. We will have many occasions to use it as we examine maturity level data
for the 39 project management processes. It will be used for decision making at
the process level and at the knowledge area level.
3.2.2 Box & Whisker Plots
Our second graphical tool is the Box & Whisker Plot. The Box Plot was
originally formulated by Mary Eleanor Spear [4] and further developed by John
Tukey [5] and is the basis for what is now called the Box & Whisker Plot.
Figure 3.6 is an example of the graphic icon that is used to display the range,
interquartile range, and median of a set of numeric data. (An example of how we
will use the Box & Whisker Plot is shown in the next section in Figure 3.8.)
Despite the fact that the Box & Whisker Plot has been around for more
than 50 years, its use is not that widespread. First, and most important, is that it
is intuitive. It needs little explanation. It is a powerful visual summary of the
parameters of a sample set. The size of the box is an indicator of the variance and
symmetry in the sample. The location of the median with respect to the inter-
quartile range is another indicator of the symmetry in the data. It will be our
favored way of displaying and comparing PD and PP maturity level data.
82 Project Management Process Improvement
Interquartile range
Lowest value
Mean or median value
Highest value
Figure 3.6 The Box & Whisker Plot icon.
3.3 Reporting the Project/Process Maturity Gap
The Kiviatt Chart and Box & Whisker Plots are intuitive and offer great flexibil
-
ity and economy in displaying maturity level data. PD and PP data can be super
-
imposed to give a complete picture of the project management maturity of an
organization’s project management infrastructure and project portfolio per
-
formance with respect to a documented standard. In this section we begin to
explore the variety of situations that our graphic tools can show. In later chap
-
ters we will apply these tools to specific improvement initiatives.
Figure 3.7 shows the process level maturity data (PD baseline) with project
PP data superimposed. The PP data was collected from nine projects that had
just recently completed. Figure 3.8 shows the same data using the Kiviatt Chart
format. Figure 3.7 tells us a lot about what is going on with the process definition
itself, the process practice, and the relationship between the two. The Plot could
also have the goal maturity levels plotted for each process, but that is not done in
this example. Note that there are two processes (integration and scope) whose
PD values lie significantly above the PP distribution. Most of the projects sur-
veyed for this data set are not using the integration and scope processes as cur-
rently defined and documented. For two processes (quality and HR) the PP
distributions lie mostly above the PD baseline values. Procurement looks strange.
Here most of the PP values are near the PD baseline except for one or two values
that are significantly higher. These anomalies should raise our curiosity and sug-
gest further investigation. In my experience with this type of analysis, it is highly
suggestive of best practices that were brought to the team by a member new to
the organization. This is the diamond in the rough and must be investigated fur-
ther. The size of the interquartile range also tells us something about the process.
Look at time, cost, HR, and risk, for example. The interquartile ranges are small
Assessing and Reporting Maturity Level 83
1
2
3
4
5
Procurement
Risk
Communications
HR
Quality
Cost
Time
Scope
Integration
PD baseline
Figure 3.7 Box & Whisker Plot of PD versus PP maturity level data.
and the median value lies very close to the PD maturity level. This is indicative of
a process that is well understood and practiced by the teams. Everyone is doing
pretty much the same thing and is in alignment with the process maturity. The
only issue here is the PD maturity level relative to the target level. Scope, quality,
and communications do not display this small variance property.
Figure 3.8 shows the same data as is given in Figure 3.7 but using the Kivi-
att Chart format. The Kiviatt Chart format can display more data than the Box
& Whisker Plot but is a little less intuitive. Which one you use is really a matter
of taste. Both formats are intuitive and convey the same picture. These figures
illustrate three situations that are discussed in the following three sections.
For those who would rather see the data at the individual project level, we
can replace the Box & Whisker icon with the actual data (Figure 3.9). There is
some sacrifice in the intuitiveness from using the Box & Whisker Plot.
Figure 3.10 is yet another example of the use of Box & Whisker Plots. In
this example we are tracking changing PD and PP values for a single process.
This type of data display is most useful as a summary level report of improve
-
ment initiative results for a single process over time. Again, the Box & Whisker
Plot tells us quite a bit about what has been going on with this process and the
improvement initiatives. For this improvement program both the PD and PP
maturity levels are being affected. At the end of each quarter the PD maturity
level is assessed and a sample of projects are surveyed with respect to the process
under observation. Note what is happening. First, the PD maturity level is
increasing toward some target value. The PP maturity level of the sampled proj
-
ects is moving up slowly. Keep in mind that the project teams are aiming at a
84 Project Management Process Improvement
PD baseline
Time
Cost
Quality
HR
Communications
Risk
Procurement
Scope
5
4
3
2
1
Figure 3.8 Figure 3.7 data shown in Kiviatt Chart format.
moving target. That translates into considerable change in how projects use the
process even as it changes. Note that the PP distributions are converging on the
PD values and the interquartile range is decreasing as well. This is suggestive of a
good deal of coordination between process and practice as well as an appropriate
training program for the new and changed process that is affected. All of this
points to a well-executed improvement initiative.
3.3.1 PP Below PD Baseline
In Figure 3.7 note that the maturity level of the process (dashed line) falls above
the practice data collected from recently completed projects (the Box &
Assessing and Reporting Maturity Level 85
1
2
3
4
5
Procurement
Risk
Communications
HR
Quality
Cost
Time
Scope
Integration
PD baseline
Figure 3.9 Plot of individual project PP maturity values versus PD baseline.
1
3
4
5
12/2003
9/2003
6/2003
3/2003
PD
base
lin
e
2
Figure 3.10 Box & Whisker Plot for improvement initiatives for a single process.
Whisker Plot data). I consider situations where the interquartile range lies below
the PD maturity level to be significant and worth further investigation. That is
the case with the integration and scope knowledge areas.
3.3.2 PP at PD Baseline
If the preponderance of projects are practicing a process at about the same
maturity level as the process, that would indicate good alignment between
process and practice. Figure 3.7 shows examples of this in the time, cost, risk,
and procurement knowledge areas.
Apart from the positioning of the interquartile range of the PP data with
respect to the PD value, the variance of the interquartile range is of interest. If
the variance is small, it indicates relative uniformity in the practice of a process
regardless of its relationship to the PD value. To have the PP interquartile range
small and have it include the PD baseline would be an ideal situation. It reflects
harmony between defined processes and the practice of those processes. It would
indicate a common understanding of the process across all project staff and fur-
ther that the process definition is aligned with accepted industry practices. If the
variance is large, there may be some projects whose PP value is greater than the
PD value and worthy of further investigation for potential best practices. This
situation is more likely to be the one you encounter. It reflects a range of under-
standings, acceptance, and agreement across all project staff. As the variance of
PP maturity values around the PD baseline increases, there is more reason to be
concerned. There should be an investigation to ascertain the reasons for this
irregular behavior. There may be behaviors to correct or best practices to incor
-
porate into the project management process. In both cases PP and PD maturity
levels will be positively affected.
3.3.3 PP Above PD Baseline
In Figure 3.7 note that the PD maturity level falls below the PP maturity level
distribution collected from the quality knowledge area in recently completed
projects. I consider situations where a significant number of PP data points lie
above the PD maturity level to indicate a serious anomaly.
You might wonder how that can happen. How can projects’ PP values lie
above the established PD maturity level? This can happen if the development
and documentation of project management processes seriously lags accepted
industry practices and standards. Project managers are often familiar with com
-
mon industry practices and will ignore the processes as defined by their organi
-
zation if they believe something better is available to them.
86 Project Management Process Improvement
3.4 Maturity Profile by Knowledge Area
The maturity profile for each of the nine knowledge areas is built from a con
-
catenation of the maturity profiles of each of the processes that define the
knowledge area. This process level maturity assessment is a more granular assess
-
ment than used in other approaches. The primary reason I have taken this
approach is to provide an analysis path for improving the maturity level of a sin
-
gle knowledge area. If the assessment data suggests that a particular knowledge
area is performing below nominal, further analysis of the maturity level data for
the processes that make up that knowledge area can then be undertaken without
any further maturity data collection. That more detailed analysis will certainly
isolate areas where maturity performance is below expectations and may shed
some light on improvement initiatives that should be undertaken to correct the
less than acceptable maturity level performance in the cited knowledge area.
Chapter 6 provides considerable detail on the identification and analysis of
maturity level problems and the subsequent commissioning of improvement
initiatives.
Even though we are going to use the gaps between the existing PD and the
target level PD and the gap between the PD maturity values and the PP values as
a criterion for selecting improvement opportunities, we need another metric to
help prioritize the importance of the project management processes with respect
to overall business objectives. It is possible that large gaps may be associated with
the processes that are relatively less important than other processes that have
smaller gaps. Our approach will combine the relative importance of processes
and their PD and PP gaps to prioritize processes for improvement initiatives.
Our first order of business is to establish a model for prioritizing the 39
processes. That is the topic of the next section.
3.4.1 Process Maturity Matrix
In a seminal paper published in the Harvard Business Review in 1987, Maurice
Hardaker and Bryan K. Ward [6] introduced process quality management
(PQM). The purpose of the PQM was to give management an organized
approach to improving the performance of the business. It would do that by
identifying and prioritizing the processes of the business that would have maxi
-
mum impact on the critical success factors that drive the performance of the
business if the processes associated with them were improved.
The heart of PQM is a matrix whose rows are the business processes of an
organization and whose columns are the agreed upon critical success factors
(CSF) of the organization. In our use of the PQM the rows will be the 39 proj
-
ect management processes. The columns will be the CSFs of the project man
-
agement methodology. Two additional columns are appended to complete this
Assessing and Reporting Maturity Level 87
matrix. The first is a count of the number of CSFs that are related to each of the
business processes. For our purposes we call these numbers the correlation fac
-
tors. They range from 0 to the number of CSFs. The second is an evaluation of
the quality of each business process. Hardaker and Ward measure quality as fol
-
lows: A for excellent, B for good, C for fair, D for bad, and E for embryonic. For
our purposes I have modified that column to be the MLP value of the process.
Obviously the PQM is robust; that is, it has wide applications to areas
other than business processes and CSFs. For example, I have used it in the
health care industry by substituting direct patient care services for business
processes and quality performance metrics for CSFs. The analysis is identical
even with these changes. For the purposes of this book I have replaced business
processes with the 39 project management processes, CSFs with the top 10 rea
-
sons why projects succeed as reported by the Standish Group [7], and the
evaluation of quality with project management maturity level. The resulting
process maturity matrix is shown in Figure 3.11, and the process maturity zone
map is shown in Figure 3.12. The maturity level data is from a recent consulting
engagement with a large retailer.
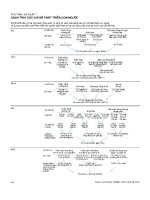
As indicated in Figure 3.11 the PQM consists of three parts: a matrix
defined by the 39 project management processes and the 10 project CSFs, corre-
lation factors (c
i
., i = 1, 39), and maturity level assessments (MLP (PD)
i
, i =1,
39).
C
j
ij
=
1, if the attainment of CSF is dependent upon process
otherwise
i
cc
iij
j
0,
.
=
∑
The last two columns provide the data that defines another matrix called
the zone map. That data is graphically summarized into a matrix called the zone
map, as shown in Figure 3.12. Processes whose data points lie towards the
northwest part of the zone map are processes that should be considered for any
process improvement initiatives because they have a low maturity level and are
associated with several CSFs. The zone map gives us a crude tool for prioritizing
processes for improvement initiatives. In the example, data processes P21, P14,
P23, P28, and P33 would receive immediate attention. As improvement initia
-
tives are completed, one would expect to see these processes move from left to
right in an updated zone map. Once some of those improvements are in place, a
88 Project Management Process Improvement
Assessing and Reporting Maturity Level 89
area
Knowledge
PM
CSF1 CSF2 CSF3 CSF4 CSF5
process
Integration mgt Project plan dev. 1 1 1 0 1
Project plan execution 0 1 1 0 1
Int. change cont. 1 1 1 1 1
Scope mgt Initiation 1 0 1 1 0
Scope planning 0 1 1 1 1
Scope definition 0 1 1 1 1
Scope verification 1 1 1 1 1
Scope change cont. 1 1 1 1 1
Time mgt Activity definition 0 0 1 0 0
Activity sequencing 0 0 1 0 0
Activity duration est. 0 0 1 0 0
Schedule dev. 0 1 1 0 1
Schedule control 1 1 1 0 1
Cost mgt Resource planning 0 1 1 0 0
Cost estimating 1 0 1 0 0
Cost budgeting 0 0 1 0 0
Cost control 1 0 1 0 1
Quality mgt Quality planning 0 0 1 0 0
Quality assurance 0 1 1 0 1
Quality control 1 1 1 0 1
HR mgt Org. planning 1 1 1 0 0
Staff acquisition 1 0 1 0 0
Team development 1 1 1 0 0
Comm. mgt Comm. planning 1 0 1 0 0
Info. dist. 1 1 1 1 0
Perf. reporting 1 1 1 0 0
Admin. closure 1 0 1 0 0
Risk mgt Risk mgt planning 0 1 1 0 1
Risk identification 0 0 1 0 0
Qual. risk analysis 0 0 1 0 0
Quant. risk analysis 0 0 1 0 0
Risk resp. planning 0 1 1 0 0
Risk monitoring and cont. 1 1 1 0 1
Proc. mgt Procurement planning 0 0 1 0 0
Solicitation planning 1 0 1 0 0
Solicitation 1 1 1 0 0
Source selection 1 0 1 0 0
Contract admin. 0 0 1 0 0
Contract close-out 0 0 1 0 0
Figure 3.11(a) The process maturity matrix.
90 Project Management Process Improvement
CSF6 CSF7 CSF8 CSF9 CS10 C
i.
MLP
i
process
PM
0 0 1 1 1 7 3 Project plan dev.
0 0 1 0 0 4 3.33 Project plan execution
1 1 1 0 0 8 3 Int. change cont.
0 1 1 1 0 6 4 Initiation
0 1 1 1 1 8 4 Scope planning
0 1 1 1 0 7 3 Scope definition
0 1 1 1 0 8 3 Scope verification
1 1 1 1 0 9 3.67 Scope change cont.
0 0 1 1 1 4 1.82 Activity definition
0 0 1 0 1 3 2 Activity sequencing
0 0 1 1 1 4 1 Activity duration est.
0 0 1 1 1 6 1.59 Schedule dev.
0 0 1 0 0 5 2.1 Schedule control
1 1 1 1 1 7 1.5 Resource planning
0 0 1 1 0 4 1.36 Cost estimating
0 0 1 0 0 2 2 Cost budgeting
0 0 1 0 0 4 1.22 Cost control
1 0 1 0 1 4 1 Quality planning
0 0 1 1 0 5 1.14 Quality assurance
1 0 1 0 0 6 2.63 Quality control
1 1 1 1 1 8 1.11 Org. planning
0 0 1 1 1 5 1.22 Staff acquisition
1 0 1 1 1 7 1.1 Team development
1 0 1 0 0 4 2 Comm. planning
0 0 1 0 0 5 3 Info. dist.
0 0 1 0 0 4 2.14 Perf. reporting
0 0 1 1 0 4 3 Admin. closure
1 0 1 1 1 7 1.33 Risk mgt planning
0 1 1 1 0 4 1 Risk identification
0 0 1 1 0 3 2 Qual. risk analysis
0 0 1 1 0 3 2 Quant. risk analysis
0 0 1 1 0 4 1.33 Risk resp. planning
1 0 1 1 0 7 1.67 Risk monitoring and cont.
1 0 1 1 1 5 1.71 Procurement planning
0 0 1 1 1 5 1 Solicitation planning
001
1
1 6 1.29 Solicitation
0 0 1 0 0 3 2 Source selection
0 0 1 1 0 3 1 Contract admin.
0 0 1 0 0 2 1 Contract close-out
Figure 3.11(b).
reprioritization can be done and another round of improvement initiatives
undertaken.
If the Box & Whisker Plot report given in Figure 3.7 is used to prioritize
knowledge areas for improvement initiatives, the following might happen. The
time management knowledge area might be chosen as the highest priority area
for improvement. Time management consists of five processes:
1. P09: activity definition;
2. P10: activity sequencing;
3. P11: activity duration estimating;
4. P12: schedule development;
5. P13: schedule control.
Note the location of these five processes in the zone map in Figure 3.12.
The prioritization of these five processes for improvement might be P12, P09,
P11, P13, and finally P10. P12, P09, and P10 improvement initiatives will be to
Assessing and Reporting Maturity Level 91
1
1
0
2
2
3
3
4
4
5
5
6
7
8
9
10
Maturit
y
level
Correlation factors
Zone 3
Zone 3
Zone 2
Zone 2
Zone 1
Zone 1
P09 P11
P15 P17
P18 P29
P32
P19 P22
P34 P35
P12 P36
P14 P23
P28 P33
P21
P04
P05
P08
P03 P07
P01 P06
P20
P13
P25
P02 P27
P24 P26
P10 P30
P31 P37
P16
P39
P38
Figure 3.12 The PD maturity zone map.
complete the definition and documentation of the processes. That will increase
the PD maturity levels from 1 to 2. Following that the next set of improvement
initiatives will be to raise all five processes PD and PP maturity levels to level 3.
In other words, there will be a concerted effort to improve the PP maturity level
of the entire time management knowledge area to level 3.
3.4.2 Closing the Maturity Gap
Not every project management process needs to be at level 5 maturity, and
maybe even none of them need to reach level 5. Also, not every project manage
-
ment process needs to reach the same level of maturity. Setting the maturity
goals for your project management processes is more involved than you might
have originally thought. Let us take a brief look at some of the factors that need
to be considered.
While you certainly want to have the best project management processes
and practices you can, the cost of attaining and maintaining them may not be
practical. Given that level 5 maturity is out of reach for all 39 processes, what
compromise position makes sense? I cannot envision any organization that is
serous about cultivating a project management culture that would settle for less
than maturity level 3 for all 39 processes. That means that whatever your PD
maturity levels might be, you would want your PP values to cluster closely
around 3.0. That goal is a difficult one to achieve. Stop and think about the
infrastructure you will need to certify that you are operating at level 3 maturity.
Every project must undergo a series of project reviews at key points and mile-
stones along the project life cycle. Any anomalies must have a corrective action
plan developed, put in place, and monitored for compliance. Process documen
-
tation must be complete, clear, readily available, and backed up with the needed
training and consulting support. And then you must staff for delivery of all these
support services.
The decision to set the target maturity level is not to be taken lightly. To
have your project management methodology at level 5 for all 39 processes is cer
-
tainly an admirable accomplishment but it might be overkill. To achieve that
level requires the full cooperation and support of the entire organization because
project management must be fully integrated into the culture and operation of
the organization. Let us take a quick look at each maturity level and what might
be involved.
3.4.2.1 Getting to Level 1: Initial
Since level 1 maturity in project management is characterized by project teams
acting in an ad hoc manner without the benefit of any documented processes,
the only requirement for level 1 maturity is that the project team is following
some approach of their choosing. The approach need not be defined beforehand
92 Project Management Process Improvement
and in fact will most likely arise on an as-needed and when-needed basis. There
is no stipulation as to how complete or how well thought that approach might
be. It might be very sound and based on good experiences from earlier projects
of one or more team members or may be process information taken from team
member experiences from previous employers. Level 1 maturity is almost auto
-
matically attained. The only requirement is that teams be engaged in some form
of project management with no specification as to how, when, or why.
3.4.2.2 Getting to Level 2: Structured
Level 2 maturity is a process-oriented versus practice-oriented level of maturity.
To be at level 2 means that an organization has undertaken and completed a
project to establish a documented and standardized project management meth
-
odology. This is a big step for most organizations because it is a precursor to a
cultural shift wherein the organization will be asked to integrate these new proj
-
ect management processes and procedures into its other business processes.
3.4.2.3 Getting to Level 3: Institutionalized
The major focus of level 3 maturity is on the utilization of the processes defined
as part of attaining level 2 maturity. Getting to level 3 is a daunting task in most
organizations. There are several reasons for this:
•
The project management process was not developed with broad
involvement of those impacted by or expected to use these new
processes. Now they do not feel any ownership and hesitate or even
push back when expected to use the new processes.
•
The project management process(es) do not meet the needs of many of
the projects and therefore are not used or used only selectively.
•
The project management process documentation is not clear, there are
few templates to use, or the templates are too cumbersome. Project
teams tend to fall back on those processes and templates they have used
successfully in the past or have developed out of necessity.
•
The training has been less than enthusiastically accepted and has not
been seen as effective.
If you have a role to play in bringing your organization to level 2 project
management maturity, you need to develop plans to mitigate these risks. Let us
take a look at each one in a little more detail.
There is a prime directive that I will share with you. It is based on many
years experience in designing and deploying methodologies. My directive is this:
Whenever you are charged with the responsibility of developing a new process, you
must meaningfully involve all of the parties that will affect or can be affected by the
new process. This is accomplished in at least three ways. The first is to populate
Assessing and Reporting Maturity Level 93
your task force with a range of professionals who will be expected to use the new
process. Look for those whose opinions are highly regarded. If they are respected
by their peers, that respect will positively impact the acceptance of their output.
This will create ownership and a sense of commitment to the changes about to
come. Implementation success is much more probable. The second is to con
-
duct a stakeholder analysis as part of planning the project to develop the new
process. That analysis will identify everyone who has a need to know, what they
need to know, how they need to know it, and the frequency with which they get
to know it. Build a communications management plan into the WBS and exe
-
cute it! The third is to request and recruit as reviewers those who have a vested
interest in the outcome of the process design effort. Give them a chance to com
-
ment and critique working drafts and make sure they know you have considered
their input.
3.4.2.4 Getting to Level 4: Managed
The step from level 3 to level 4 is a major undertaking. The project management
processes are about to become pervasive through the organization. Hardly any
business process will be untouched. It is time to integrate the project manage-
ment process into other business processes and decision making activities. The
impact can be at the strategic level (project selection and portfolio manage-
ment), tactical level (integrating with management decision making and
resource allocation), and at the operational level (integrating with other business
processes and procedures). In some cases the processes will integrate without
much incident, in others some business process redesign may be required, while
in still others a complete redesign effort will have to be undertaken.
3.4.2.5 Getting to Level 5: Optimizing
This is the final step and it may be the easiest of all. Level 5 requires that con
-
tinuous process improvement processes be in place. These will largely involve
feedback loops from the practice of project management into an organized pro
-
gram to analyze the feedback, identify process improvement opportunities, and
initiate those efforts. Chapters 4 through 8 discuss the entire life cycle of an
improvement program.
3.5 Points to Remember
The following is a list of points to remember from this chapter:
•
A single survey has been designed to assess both PD and PP maturity
levels.
94 Project Management Process Improvement
•
The Kiviatt Chart can display multidimensional data on a two-
dimensionsal graph.
•
The Box & Whisker Plot is an intuitive graphic icon that summarizes
the distribution of a sample of data.
•
PD Baseline and a sample of PP data can be superimposed using a Box
& Whisker Plot format to visually show gaps between the process defi
-
nition and its practice.
•
Best practices can be isolated using a Box & Whisker Plot format with a
superimposed PD baseline.
•
Maturity profiles can be plotted at the process level or aggregated to the
knowledge area level.
•
The process maturity matrix is used to identify those processes that are
highly correlated with project CSFs.
•
The zone map can be used to prioritize processes for improvement
initiatives.
•
Target maturity levels should be set for each process.
References
[1] Herrmann, N., The Whole Brain Business Book, New York: McGraw-Hill, 1996.
[2] Belbin, R. M., Team Roles at Work, Boston: Butterworth-Heinemann, 1993.
[3] Wysocki, R. K., Building Effective Project Teams, New York: John Wiley & Sons, Inc.,
2002.
[4] Spear, M. E., Charting Statistics, New York: John Wiley & Sons, Inc., 1952.
[5] Tukey, J. W., Exploratory Data Analysis, Reading, MA: Addison-Wesley Publishers, 1977.
[6] Hardaker, M., and B. K. Ward, “How To Make a Team Work,” Harvard Business Review,
Vol. 65, No. 6, November–December 1987, pp. 112–119.
[7] Standish Group, Chaos Chronicles, Version 2.0, West Yarmouth, MA, 2001.
Assessing and Reporting Maturity Level 95