Studying Shoreline Change in Ky Anh Coastal Area of Ha Tinh Province during 19892013 based on the Digital Shoreline Analysis System (DSAS)45237
Bạn đang xem bản rút gọn của tài liệu. Xem và tải ngay bản đầy đủ của tài liệu tại đây (627.72 KB, 8 trang )
Studying Shoreline Change in Ky Anh Coastal Area
of Ha Tinh Province during 1989-2013 based on the
Digital Shoreline Analysis System (DSAS)
Nguyen An Thinh (1)*
(1) VNU University of Economics and Business, Vietnam National University, Hanoi, Vietnam
* Correspondence:
Abstract: In the context of global climate change and sea level rise, studying shoreline changes is
aimed at not only determining the important engineering techniques but also dealing with challenges
in multi-disciplinary data integration. It becomes interests of many researchers, local government
and local stakeholders. In order to identify the trend of changes, there are various effective models
and systems designed and developed. One of them is the Digital Shoreline Analysis System (DSAS)
integrated in a geographical information system (GIS), developed by the USGS. The DSAS is applied
for monitoring the shoreline changes in the district of Ky Anh, Ha Tinh province from 1989 to 2013.
The research results consist of determining the shoreline positions during the study period based on
using Landsat images; the quantification of the erosion and accretion relationship between 1989 and
2013 in different topographical segments; and a map of affected areas where the shoreline is equal to
the high-tide water line. Results, which were updated to the internet, would offer the decision
makers, researchers and local communities to be benefits of monitoring shoreline change and to help
have quickly response to the abrupt change in the area.
Keywords: Digital Shoreline Analysis System (DSAS); shoreline change; erosion; accretion; Ky Anh
coastal area.
1. Introduction
Vietnam is one of the most vulnerable countries damaged badly by hazards and ricks
of climate change impacts (IPCC, 2007, 2014) which effect strongly on over 3,000 kilometers
long coastal line. The coastal area of Vietnam are mainly influenced of three types of hazards
that the integrated effect could be associated with climate changes: including drought, sea
level rise, and extreme weather conditions. The turns of these primary effects cause floods
and erosion. The impacts of both sea level rise and storms result in the erosion of beaches
and dune ridges. As well as through the world, from 1990 up to now, the coastal erosion in
Vietnam has witnessed an increase in both length and intensity, especially in the low lying
coastal land made by unconsolidated sediments (sand, silt-clay).
Digital Shoreline Analysis System (DSAS henceforth) has its own advantages for
examining historical shorelines compared with traditional ground survey techniques
(Thieler et al., 2009). It is considered as a practical application for decision-making in coastal
management. The most recently, the combination of remote sensing, GIS and DSAS were
applied in coastal studies which can be found in notable research on determining the rate of
shoreline change along the Kenitra coast, Morocco during 1969-2009 (Moussaid et al., 2015),
along the Mangalore coast, West Coast of India (2005-2013) (Aedla et al., 2015), in the North
of the Coramandal Coast (1972-2013) (Salghuna and Bharathvaj, 2015), along the Tamil
Nadu coast (1978 to 2014) (Natesan et al., 2015), along the Karnataka coast (1991-2014)
(Hegde and Akshaya, 2015). In Vietnam, several shoreline studies applied DSAS are listed
below: calculating shoreline change in Nam Dinh coastal area (To et al., 2008); examining
the rates of coastal shoreline change in Kien Giang coast during 1995 -2009 (Nguyen et al.,
2015); detecting long-term mangrove shoreline changes in Mui Ca Mau (Tran et al., 2014).
This paper aims at identifying historical shoreline changes during the period 1989-2014 in
the Ky Anh coastal area of Ha Tinh province (in central Vietnam). The rate of erosion and
accretion was calculated based on the data derived from satellite images and the result of
DSAS analysis.
The rest of the paper is organized as follows: Section 2 presents the DSAS
methodology; case study results are indicated in Section 3; and finally, conclusion and
recommendation are determined in Section 4.
2. DSAS methodology
DSAS, or USGS DSAS (United States Geological Survey Digital Shoreline Analysis
System), is a GIS tool (a free available ArcGIS extension) designed by the United States
Geological Survey (USGS). Its web-based version (DSAS web) was published in 2013 (USGS,
2013). DSAS has been used to analyze coastal change based on detecting shoreline
movements and calculating the rate of change as follows: (i) Mapping historical shoreline
position by using available spatial data; (ii) Evaluating historical changes and trends of
selected transects; (iii) Analyzing shoreline geometry; and (iv) Predicting shoreline patterns.
The DSAS approach calculates rates of shoreline change through measuring gaps
between the shoreline positions in specific periods of time. According to Thieler et al., (2009),
it is possible for DSAS to measure statistical data. Table 1 lists measures which can be
showed the spatial patterns of shoreline change statistics.
Table 1: Statistical measures in DSAS
Statistical measures
Definition
Shoreline Change
A measure of the total change in shoreline movement which considers all
Envelope (SCE)
available shoreline positions and reports their distances without reference
to their specific dates.
Net
Shoreline
A measure reports the distance between the initial position and the latest
Movement (NSM)
position of shoreline.
End Point Rate
A measure derived from dividing the distance of shoreline movement
(EPR)
during the period of time between the initial positions and the latest
position of shoreline.
Linear Regression
A measure that determines a rate-of-change statistic by fitting a least
Rate (LRR)
square regression to all shorelines at a specific transects.
(Source: Thieler et al., 2009)
3. The case analysis
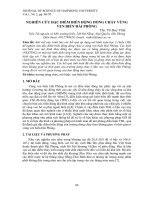
As shown in the figure 1, Ky Anh is the furthest South-Western district of the Ha
Tinh province. The total district area is 105,428 hectares, entailing 7 coastal communes from
Ky Xuan in the North to Ky Nam in the South. The coastline of 7 communes span 63
kilometers, mainly covering by beaches, sandy and and the lesser extent of rocky. Behind
the dune ridge, delta zones are covered with irrigated rice fields. A small area, which is
dryer, is used for growing peanuts and vegetables. There are low hills which are covered by
conifers, mixed leafy trees and scrub vegetation. Mangroves, which are merely planted,
surround rivers. Moreover, there are some lakes, one of which is artificial, providing water
for the irrigation of rice.
The most significant driving forces (from both nature and human) of coastal erosion
in Ky Anh are storms, floods, and sandy collection (in Vung Ang Economic Zone). The Ky
Anh coastal area is frequently affected by tropical storms and induced flooding. Storms
happened from the Southeast to the Northwest or from the Southeast East to the Northwest
West over the area. The frequency increases from January to August, decreasing and
dipping in December. During the last 50 years, the Ha Tinh province was affected by 47
storms, 18 of which impacted directly on the Ky Anh coastal area (ISPONRE, 2009). Ky Anh
witnessed on average 0.9 storm per year, and there was an increase in the frequency during
recent years. In Vietnam, there were 285 tropical storms between 1951 and 2010 (on average
4.75 tropical storms per year), 38 tropical storms from 2011 to 2013 (Matsumoto and Shoji,
2003). However, during recent two half decades (1996-2005), there were only 4 storms (on
average 0.4 storms per year). This figure was lower than that in the long term trend analysis,
shown (ISPONRE, 2009). In the study area, a progression of from 20 to 200 m, depending on
the inclination of the beach, is reported for the period 2003-2010.
Figure 1: Selected study area in Ky Anh district (Ha Tinh, Vietnam)
Shoreline changes happening in the study area were investigated based on five
satellite images, which is available in the period 1989-2013. Movements of both the
Mean Low Water (MLW) and Mean High Water (MHW) are observed
through GIS based on DSAS extension developed by the USGS (Thieler et al., 2009).
Shorelines were digitized from individual map. Net Shoreline Movement (NSM) and End
Point Rate (EPR) were calculated. NSM showed the distance between the initial position
(1989) and the latest position of shoreline (2013), which indicated the overall change in
shorelines position over the 24 years. EPR converted net shoreline movement into an annual
rate of shoreline change by dividing the distance of shoreline movement from the intitial
position to latest position of shoreline passed during a particular period of time period. The
200 m of shoreline in 2013 was chosen as baseline, and 961 transects were created (about the
50 meters of a range of distance) and were numbered in order (Figure 2).
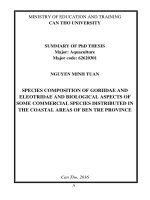
Figure 2: The numbered transects were classified by administrative boundaries
As shown in Figure 3, net erosion and accretion rates were calculated for five sections
of coast, using the same boundaries during the periods 1989-2013. During 1989-1996, the
rapid accretion of more than 25.25 meters per year (average values is approximately 6.6
meters per year), was observed in the southern Ky Anh district with low erosion of 13.86
meters per year (on average -3.4 meters per year). The results show that the accretion trend
in this period was dominance and it changed quickly. During 1996-2006, the main trend of
shoreline changes was the erosion with more than 5.3 meters per year, which was higher
than the accretion rate (3 meters per year) in the study area. Beginning with the erosion, this
process happened continuously in whole shorelines with the range featuring from 24 meters
per year to 92.5 meters per year during 2006-2013.
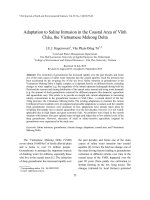
(a) NSM (1989-1996)
EPR (1989-1996)
(b) NSM (1996-2006)
EPR (1996-2006)
EPR (2006-2013)
(c) NSM (2006-2013)
Figure 3: Change of NSM and EPR values during 1989-2013
Net erosion and accretion rates were calculated for each commune as follows:
(-) Ky Xuan commune: The coastal zone was observed at 202 transects, which showed
that accretion is more than erosion in the period of 1989-2006. The Net Shoreline Movement
(NSM) changed from -60 meters at the nearest point to 110 meters at the farthest point. The
changing trend in this period was the accretion, with the average highest rates reducing
from approximately 14 meters per year at the period of 1989-1996 to 5 meters per year at the
period of 1996-2006. However, in the year of 2006 - 2013, the changing trend was
transformed into the erosion. The highest rate was 10 meters per year, with the highest
movement change of erosion increasing to 160 meters.
(-) Ky Phuong, Ky Khang and Ky Ninh commune: The shorelines status experienced a
change from the accretion during 1989-1996 to the erosion during the period 1996-2013. The
Shoreline Movement changed from 5-20 meters in 1989-1996 to -17.27 - 0.0 meters in 19962006; to -14 - 0 meters during 2006-2013. The highest accretion rate was 140 meters per year
during 1989-1996. The dominant processes were the erosion, with the highest rate reducing
from 170 meters per year in 1996-2006 to 140 meters per year during 2006-2013.
(-) Ky Loi commune: In Ky Loi commune, the shoreline movement in 1989-1996 was
at the change from -2.5 to 12.3 meters, with the highest accretion rate reaching
approximately 88 meters per year and highest erosion rate being -20 meters per year.
Therefore, the process of accretion was faster than that erosion during this period. During
1996-2013, the highest erosion rate increased from the -100 meters per year in 1996-2006 to 140 meters per year in 2006-2013. The shoreline movement in 1996-2013 was at the range
from -10 to -20 meters.
(-) Ky Nam commune: The coastal zone in Ky Nam witnessed the erosion more than
the accretion during 1996-2013. The highest shoreline movement changed from -13 to 17
meters in 1989-1996; reducing the range from -25 to 6.3 meters in 1996-2006; and maintaining
the ranged between -21 and 10 meters in 2006-2013. Thus, during the period of 1989-1996,
the erosion rate was 100 meters per year, whereas the accretion rate was 128 meters per year.
The accretion was the dominant process in this period. During remaining years, the highest
erosion rate was 260 meters per year while the highest accretion was 66 meters per year. The
domination processes was transformed into the erosion which featured high rates.
During the 24 years period (1989 - 2013), Ky Anh district witnessed many change in
shoreline. Total 961 transects was established, where there were 881 transect records of the
erosion and 80 transect record of the accretion. There was no transects record of no change
(no accretion or no erosion). The movement of erosion ranged from -1.39 to -223.89 meters,
and the rate ranged from -0.06 to -9.13 meters per year, the average rate of the whole period
was -2.27 meters per year. The erosion point was located in Ky Khang, Ky Ninh communes.
The accretion movement fluctuated from 1.99 to 669.43 meters, and the rate fluctuated from
0.08 to 37.31 meters per year. The average accretion rate was 4.81 meters per year,
distributing in port construction area in Ky Loi commune.
In comparison to the changes between three periods, it can conclude that the erosion
trend saw an increase in both the movement and the rate during a whole period. The rate of
erosion increases from 0.02 to 13.86 meters per year during 1989 - 1996, to 0.01 - 25.66 meters
per year during 1996-2006; and to 0.02-24 meters per year during 2006-2013. The average
erosion rates grows from 3.34 to 5.33 meters per year. The accretion process experienced
downward trend in the rate and the movement (Figure 4).
Figure 4: DSAS shoreline change results in the Ky Anh district
4. Conclusions
Due to significant factors as storm, flooding, and sandy collection, Ky Anh is regard
as one of the coastal areas experiencing the strongest shoreline changes among Central Coast
in Vietnam. The results of DSAS show that during 1989-1996, low erosion was on average
3.4 meters per year. However, from 2006 to 2013, the erosion witnessed an rapid increase,
going up from 24 to 92.5 meters per year. It is similar to recently research on coastal erosion
in this area. For example, Nguyen and Pham (2003) indicate that before 2000, 32.2 kilometers
of Ky Anh shoreline was eroded with the rates featuring from 0.2 meters per year (in Ky Loi
commune) to 15.0 meters per year (in Ky Phuong commune).
Ky Anh is an example of Vietnam wide and international importance of coastal
protection and regional planning. Although Vietnam has many experiences of coastal
protection and flood management, the impacts of intensified storm and monsoon conditions
frequently offer new challenges. Currently the district and the province fortify dykes, plant
protecting tree ridges, and restore and extent mangroves. The shoreline change extraction
and change detection analysis using DSAS could be applied in several fields such as setback
planning, hazard zoning, the erosion and accretion studies, regional sediment budgets and
conceptual or predictive modeling of coastal morpho-dynamics (Aedla et al., 2015).
Especially, a setback planning has been designated as an effective spatial planning for
coastal erosion mitigating in Ky Anh district.
References
Aedla, R., G.S. Dwarakish, D. V. Reddy (2015). Automatic Shoreline Detection and
Change Detection Analysis of Netravati-GurpurRivermouth Using Histogram Equalization
and Adaptive Thresholding Techniques. Aquatic Procedia, 4, Pages 563-570.
Hegde, A.V., B.J. Akshaya (2015). Shoreline Transformation Study of Karnataka
Coast: Geospatial Approach. Aquatic Procedia, 4: 151-156.
Moussaid, J., A.A. Fora, B. Zourarah, M. Maanan, M. Maanan (2015). Using
automatic computation to analyze the rate of shoreline change on the Kenitra coast,
Morocco. Ocean Engineering, 102(1): 71-77.
Natesan, U., A. Parthasarathy, R. Vishnunath, G.E.J. Kumar, V.A. Ferrer (2015).
Monitoring Longterm Shoreline Changes along Tamil Nadu, India Using Geospatial
Techniques. Aquatic Procedia, 4: 325-332.
Nguyen, H.H., McAlpine C., Pullar D., Leisz S.J., Galina G. (2015). Drivers of coastal
shoreline change: case study of Hon Dat coast, Kien Giang, Vietnam. Environmental
Management: 55(5): 1093-1108.
Salghuna, N.N., S.A. Bharathvaj (2015). Shoreline Change Analysis for Northern Part
of the Coromandel Coast. Aquatic Procedia, 4: 317-324.
Thieler, E.R., Himmelstoss E.A., Zichichi J.L., Ergul A. (2009). Digital Shoreline
Analysis System (DSAS) version 4.0—An ArcGIS extension for calculating shoreline change:
U.S. Geological Survey Open-File Report 2008-1278.
To, D.V., Thao, P.T.P. (2008). A shoreline analysis using DSAS in Nam Dinh coastal
area. GeoInformatics: 4(1): 37-42.
Tran, T.V., Tien, T.X., Phan, N.H., F. Dahdouh-Guebas, N. Koedam (2014).
Application of remote sensing and GIS for detection of long-term mangrove shoreline
changes in Mui Ca Mau, Vietnam. Biogeosciences, 11, 3781-3795.
Vu, V.P., Nguyen, H., Duong, T.N., Luu, T.T., Vu, L.P., Le, D.N. (2013). Study on
shoreline change of Nam Bo from Ba Ria-Vung Tau to Kien Giang Provinces for integrated
coastal zone management. Resource & Environment, 22-(180)/11-2013, 79-82 (in
Vietnamese).
Vu, V.P., Nguyen, H., Vu, L.P. (2008). Coastal erosion of Vietnam: Status state and
reasons. Geomorphological Comparative Research on Natural Disaster Mitigation in the
Coastal Regions of Trpical Asia. Proceedings of Phuket, Ho Chi Minh, and Pattaya
Conferences, March 2008, Nagoya University, Japan, 131-137.