Tài liệu Báo cáo " Survey of WO3 thin film structure built on ito/glass substrates by the Raman and xrd spectroscopies" doc
Bạn đang xem bản rút gọn của tài liệu. Xem và tải ngay bản đầy đủ của tài liệu tại đây (206.86 KB, 9 trang )
VNU Journal of Science, Mathematics - Physics 25 (2009) 47-55
47
Survey of WO
3
thin film structure built on ito/glass substrates
by the Raman and xrd spectroscopies
Le Van Ngoc
1,
*, Tran Cao Vinh
1
, Le Quang Toai
1
, Nguyen Duc Thinh
1
Huynh Thanh Dat
2
, Tran Tuan
1
, Duong Ai Phuong
1
1
University of Science, Vietnam National University - Ho Chi Minh city, 227 Nguyen Van Cu, Vietnam
2
Vietnam National University - Ho Chi Minh city, Linh Trung, Thu Duc, Vietnam
Received 17 January 2009; received in revised form 12 March 2009
Abstract. Tungsten oxide film was deposited on ITO-coated glass by using RF magnetron
sputtering method from WO
3
ceramic target. Thin film preparation – process took place in Ar + O
2
plasma. The dependence of tungsten oxide film structure on experiment conditions was
investigated by X-ray diffraction (XRD) Raman spectroscopy. In this paper, we considered that
the thickness of ITO layers about 150nm to 350nm clearly effects on the Raman and XRD
spectrograms of WO
3
films.
Keywords: WO3 structure, WO3 /ITO/glass, Raman spectroscopy.
1. Introduction
WO
3
thin films have been studied for along time due to their unique properties and their potential
applications into. And the most promising application of WO
3
thin films is electrochromic devices
based on electrochromism, in which optical properties WO
3
alter reversibly under electrical bias
applied [1-3]. Moreover, recently WO
3
thin films have been studied to fabricate toxic gas sensors,
such as NO
x
, H
2
S, NH
3
, CO and some popular others like H
2
, O
2
, O
3
, Cl
2
, SO
2
, CH
4
[4-7]. Both
electrochromism and gaseous sensitization are based on the reversible diffusion of particles along the
vacant tunnels of WO
3
perovskite structure. Thus, having large and oriented vacant tunnels will be a
great advantage.
Furthermore, many methods are used to prepare WO
3
thin films, such as sputtering [8-11], sol –
gel [12], spray pyrolysis [13-14], anodizing technique [15], thermal evaporation [15-21]. And different
preparation methods have respective advantages in film quality and application.
Besides optical and electrical properties, WO
3
crystalline structure has been studied by utilizing
XRD and Raman Spectroscopy. XRD surveys focus on 20
o
– 25
o
range of diffraction angles and
Raman spectroscopy surveys focus on 200 cm
-1
– 1000 cm
-1
range of wave number.
In this paper, WO
3
layers were deposited on ITO/glass substrates. The thickness of ITO layers is
measured approximately 150, 200, 250, 300, 350 nm, respectively. From XRD spectrograms, we
______
*
Corresponding author. Tel.: 0908283530
E-mail:
L.V. Ngoc et al. / VNU Journal of Science, Mathematics - Physics 25 (2009) 47-55
48
considered that the thickness of ITO coaters clearly effect on WO
3
crystalline structure. In order to
understand what occurred inside and whether nano particle phases exist, we used their Raman
spectroscopy. And 600 cm
-1
– 1000 cm
-1
range was analyzed into different basic vibration. With
samples with ITO layer about 300nm thickness and more, in Raman spectrum there is an odd peak at
680 cm
-1
, which could be related to nano phases. However, the absence of 950 cm
-1
refuses that
assumption. The origin of this peak will be focused on in this paper.
2. Experimental
In this research, ITO and WO
3
layers were prepared by magnetron sputtering in (O
2
+ Ar) plasma.
Oxygen and argon gases with high purity (99.999%) were used in deposition processes. Our sputtering
chamber was evacuated down to 10
-7
torr by using turbo pump before introducing gases. ITO layers
were deposited on glass substrates by DC magnetron sputtering with their thickness about 150, 200,
250, 300, 350 nm respectively. Then WO
3
layers were deposited on ITO/glass by RF magnetron
sputtering. The power is 100 W and the deposition time is about 30 minutes.
After deposition, WO
3
/ITO/glass systems were annealed in the atmosphere at 400
o
C temperature
during four hours. The crystalline structure of WO
3
thin films was investigated by XRD patterns using
Cu K
α
radiation at 1.5406 Ǻ wavelength and Raman spectroscopy using He – Ne excitation (632.8
nm). In order to analyze broad peaks, included many basic vibration modes of Raman spectrum, we
used Origin 7.5 program with Gaussian function. This information gives us exact evaluation of the
existence of different phases in our films.
3. Results and discussion
3.1. The effect of the thickness of ITO layer on XRD spectrum
All WO
3
thin films, created in these experimental conditions, were transparent in visible region. In
order to study their structural properties, we used XRD spectrum with an attention to 22
o
– 25
o
range
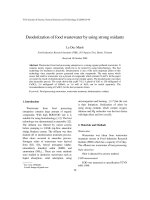
of 2θ diffraction angle due to the existence of three highest peaks. Figure 1 shows XRD pattern of
WO
3
powder sample with three peaks with strongest magnitudes (001), (020), (200). They correspond
with 2θ = 23.29
o
, 23.77
o
, 24.51
o
with lattice plane distances d = 0.382 nm, 0.374 nm, 0.363 nm,
respectively. Therefore, our WO
3
powder sample has a monoclinic structure (m-WO
3
) with α = γ
=90
o
, β = 90.15
o
, a = 0.7285 nm, b = 0.7517 nm, c = 0.3835 nm [22] and two highest peaks, located at
(001) and (200) (international JCPDC database, JCPDC 5 - 363).
L.V. Ngoc et al. / VNU Journal of Science, Mathematics - Physics 25 (2009) 47-55
49
2 0 3 0 4 0 5 0
0
5 0 0
1 0 0 0
1 5 0 0
2 0 0 0
2 5 0 0
3 0 0 0
( 0 0 1 )
( 0 2 0 )
( 2 0 0 )
intensity (cps)
2 T h e t a ( d e g )
W O
3
p o w d e r s a m p l e
( 4 0 0 )
15 20 25 30 35 40 45 50 55
W O
3
(001)
W O
3
pow de r
W O
3
/IT O 150nm
W O
3
/IT O 350 nm
W O
3
/IT O 300 nm
W O
3
/IT O 200nm
2theta (d eg)
W O
3
/IT O 250nm
W O
3
(2 00)
Fig. 1. XRD spectrum of m-WO
3
powder.
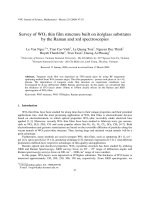
Fig. 2. XRD spectra of WO
3
films on layers ITO with different thicknesses.
Figure 2 is XRD spectra of films on layers ITO with different thicknesses. However their peaks
distribute in such a small range of the angle 2θ, that we couldn’t confirm whether our films have a
monoclinic structure (with parameters α = γ = 90
0
, β = 90,15
0
, and a = 0,7285nm, b = 0,7517nm, c =
0,3835nm) or a orthorhombic one (o-WO
3
with α = β = γ = 90
0
, a = 0,7341nm, b = 0,7570nm, c =
0,3877nm) because the values aren’t clearly distinctive.
Analyzing figure 2, we recognized that ITO layer with thickness about 150 nm, XRD shows a
sharp peak (200), accompanied by a weaker one (001). Between these peaks was a even weaker peak
(020), like a shoulder of (200) font. With an increase in the thickness from 150 nm to 350 nm, XRD
spectra expose a gradual decrease of the magnitude of peak (200) and a raise of peak (001). Moreover,
peak (020) is shown obviously in the case of 250 nm. When the ITO layer have a thickness about 300
nm, a growth of WO
3
show a great anomaly in orientation due to the appearance of peaks in larger
diffraction angles. With 350 nm thickness ITO player, WO
3
film preferentially grows along direction
(001) with larger lattice plane distance (0.4001 nm). This value is nearly equal to (001) lattice plane
L.V. Ngoc et al. / VNU Journal of Science, Mathematics - Physics 25 (2009) 47-55
50
distance of tetragonal structure (t-WO
3
). Therefore, we assumed that the crystalline structure of this
WO
3
film is tetragonal (with α = β = γ = 90
o
, a = b = 0.525 nm, c = 0.392 nm). With this structure,
vacant tunnels along c – axis are narrower than these ones of m-WO
3
and o-WO
3
. WO
3
film
preferentially grow along direction (001), (200), however, both of these two possible growth directions
lead us to the conclusion that vacant tunnels grew perpendicular to film surface. And with
preferentially growing along (200) direction of o-WO
3
, vacant tunnels achieved the largest size of
WO
3
– perovskite.
In this research, all the peaks of WO
3
film in XRD spectra are shifted to smaller diffraction angles
than these ones of powder sample. This result shows that the lattice plane distance increases due to a
compressed stress, because WO
3
has a coefficient thermal expansion smaller than glass does and
because of the heteroepitaxial growth of films WO
3
in which the parameters of plane ITO (440) are
slightly larger than the ones of WO
3
planes. The relation between shifts of XRD peaks and total film
stress is given by equation:
(2 )
4 tan
f
E
θ
σ
υ θ
∆
=
Where σ
f
is total film stress, θ is Bragg diffraction angle, E is Young modulus, υ is Poisson
coefficient. ∆(2θ) will get a minus value if the total film stress is compressed stress [23]. Thus due to
this thermal stress, in order to survey WO
3
, we have combined the results from both XRD and Raman
spectrum investigations. Beside that, from XRD patter, the grain size of WO
3
film were determined by
Scherrer equation and all of them valued in 30 nm to 35 nm.
3.2. Micro – Raman Studies
Due to structural modifications of WO
3
films, deposited on of ITO layers with different
thicknesses, we investigated their Raman spectra to find out more helpful information. We divided
ITO layers into two groups, basing on their thicknesses: 150 – 250 nm group and 300 – 350 nm group.
3.2.1. Raman spectrum of WO
3
thin films on ITO layers with thickness, altering from 150 to 250nm
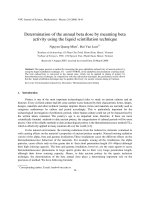
Figure 3 shows XRD and Raman spectra of WO
3
powder sample and WO
3
films, deposited on ITO
layers/150 nm, 200 nm and 250 nm thickness. Generally, these films have ratios I
(200)
/I
(001)
in XRD
pattern quite greater than this one of powder sample. Raman spectra of all three samples show sharp
peaks, sited at 265.6 – 269.7 cm
-1
, 703.8 – 709.9 cm
-1
and 799.99 – 803.5 cm
-1
. All these peaks are
characterized for crystalline phase of WO
3
. The Raman peak at 256.6 cm
-1
indicates the deformation
vibration of O – W – O bond and 600 – 900 cm
-1
region relates to stretching vibrations of W – O
bonds [24]. The Raman peak at 950 cm
-1
, attributed to W = O boundary bonds does not exist. So we
assumed that the surface and volume rate is negligible.
In the other hand, three sharp peaks, characterizing WO
3
crystalline phase, located at 263 cm
-1
,
709 cm
-1
, 802 cm
-1
do not indicate any difference in structure between WO
3
films and WO
3
powder
sample and between one film to another. These numbers show no difference in structure between WO
3
powder and WO
3
films. However, we could not eliminate a probability of orthorhombic phase in these
films because the parameters of orthorhombic and monoclinic primary cells are nearly the same.
L.V. Ngoc et al. / VNU Journal of Science, Mathematics - Physics 25 (2009) 47-55
51
3.2.2. Raman spectrum of WO
3
thin films on ITO layers with thickness, altering from 300 to 350nm
Figure 4 shows the Raman and XRD spectrum of WO
3
films, deposited on 300 nm and 350 nm
ITO layers and WO
3
powder sample. From XRD spectra of WO
3
/ ITO 300 nm film intensity of peak
(001) exceeds intensity of peak (200). And WO
3
film, deposited on 350 nm ITO layer preferentially
grew in (001) direction.
2 0 0 4 0 0 6 0 0 8 0 0 1 0 0 0
0
5 0 0 0
1 0 0 0 0
1 5 0 0 0
2 0 0 0 0
2 5 0 0 0
3 0 0 0 0
1 2 7 . 7 7 1
2 6 5 . 6
3 2 0 . 1 1 4
7 0 3 . 7 7 1
7 9 9 . 4 2 9
R a m a n s h if t ( c m
- 1
)
Intensity (a.u)
W O
3
/ I T O 1 5 0 n m
2 0 3 0 4 0 5 0
0
2 0 0 0
4 0 0 0
6 0 0 0
8 0 0 0
Intensity (cps)
2 T h e t a ( d e g )
W O
3
/ I T O 1 5 0 n m
( 2 0 0 )
( 0 0 1 )
2 0 3 0 4 0 5 0
0
2 0 0
4 0 0
6 0 0
8 0 0
1 0 0 0
1 2 0 0
1 4 0 0
1 6 0 0
1 8 0 0
2 0 0 0
( 0 2 0 )
( 0 0 1 )
( 2 0 0 )
W O
3
/ I T O 2 5 0 n m
Intensity (cps)
2 T h e t a ( d e g )
2 0 0 4 0 0 6 0 0 8 0 0 1 0 0 0
1 0 0 0
2 0 0 0
3 0 0 0
4 0 0 0
5 0 0 0
6 0 0 0
1 3 0 . 8 5 7
2 6 9 . 7 1 4
3 2 3 . 2
7 0 9 . 9 4 3
8 0 3 . 5 4 3
R a m a n s h if t ( c m
- 1
)
Intensity (a.u)
W O
3
/ I T O 2 5 0 n m
2 0 3 0 4 0 5 0
0
1 0 0 0
2 0 0 0
3 0 0 0
4 0 0 0
5 0 0 0
6 0 0 0
7 0 0 0
W O
3
/ I T O 2 0 0 n m
(0 0 1 )
(2 0 0 )
Intensity (cps)
2 T h e ta ( de g )
2 0 0 4 0 0 6 0 0 8 0 0 1 0 0 0
0
5 0 0 0
1 0 0 0 0
1 5 0 0 0
2 0 0 0 0
1 3 0. 8 5 7
2 6 8 . 6 8 6
3 2 3 . 2
7 0 7 . 8 8 6
8 0 2 .5 1 4
R a m a n s h i f t (c m
-1
)
Intensity (a.u)
W O
3
/ IT O 2 0 0 n m
2 0 0 4 0 0 6 0 0 8 0 0 1 0 0 0
2 0 0 0
4 0 0 0
6 0 0 0
8 0 0 0
1 0 0 0 0
1 2 0 0 0
1 4 0 0 0
1 6 0 0 0
1 2 7 . 3 2 3
1 7 8 . 9 3 3
2 6 2 . 9 2 5
3 2 4 . 6 5 5
7 0 9 . 2
8 0 2 . 3
R a m a n s h if t (c m
- 1
)
Intensity (a.u)
W O
3
p o w d e r s a m p l e
Fig. 3. XRD patterns and Raman spectrum
of WO
3
thin films on ITO layers with
different thichnesses
a) 150nm ITO; b) 200nm ITO;
c) 250nm ITO; d) WO
3
powder.
d)
a)
b)
c)
L.V. Ngoc et al. / VNU Journal of Science, Mathematics - Physics 25 (2009) 47-55
52
Comparing between XRD spectra of WO
3
films and WO
3
powder, we can not deduce any difference
in crystalline structure. However, in the Raman spectrum of WO
3
/ITO 300 nm (fig. 4a) besides two
characteristic peaks of crystalline structure, which are located at 267.66 cm
-1
of the deformation mode
and 802.5 cm
-1
of covalent bonds W – O, there is only one clear modification, comparing to Raman
spectra of film on thinner ITO layers. The only difference is a composition of two peaks, one at 680 cm
-1
and the other at 709 cm
-1
. And one possible reason is the existence of nano phases. [25]
200 400 600 800 1000
10000
12000
14000
16000
18000
20000
22000
24000
253.257
688.343
799.429
Raman shift (cm
-1
)
Intensity (a.u)
W O
3
/ ITO 350nm
20 30 40 50
0
500
1000
1500
2000
2500
3000
3500
WO
3
(001)
Intensity (cps)
2 Theta (deg)
WO
3
/ ITO 350nm
20 30 40 50
0
200
400
600
800
1000
(001)
(200)
WO
3
/ ITO 300nm
Intensity (cps)
2 Theta (deg)
200 400 600 800 1000
0
10000
20000
30000
40000
50000
130.857
267.657
701.714
802.514
Raman shift (cm
-1
)
Intensity (a.u)
W O
3
/ ITO 300nm
200 400 600 800 1000
2000
4000
6000
8000
10000
12000
14000
16000
127.323
178.933
262.925
324.655
709.2
802.3
Raman shift (cm
-1
)
Intensity (a.u)
WO
3
powder
Figure 4: Raman spectrum and XRD
patterns of WO
3
on ITO layers with
different thicknesses
a) 300nm ITO; b) 350nm ITO;
c) WO
3
powder.
a)
b)
c)
L.V. Ngoc et al. / VNU Journal of Science, Mathematics - Physics 25 (2009) 47-55
53
Nevertheless, like Raman spectra of WO
3
/ITO 150 nm, WO
3
/ITO – 200 nm and WO
3
/ITO – 250
nm, 950 cm
-1
peak, which corresponds to W = O boundary bonds, does not appear due to the annealing
process. It means that the ratio of surface to volume is negligible. And some calculations, basing on
formula Scherrer also shows that the size of grains in all WO
3
films is about 30 – 35 nm. Moreover the
annealing process and the breakage of the double bonds W = O also result in the limit of the shift to
the 680 cm
-1
. Thus, in the films WO
3
/ITO 300 nm nanocrystal phase does not produce any strong peak
about 680 cm
-1
. Therefore, we believe that the appearance of peak closed to 680 cm
-1
have another
origin, such as phase tetragonal (t-WO
3
) or phase orthorhombic (o-WO
3
).
In order to understand more about the mentioned peak, we used program Origin 7.5 to analyze the
doublet 701.7 cm
-1
of thin film WO
3
/ITO 300nm and investigated XRD and Raman spectra of
WO
3
/ITO 350 nm. Analyzing the spectra of WO
3
/ITO 300 nm, we received one peak which is not
sharp and corresponds to the vibration mode of WO
3
-H
2
O. The two other sit at 703 cm
-1
and 678 cm
-1
.
And the best fit was get by considering the peak 802 cm
-1
as a combination of two separated ones at
803 cm
-1
and 797 cm
-1
as shown in figure 5. Moreover, in some previous researches of other authors,
there were only two peaks in the range from 600 to 900 cm
-1
, which are attributed to covalent vibration
of chemical bonds W – O in the octahedral WO
6
around W centers of lattice. Therefore, the existence
of both four peaks 803cm
-1
; 797cm
-1
; 703cm
-1
and 678cm
-1
proves that in our thin films, there are two
types of crystalline structures: m-WO
3
phase with 803 cm
-1
and 703cm
-1
and t-WO
3
phase or o-WO
3
phase with the two characteristic peaks at 797 cm
-1
and 678cm
-1
.
However, from the experiments of E.Cazzanelli [26], the phase transition from orthorhombic
phase to tetragonal phase is accompanied by the disappearance of peak at 700 cm
-1
, only peak at 800
cm
-1
remains. So, in WO
3
/ITO 350 nm the t-WO
3
phase could not exist, the two possible ones are m-
Fig. 5. Raman spectra of WO
3
thin film/ITO 300nm/glass substrate.
600 700 800 900
0
1x10
4
2x10
4
3x10
4
4x10
4
5x10
4
644.66cm
-1
W O
3
/ IT O 300nm
678.26cm
-1
706.25cm
-1
797.29cm
-1
Intensity (a.u.)
Ram an shift (cm
-1
)
801.56cm
-1
Fitting Res ults
L.V. Ngoc et al. / VNU Journal of Science, Mathematics - Physics 25 (2009) 47-55
54
WO
3
and o-WO
3
. Therefore, we believed that a pair of peaks at 803 cm
-1
; 708 cm
-1
correspond to mo-
WO
3
phases and the another pair goes for the o-WO
3
phases. In that case, the vibrational frequencies
of m-WO
3
are quite higher than these of o-WO
3
. And the reason is that parameters of crystalline
structure of m-WO
3
are smaller than that of o-WO
3
or the force constant in W-O bonds in the former is
larger than in the later phase.
XRD spectrum of WO
3
/ITO 350 nm sample shows that WO
3
film grows along (001) direction
preferentially, (020) and (200) peaks are weakened down to the font of (001) peak. In these films WO
3
particles are well crystallized. For a Raman spectrum of that film, peaks, characterizing crystalline
phases, such as 799.4 cm
-1
, 688.3 cm
-1
and 253.26 cm
-1
have appeared and the last two of them are
shifted to smaller wave numbers, comparing to spectra 3a, 3b and 3c. Furthermore, peak 688,3 cm
-1
in
the spectrum of WO
3
/ITO 350 nm is a combination of peaks at 680 cm
-1
of o-WO
3
and at 700 cm
-1
of
m-WO
3
, where the former is much stronger than the later as shown in figure 6.
4. Conclusion
In this research, we have prepared WO
3
films on ITO/ glass substrates by magnetron sputtering
and annealing in the atmosphere. With thin ITO coaters, 150 nm, WO
3
film grew along (200) plane
preferentially. An increase in the thickness of ITO layer, WO
3
film orientation changes from (200) to
(001) gradually.
Fig. 6. Raman spectra of WO
3
thin film/ITO 350nm/glass substrate.
600 650 700 750 800 850 900
1.0x10
4
1.2x10
4
1.4x10
4
1.6x10
4
1.8x10
4
2.0x10
4
2.2x10
4
2.4x10
4
606.30cm
-1
698.02cm
-1
800.16cm
-1
801.61cm
-1
679.40cm
-1
WO
3
/ ITO 350nm
Intensity (a.u.)
Raman shift
(
cm
-1
)
Fitting Results
L.V. Ngoc et al. / VNU Journal of Science, Mathematics - Physics 25 (2009) 47-55
55
In our experiments, films have many different crystalline structures with m-WO
3
and o-WO
3
to be the majority. With layer ITO with thickness 250 nm or thinner, the majority is m-WO
3
with
Raman peaks at 263 cm
-1
; 709 cm
-1
; 802 cm
-1
. However when the thickness is 300 nm or higher, the
peaks, characterizing to orthorhombic phase at 797 cm
-1
; 678 cm
-1
emerge clearly. Films with
thickness 300 nm could be regarded as a transitional phase with both m-WO
3
and o-WO
3
phases.
References
[1] C.G Granqvist, E.Alvendamo, A.Zeus, Thin Solid Film 442 (2003) 201.
[2] Vu Thi Bich, Nguyen Thanh Binh, Nguyen Thi Bich Ngoc, A.Hugot-Le Goff. Proc. IWOS’2000, Hanoi, Vietnam, 477.
[3] Pham Duy Long, M.C. Bernard, Nguyen Thi Tu Oanh, A.Hugot-Le Goff, Nguyen Nang Dinh. Proc. IWOS’2000,
Hanoi, Vietnam, 473.
[4] Nguyen Van Nha, Nguen Thi Bao Ngoc, Nguyen Van Hung, Thin Solid Film 334 (1998) 113.
[5] K.H. Lee, Y.K.Fang, W.J.Lee, J.J.Ho, K.H.Chen, K.S.Liao, Sens. Actuators B69 (2000) 96.
[6] E. Llobet, G.Molas, P.Molinas, J.Calderer, X.Vilanova, J.Bremers, E.Sueiras, X.Correig, J.Electrochen, Second edition,
147 (2000) 776.
[7] M.D. Antonik, J.E.Scheinder,E.L.Wittman,K.Snow, J.F.Vetelino, R.J.Cad, Thin Solid Film 256 (1995) 247.
[8] K.J. Lethy, D.Beena, R.Vinod Kumar, V.P.Mahadevan Pillai, V.Ganesan, V.Sathe, D.M.Phase, Appli. Phys A91 (2008)
638.
[9] S.C. Moulzolf, L.J. LeGore, R.J. Lad, Thin solid films 400 (2001) 56.
[10] Huiyao Wang, Pei Xu, Tianmin Wang, Thin solid films 388 (2001) 68.
[11] Christian Salinga, Hansjörg Weis, Matthias Wuttig, Thin solid films 414 (2002) 275.
[12] Toshikazu Nishide, Fujio Mizukami, Thin solid films 295 (1995) 212.
[13] A. Elshafie, H.H. Afify, A. Abdel-All, phys. stat. sol. (a) 174 (1999) 301.
[14] P.S. Patil, P.R.Patil, E.A. Ennaoui, Thin solid films 370 (2000) 38.
[15] M.J. Hutchins, N.A. Kamel, N. El-Kadry, A.A. Ramadan, K. Abdel-Hady, phys. stat. sol. (a) 175 (1999) 991.
[16] P.V. Ashrit, Thin solid films 385 (2001) 81.
[17] G. Macrelli, E. Poli, H. Demiryont, R.Götzelmann, Journal of non-crystalline solids 218 (1997) 296.
[18] G. Leftheriotis, S. Papaefthimiou, P. Yianoulis, A. Siokou, Thin solid films 384 (2001) 298.
[19] H.Y. Wong, C.W.Ong, R.W.M. Kwok, K.W. Wong, S.P. Wong, W.Y. Cheung, Thin solid films 376 (2000) 131.
[20] I. Porqueras, E. Bertran, Thin solid films 377-378 (2000) 8.
[21] J.H. Huh, H.R. Hwang, J.H. Paik, D.D. Lee, J.O.Lim, Thin solid films, 385 (2001) 255.
[22] JCPDS, JCPDS diffraction tables, International centre for diffraction data 1997.
[23] Le Van Ngoc, Tran Tuan, Nguyen Van Den, Duong Ai Phuong, Huynh Thanh Dat, Tran Cao Vinh, Cao Thi My Dung.
Science
&
technology Development VNU-HCMC, Vol. 8, 08/2005.
[24] S.H.Lee, H.M.Cheong, C.E.Tracy, A.Mascarenhas, D.K.Benson, S.K.Deb Electrochim. Act. 44 (1999) 3111.
[25] E.Cazzanelli, L.Papalino, A.Pennisi, F.Simone, Electrochimica Acta 46 (2001) 1937.
[26] E. Cazzanelli, C. Vinegoni, G. Mariotto, A. Kuzmin, J. Purans, Solid State Ionics 123 (1999) 67.