Tài liệu SQL Server 2008 Database Administration– Monitoring and Performance pdf
Bạn đang xem bản rút gọn của tài liệu. Xem và tải ngay bản đầy đủ của tài liệu tại đây (7.03 MB, 148 trang )
p. 1
Chapter 9: Monitoring and
Performance
1
Course 157: SQL Server 2008 Database Administration
Presented by Scott Whigham
p. 2
Overview
• Chapter
Introduction
• Tools for
Monitoring
• SQL Server
Profiler
Monitoring
• Understanding
and Using the
DMVs
• PerfMon
• Data Collector
What We’re Going to Cover
p. 3
• Chapter 9 is about performance and
exception monitoring your server
• We’ll start with the basics (using Profiler)
and end with new features in SQL Server
2008 (Data Collector)
Chapter Introduction
p. 4
Overview
• Chapter
Introduction
• Tools for
Monitoring
• SQL Server
Profiler
Monitoring
• Understanding
and Using the
DMVs
• PerfMon
• Data Collector
What We’re Going to Cover
p. 5
• There are many built-in tools to monitor
performance and health:
– Activity Monitor and sp_who
• Covered in Chapter 5!
– SQL Server Profiler
• Detailed view of statements issued against instance
– Dynamic Management Views (DMVs)
• “Live” view of server health and activity
– Performance counters and objects (“PerfMon”)
• “Live” view of server health and activity
– Data Collector
• Historical view of server health and activity
Tools of Performance Monitoring
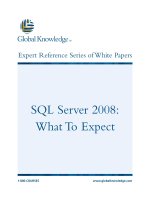
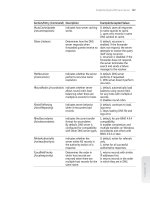
p. 6
Profiler
DMVs
Perf
Mon
Data
Coll.
Provides “live”, real-time reporting?
Can do trend analysis and historical reporting?
Requires
manual load
Requires
manual load
Requires
manual load
Can view SQL issued?
Provides detail-level view or summary?
Detail
Depends…
Summary
Summary
Can be used to diagnose performance problems?
Level of impact on server
Low
None
Negligible
Low-Hi
Difficulty level
100-300
200-400
200-300
300-500
Tools of Performance Monitoring
“But Mr. Scott, how do I know when to use each one?”
p. 7
• Let’s play with Profiler!
In the next video…
p. 8
Chapter 9: Monitoring and
Performance
8
Course 157: SQL Server 2008 Database Administration
Presented by Scott Whigham
p. 9
Overview
• Chapter
Introduction
• Tools for
Monitoring
• SQL Server
Profiler
Monitoring
• Understanding
and Using the
DMVs
• PerfMon
• Data Collector
What We’re Going to Cover
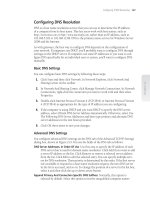
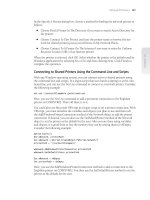
p. 10
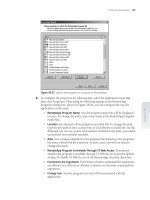
• SQL Server Profiler is a tool for
monitoring real-time queries issued
against your server
– “Old Faithful” - been around for years
– Requires sysadmin or ALTER TRACE server
permission
SQL Server Profiler
p. 11
SQL Server Profiler
p. 12
• DBAs use traces to monitor statements
sent to SQL Server
– We’ve already seen how SQL Server uses “default
traces” in Chapter 7
• Running traces will have an impact on
server performance
– How much? It depends on how much you trace
SQL Server Profiler
p. 13
• SQL Server Profiler is the GUI for
defining, viewing, and replaying traces
– It does not have to be running to create a trace
– Many DBAs create their traces via Profiler and
then script out to jobs
SQL Server Profiler
p. 14
• Running Profiler on a “live” system adds
to an already stressful situation
– Particularly if run interactively on the server
• If you must run Profiler against a “live”
server, run it remotely
• Adds network overhead but this is almost never an
issue today
SQL Server Profiler
p. 15
• Trace data can be stored:
– In a .trc file (fastest)
– In a SQL Server table
• .trc files can be configured to rollover to
a new file after a certain threshold
• Can load .trc file contents into SQL Server
table after trace for maximum flexibility!
SQL Server Profiler
p. 16
• After trace is complete, you can export
results
SQL Server Profiler
p. 17
• Tips on working with Profiler
– Traces can have filters to help minimize the noise
• The better you filter, the less of an impact you put on
the server
– Being able to write queries against the trace
results can help you identify many common trends
and problems
• This requires you load the trace data into a table!
SQL Server Profiler
p. 18
• Let’s play with Profiler!
In the next video…
p. 19
Chapter 9: Monitoring and
Performance
19
Course 157: SQL Server 2008 Database Administration
Presented by Scott Whigham
p. 20
Overview
• Chapter
Introduction
• Tools for
Monitoring
• SQL Server
Profiler
Monitoring
• Understanding
and Using the
DMVs
• PerfMon
• Data Collector
What We’re Going to Cover
p. 21
• DBAs use Dynamic Management Views
(“DMVs”) and Dynamic Management
Functions (“DMFs”) to peek under the
covers
– In the sys schema and begin with dm_
– Used to get up-to-the-second performance
information during critical time
– Often need to JOIN many together to come up
with desired results
Dynamic Management Views
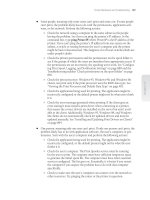
p. 22
Profiler
DMVs
Perf
Mon
Data
Coll.
Provides “live”, real-time reporting?
Can do trend analysis and historical reporting?
Requires
manual load
Requires
manual load
Requires
manual load
Can view SQL issued?
Provides detail-level view or summary?
Detail
Depends…
Summary
Summary
Can be used to diagnose performance problems?
Level of impact on server
Low
None
Negligible
Low-Hi
Difficulty level
100-300
300-500
200-300
300-500
Tools of Performance Monitoring
Reminder…
p. 23
• There are too many DMxs to cover each
one so we’ll cover concepts and core
DMxs
– Over 130 DMVs and DMFs in SQL Server 2008!
• It is important for DBAs to maintain a
script library
Dynamic Management Views
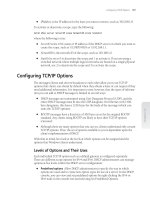
p. 24
• The easiest way to get to know the
DMVs/DMFs is to categorize them
– Below are the more popular categories for
performance monitoring
Dynamic Management Views
Category
DMx prefix
Database
sys.dm_db_
Execution/Sessions
sys.dm_exec_
IO
sys.dm_io_
OS
sys.dm_os_
Transactions
sys.dm_tran_