Tài liệu Báo cáo " Evaluation of ASTER Data Use in Land Use Study in the Mekong delta " pptx
Bạn đang xem bản rút gọn của tài liệu. Xem và tải ngay bản đầy đủ của tài liệu tại đây (314.06 KB, 11 trang )
VNU JOURNAL OF SCIENCE, Earth sciences, T.xxIII, N
0
1, 2007
28
Evaluation of ASTER Data Use
in Land Use Study in the Mekong delta
Pham Van Cu
1
, Einar Lieng
2
, Le Thanh Hoa
3
, Hiroshi Watanabe
4
Hoang Kim Huong
5
1
Centre for Applied Research in Remote Sensing and GIS, College of Science, VNU
2
Norwegian Mapping Authority, Norway.
3
University of Social and Human Sciences of Ho Chi Minh City
4
Earth Remote Sensing Data Analysis Centre, Tokyo, Japan.
5
VTGEO, Institute of Geology, Vietnam Academy of Science and Technology
ABSTRACT. The Mekong Delta in the south of Vietnam is a highly dynamic landscape with
rapid changes in land use. Costal forests of mangrove (Rhizophoraceae, Sonneratiaceae
and Avicenniaceae) and the more inland Melaleuca forests are changed into shrimp ponds
and rice fields. The complex crop calendar and the diversification of land use types strongly
influenced by the agriculture product market create a very complicated land use practice in
the Mekong Delta. This increases costal erosion and gives a local rise in temperature.
Human activities also increase the risk of forest fires, and corridors are therefore made to
protect the remaining forests. Monitoring these changes accurately with a low cost is
essential. Existing maps are inaccurate and not updated. ASTER data have a high spatial
and radiometric resolution and can be acquired at a low cost. We seek a methodology to
optimize differentiation between rice, grassland and forest, forest types, soil types and rice
growth stages. Characteristics of each band, band combinations and band ratios are
examined. Thermal channels are also used in these combinations to monitor human
activities.
1. Introduction
Ca Mau Province in the Mekong Delta has experienced a tremendous change in
land use in the last ten years. Forests and agricultural land have been transformed
into shrimp farms. This has been a trend in several South-East Asian countries in the
late 80’s and early 90’s, and it happened in Vietnam in the 90’s. Environmental costs
are very high when shrimp farms are located in mangrove area (Hazarika et al., 2000).
Shrimp farms have impact on land, water, forest and fishery resources.
Landuse maps of Ca Mau Province from the 1990s are outdated, and efficient and
inexpensive ways of mapping were sought by local administration. Forest stand
parameters are needed, as well as accurate landuse classes. Satellite imagery can be
used for such mapping (Phinn et al., 2000) with a sufficient accuracy. But ancillary
data like detailed elevation model and aerial photographs were not available.
ASTER data are still not widely used, though they have costs and radiometric
and spectral advantages. Hyperspectral analysis is promising to increase the
Evaluation of ASTER data use in land use study in the Mekong Delta
VNU. Journal of Science, Earth Sciences, T.XXIII, N
0
1, 2007
29
discrimination capacity of ASTER data in land use mapping of such a dynamic area as
the Mekong Delta in Vietnam. Forest stand parameters should be possible to extract. A
series of 8 scenes of ASTER of 2002 are used for this analysis. This is done in the
framework of the collaboration between the Centre for Remote Sensing and Geomatics
(VTGEO), the Forest Protection Department (FPD) of Vietnam, and the Earth Remote
Sensing Data Analysis Centre (ERSDAC) of Japan.
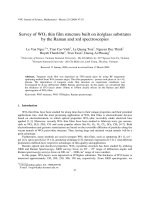
Figure 1. Left: Southern part of Ca Mau. Landsat image from 1993 (NASA mosaic).
Right: ASTER image mosaic (band 432) from 2002. The subsets are 65km wide.
Shrimp farms appear as dark blue, mangrove forests appear as green and agriculture - pink/green
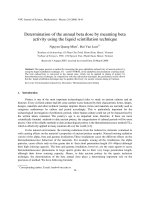
2. Study Area
Figure 2. Location of Ca Mau Province
Pham Van Cu, Einar Lieng, Le Thanh Hoa, Hiroshi Watanabe, Hoang Kim Huong
VNU. Journal of Science, Earth Sciences, T.XXIII, N
0
1, 2007
30
Ca Mau is the southernmost province in Vietnam and covers 5,200km
2
, with a
population of 1.1 million. The land is made of deposits from the Mekong Delta. Almost
half of the area has been changed from forests and agriculture into shrimp farms in the
last ten years. The coastline erodes at a rate of more than 100 meters per year in some areas.
In April 2002, there was a major forest fire in a Melaleuca forest reserve in Ca
Mau. The Forest Protection Department (FPD) of Ca Mau is responsible for
administrating the diminishing forests.
3. ASTER data, preparation and ground truth
The ASTER instrument has three sensors that cover three parts of the
electromagnetic spectra. ASTER images were acquired in cooperation with ERSDAC in
Japan. Acquisitions from the dry season (December to April) in the Mekong Delta are
necessary to minimize cloud cover. However, this might not be optimal regarding the
NDVI for vegetation mapping (Yang et al., 2001).
Table 1. Characteristics of ASTER sensors (Abrams et al., 2002)
Sub system Band No.
Spectral
Range (µm)
Spatial
Resolution
Quant. Levels
1 0.52 - 0.60
2 0.63 - 0.69
3N 0.78 - 0.86
VNIR
3B 0.78 - 0.86
15 m 8 bits
4 1.60 - 1.70
5 2.145 - 2.185
6 2.185 - 2.225
7 2.235 - 2.285
8 2.295 - 2.365
SWIR
9 2.360 - 2.430
30 m 8 bits
10 8.125 - 8.475
11 8.475 - 8.825
12 8.925 - 9.275
13 10.25 - 10.95
TIR
14 10.95 - 11.65
90 m 12 bits
As the topography of Ca Mau is almost flat, geometric correction was performed
without DEM. Available digitized vector data were of low geometric quality - about 50
meter standard deviation. Multitemporal analysis therefore was done with path
oriented data. SWIR and TIR bands were resampled to VNIR resolution during
georeferencing. There were no field measurements for K and C estimation for reflectance
Evaluation of ASTER data use in land use study in the Mekong Delta
VNU. Journal of Science, Earth Sciences, T.XXIII, N
0
1, 2007
31
conversion (Sonobe et al., 2002). The study was therefore performed with DN values.
TIR values were converted from DN to temperature in degree Celsius with Planck’s
formula (Wantanabe, 2003). Multidate thermal bands were normalized with linear
regression before mosaicking and change detection. TIR band 12 and green band
thresholds were used to mask clouds for later analysis. Cloud masking is important for
the spectral unmixing analysis.
Table 2. Image data
Dataset ASTER acquisition Date
Number of
scenes
A 125/149-152 2002-01-12 4
B 126/149-152 2002-02-04 4
C 126/150-151 2003-01-06 2
A field excursion to Ca Mau was arranged in April 2003, at the day of ASTER
acquisition over Ca Mau. No images were acquired due to overcast weather. Ground
truths were collected in Melaleuca forest and costal mangrove forests.
4. Methodology
As the studied area is characterized by a large diversity of land use practice with
a land cover of small size, the discrimination capacity of the data is essential. ASTER
data with a spatial resolution even of 15m are still limited for the detailed land use
mapping of the studied area. Instead of this, ASTER data provide a wide range of
spectra and we assume that there exist some combinations of spectral bands in all
three domains: VNIR, SWIR and TIR which may be the bests for land cover
classification. Thus, the discrimination capacity of different band combinations is to be
verified first for different types of land cover. These combinations will be used for the
classification for the land cover types for which the combination is the most
discriminative. Due to the constraints of the spatial resolution of ASTER data in terms
of parcel size in the studied area, the physical indexes such as NDVI and VSW will be
used to ameliorate the classification results.
5. Band combination analysis
To find optimal band combinations for forest, rice and soil discrimination,
statistics from sample areas were evaluated. Band 7-14 show high degree of correlation.
Two test areas were chosen for test of classification methodology, a melaleuca and
a mangrove subset. Each subset covers 161 km
2
. Clouds were masked out. The images
were classified using a supervised maximum likelihood classification. A classification
scheme with an hierarchical class refinement was made for classification and accuracy
Pham Van Cu, Einar Lieng, Le Thanh Hoa, Hiroshi Watanabe, Hoang Kim Huong
VNU. Journal of Science, Earth Sciences, T.XXIII, N
0
1, 2007
32
assessment. Seven easily distinguishable classes were chosen. Shadows, water, soil,
rice, bush, young planted forest and fully grown forest. The class bush includes scrub,
orchards and other trees than melaleuca and mangrove. Bands 1-6 were used for
classification. The less correlated bands for vegetation mapping are band 2 and 3, while
for water band 1 and 5 are the least correlated.
0
20
40
60
80
100
1 2 3 4 5 6 7 8 9
fallow dry
full grow
fallow moist
ripe
flooded
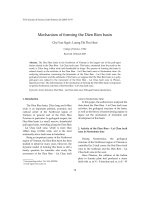
Figure 3. Spectral signatures for rice growth stages.
Visible (1-3) and infrared bands (4-6), values in radiance. Full grow are often referred to as “heading”
15
20
25
30
10 11 12 13 14
fallow dry
full grow
fallow moist
ripe
flooded
Figure 4. Spectral signatures for rice growth stages. Thermal bands (10-14), values in degrees Celsius
6. Classification using the best band combination
Table 3 shows the result of an accuracy assessment based on classification
results with different channels and a digitized ground truth image. The ground truth
image was made from screen digitizing the satellite image. This is not an optimal
approach (Congalton and Green, 1999), but the digitizing was performed independently
from training areas by a well trained person not involved in the classification. The
accuracy of the ground truth image was found to be sufficient due to numerous ground
truth samples and photos taken in the area on the 2003 fieldtrip.
Evaluation of ASTER data use in land use study in the Mekong Delta
VNU. Journal of Science, Earth Sciences, T.XXIII, N
0
1, 2007
33
Table 3. Melaleuca landuse classification, Producer’s accuracy
Band 1-3 Band 1-6 Band 2-4 Band 1-5 Band 1-4
Shadow 9.3 % 19.4 % 18.2 %
20.0 %
19.9 %
Water
73.1 %
70.6 % 64.7 % 70.3 % 68.2 %
Fallow
94.6 %
91.2 % 90.9 % 90.9 % 91.4 %
Grass 43.3 % 53.7 %
61.4 %
58.2 % 60.2 %
Bush 40.4 %
51.5 %
45.7 % 49.4 % 45.7 %
Young Melaleuca
58.4 %
55.9 % 55.0 % 56.0 % 55.0 %
Melaleuca
88.8 %
78.4 % 85.2 % 77.0 % 85.9 %
Overall Accuracy 61.4 % 65.0 % 65.9 % 66.0 %
66.3 %
Band combination 1-4 gives the best overall accuracy, while only the VNIR bands
1-3 can be more accurate for forest only. Confusion between bush and fallow fields
appear within band 1-3. The rice and grassland confusion need to be solved with
postclassification, as rice yields have numerous stages of growth. Rice mapping should
be done with multitemporal images (Wahyunto et al., 2002).
Table 4. Melaleuca landuse classification. Confusion matrix (in %), band 1-4
Water Fallow
Grass
Bush Y.Melale
Melale Total
Water
68.2
0.4 0.2 1.6 0.1 0.0 14.1
Fallow 27.6
91.4
9.6 14.6 4.2 0.0 26.5
Grass 3.6 4.5
60.2
28.4 6.8 4.9 28.1
Bush 0.2 2.9 28.1
45.7
33.5 5.0 19.9
Young Melaleuca 0.4 0.7 1.7 9.3 55.1 4.1 4.6
Melaleuca 0.0 0.0 0.3 0.3 0.3
85.9
6.7
Total 100 100 100 100 100 100 100
7. Spectral unmixing
To find additional parameters like forest stand, spectral unmixing was performed.
This can be done by collecting endmembers for areas of similar spectral variability
(Smith et al,. 1994). A simpler way of spectral mixture analysis is the VSW (vegetation-
soil-water) index (Yamagata et al., 1997). Instead of using the VSW index for
classification directly (ex. with segmentation and clustering, Crepani et al., 2002), post
classification with VSW layers was preferred. Vegetation score was sliced into classes
and overlaid with the classification result. This cross product enables a more refined
classification product.
Pham Van Cu, Einar Lieng, Le Thanh Hoa, Hiroshi Watanabe, Hoang Kim Huong
VNU. Journal of Science, Earth Sciences, T.XXIII, N
0
1, 2007
34
Melaleuca and mangrove are spectrally distinguishable, but a prestratification is
preferred in order to separate younger and fully grown forests. Planted Melaleuca
forests are inland and appear as homogeneous, dark and compact. Mangrove forests
appear along the coastline and their natural or planted forest patterns (rows with
channels) are recognizable. Except for some planted melaleucas in gardens, these two
species have distinct habitats as melaleuca can not survive in saltwater and mangrove
needs salt or brackish water.
Water score was sliced into two classes for separation between open water/sea and
shallow water/shrimp/fish farms. The accuracy of adding water score was significantly
better than adding vegetation score, which hardly gave any useful information. 200
randomly generated points were used for assessment.
Table 5. Mangrove classification accuracy. Vegetation and water score added
Producer's
Accuracy
User's
Accuracy
Water (sea, channels) 83.3 % 88.9 %
Shrimppond, shallow 81.8 % 58.1 %
Soil, infrastructure 57.6 % 48.7 %
Mangrove open 7.1 % 25.0 %
Mangrove dense 92.0 % 71.9 %
Mangrove young 60.3 % 71.4 %
Overall Accuracy 68.0 %
8. Classification applied for Ca Mau Province
Dataset A and B where each mosaicked and classified using band 1-4. A sea and
cloud mask was made for Ca Mau and neighboring area using band 1, 3, 4, and 12. For
statistics, the classified image was masked with administrative borders.
Unclassified
fishfarm
open w ater
fallow
rice, grass
bush
young forest
forest
Figure 5. Land cover distribution Ca Mau Province
Evaluation of ASTER data use in land use study in the Mekong Delta
VNU. Journal of Science, Earth Sciences, T.XXIII, N
0
1, 2007
35
The whole province covers 5,213km
2
, according to the dataset that was used.
4,977km
2
was classified as open water (channels, lakes), fish and shrimp farms, fallow
soil and infrastructure, rice and grassland, bush, young forest and forest. Fish and
shrimp farms were by far the biggest class covering about 40% or 2,092km
2
. According to
the confusion matrix, fishfarms are mainly confused spectrally with fallow soil.
Unclassified area is sea and clouds.
9. Multitemporal analysis
The forest fire occurred in April 2002 was covered by dataset A before fire and C
after fire. We wanted to find the change in the forest cover in the two datasets. The fire
field had been regrown since the fire, mostly by reeds. Two approaches were chosen, a
temperature change analysis and a post-classification analysis. Thermal bands might be
used directly for change analysis and threshold since solar illumination is approximately
constant in the flat landscape. However, images should be free of haze, as this absorbs
thermal radiance. Spectral change analysis was not chosen due to the variety of spectral
signatures.
A subset of 530km
2
was chosen for the study. Sea and clouds were masked out
and 390km
2
were left. Forests (mainly melaleuca) were classified in each dataset using
supervised maximum likelihood classification. 2002 forest cover was 118 km
2
and there
was a decrease of 30km
2
or 25% in the next year. Lost forest cover is described as a
change from forest or bush to non-forest (water-fallow-grass), the accuracy of this
classification should be 70% (calculated from confusion matrix, Table 4).
Table 6. Forest cover change and temperature difference
Description Area (ha) %
Forest gained, >1
o
C temperature decrease 1104 2.8
No forest lost, >1
o
C temperature decrease 9032 23.2
No forest lost, +/-1
o
C temperature change 21354 54.7
No forest lost, 1-2
o
C temperature increase 3964 10.2
No forest lost, >2
o
C temperature increase 329 0.8
Forest lost, no temperature increase 1286 3.3
Forest lost, 1-2
o
C temperature increase 891 2.3
Forest lost, >2
o
C temperature increase 810 2.1
Total 39007 100
Table 6 describes the correlation between temperature change and forest cover
change. A large fire field or clear-cut area creates a drastic increase in temperature,
Pham Van Cu, Einar Lieng, Le Thanh Hoa, Hiroshi Watanabe, Hoang Kim Huong
VNU. Journal of Science, Earth Sciences, T.XXIII, N
0
1, 2007
36
from 3-8 degrees Celsius in the ASTER thermal bands. But surrounding areas tend to
be heated up and borders are not very accurate. This explains the 0.8 percent of land
where there is no forest lost but an increase of more than 2
o
C.
10. Conclusions
Band combination 1-4 gave the best result for supervised classification. Vegetation
and water score made additional classes possible to refine, but only water score proved
to be of accepted accuracy.
In the Ca Mau region, fish and shrimp farming have changed the landuse
drastically over the last ten years. 40% of Ca Mau is now used as such farms.
The thermal bands can be used to make a quick change detection in forest cover.
Change detection by classification is more accurate but labor intensive. Forest lost to
clear cutting or forest fire had a temperature increase of more than 1
o
C in 57% of the
cases. 71% of areas with a temperature increase more than 2
o
C had lost its forest cover.
With ASTER data, landuse changes like agriculture to shrimp farming and
coastline movement are easily monitored. Planted forests are recognized and stand can
be evaluated. Mixed forests and agriculture and grassland are difficult to interpret.
Such areas might be delineated and studied further by multitemporal analysis.
Acknowledgements: This study is funded by ERSDAC and FPD Vietnam. Mr. Lieng's
work was performed under Norwegian Fredskorps professional exchange program in the
field of Geomatics. Mr. Wantanabe from ERSDAC in Japan has provided us with ASTER
images and advice on how to optimize the data use regarding the research topics. FPD in Ca
Mau has assisted with ground truth information.
References
[1] Abrams, M., Hook, S., Ramachandran, B. (2002), ASTER user handbook, version 2. Jet
Propulsion Laboratory / California Institute of Technology, USA.
[2] Congalton, R. G., Green, K. (1999). Assessing the accuracy of remotely sensed data:
Principles and practices. Lewis Publishers, USA.
[3] Crepani, E., Duarte, V., Shimabukuro, Y.O. (2002), Digital processing of Landsat-5 TM
data for land use land cover regional mapping. São José dos Campos, SP, Brasil
[4] Hazarika, M.K. et al. (2000), Monitoring and impact of shrimp farming in the East coast
of Thailand using Remote Sensing and GIS, IAPRS, Vol. XXXIII, Amsterdam.
[5] Phinn, S. R. et al. (2000), Optimizing remotely sensed solutions for monitoring, modeling,
and managing coastal environments. Remote Sens. Environ., No 73, pp. 117–132.
Evaluation of ASTER data use in land use study in the Mekong Delta
VNU. Journal of Science, Earth Sciences, T.XXIII, N
0
1, 2007
37
[6] Smith, M.O. et al. (1994), Imaging spectrometry - A tool for environmental observations.
In: J. Hill and Mégier (eds.) Spectral mixture analysis - new strategies for the analysis of
multispectral data. ECSC, EEC, EAEC, Bruxels and Luxembourg, printed in the
Netherlands, pp. 125-143.
[7] Sonobe, T. et al. (2002), Utilization of ASTER data for wetland mapping of Kushiro Mire
and Iriomote Island, Japan. In: Raghavan and Hoang (eds.) International Symposium
on GeoInformatics for Spatial-Infrastructure Development in Earth and Allied Sciences.
Hanoi, Vietnam, 25-28 September 2002, pp. 39-44.
[8] Wahyunto, Widagdo and Abidin (2002), Rice yield estimation model in irrigated wetland
rice areas of Java, Indonesia using Landsat TM data. Asian Journal of Remote Sensing,
Vol. 3, No 2.
[9] Wantanabe, H. (2003), ASTER GDS Current Status. ERSDAC, Japan.
[10] Yamagata, Y., Sugita, S., and Yasuoka, Y. (1997), Development of Vegetation-Soil-
Water Index algorithms and applications. Japan Remote Sensing Journal, 17(1), pp. 54-
64 (in Japanese).
[11] Yang, L. et al. (2001), A Landsat 7 scene selection strategy for a National land cover
database. Raytheon ITSS, EROS Data Center, Sioux Falls, SD 57198 USA
VNU JOURNAL OF SCIENCE, Earth sciences, T.xxIII, N
0
1, 2007
28