Tài liệu GLOBAL PHYLOGEOGRAPHY OF A CRYPTIC COPEPOD SPECIES COMPLEX AND REPRODUCTIVE ISOLATION BETWEEN GENETICALLY PROXIMATE ‘‘POPULATIONS’’ ppt
Bạn đang xem bản rút gọn của tài liệu. Xem và tải ngay bản đầy đủ của tài liệu tại đây (213.26 KB, 14 trang )
2014
᭧
2000 The Society for the Study of Evolution. All rights reserved.
Evolution, 54(6), 2000, pp. 2014–2027
GLOBAL PHYLOGEOGRAPHY OF A CRYPTIC COPEPOD SPECIES COMPLEX AND
REPRODUCTIVE ISOLATION BETWEEN GENETICALLY
PROXIMATE ‘‘POPULATIONS’’
C
AROL
E
UNMI
L
EE
1
Marine Molecular Biotechnology Laboratory, School of Oceanography, University of Washington,
Seattle, Washington 98195-7940
Abstract. The copepod Eurytemora affinis has a broad geographic range within the Northern Hemisphere, inhabiting
coastal regions of North America, Asia, and Europe. A phylogenetic approach was used to determine levels of genetic
differentiation among populations of this species, and interpopulation crosses were performedto determine reproductive
compatibility. DNA sequences from two mitochondrial genes, large subunit (16S) rRNA (450 bp) and cytochrome
oxidase I (COI, 652 bp), were obtained from 38 populations spanning most of the species range and from two congeneric
species, E. americana and E. herdmani. Phylogenetic analysis revealed a polytomy of highly divergent clades with
maximum sequence divergences of 10% in 16S rRNA and 19% in COI. A power test (difference of a proportion)
revealed that amount of sequence data collected was sufficient for resolving speciation events occurring at intervals
greater than 300,000 years, but insufficient for determining whetherspeciation events wereapproximatelysimultaneous.
Geographic and genetic distances were not correlated (Mantel’s test; r
ϭ
0.023, P
ϭ
0.25), suggesting that populations
had not differentiated through gradual isolation by distance. At finer spatial scales, there was almost no sharing of
mtDNA haplotypes among proximate populations, indicating little genetic exchange even between nearby sites. In-
terpopulation crosses demonstrated reproductive incompatibility among genetically distinct populations, including
those that were sympatric. Most notably, two geographically distant (4000 km) but genetically proximate (0.96% 16S,
0.15% COI) populations exhibited asymmetric reproductive isolation at the F
2
generation. Large genetic divergences
and reproductive isolation indicate that the morphologically conservativeE. affinis constitutes asibling species complex.
Reproductive isolation between genetically proximate populations underscores the importance of using multiple mea-
sures to examine patterns of speciation.
Key words.
Biogeography, cryptic speciation, dispersal, Eurytemora affinis, hybrid breakdown, phylogeography.
Received October 15, 1999. Accepted March 14, 2000.
Sibling species are common in marine habitats, reflecting
both inadequate study of morphological features and lack of
divergence in morphology accompanying speciation events
(Knowlton 1993). In addition, species boundaries are often
difficult to define because of lack of data that link genetic
and morphological diversity with patterns of reproductive
compatibility. This study illustrates a case in which specia-
tion was accompanied by neither detectable genetic nor mor-
phological differentiation. Furthermore, this provides a rare
case study on the intercontinental phylogeography and spe-
ciation of a widespread and passively dispersed estuarine
species.
The crustacean order Copepoda, which represents the most
abundant group of metazoans in the sea, is understudied with
respect to its evolutionary history and genetic diversity. The
relatively few studies on copepod biodiversity suggest nu-
merous examples of cryptic species, as revealed by molecular
markers, interbreeding, or detailed morphometrics (Carillo et
al. 1974; Frost 1974, 1989; Fleminger and Hulsemann 1987;
Boileau 1991; McKinnon et al. 1992; Cervelli et al. 1995;
Ganz and Burton 1995; Einsle 1996; Reid 1998). These cryp-
tic species appear to result from the prevailing pattern of
morphological conservatism coupled with large genetic di-
vergences (Frost 1974, 1989; Sevigny et al. 1989; McKinnon
et al. 1992; Bucklin et al. 1995; Burton 1998). However, with
few exceptions (Burton 1990; Ganz and Burton 1995; Ed-
mands 1999), it is unknown whether the large interpopulation
1
Present address: 430 Lincoln Drive, Birge Hall 426, Department
of Zoology, University of Wisconsin, Madison,Madison,Wisconsin
53706; E-mail:
genetic distances correspond to reproductively compatible
entities.
The copepod Eurytemora affinis is regarded as cosmopol-
itan, spanning a broad geographic range in the Northern
Hemisphere from subtropical to subarctic regions of North
America and temperate regions of Asia and Europe (gray
shading in Fig. 1). This crustacean has been a focus of many
ecological studies because of its dominance as a primary
grazer in estuaries throughout the world (Fig. 1; Mauchline
1998). Eurytemora affinis is planktonic (or epibenthic)
throughout its life and is considered a passive disperser be-
cause of its small size (1–2 mm) and inability to swim against
ambient fluid flow. Because this species inhabits coastal wa-
ters, such as estuaries, salt marshes, and brackish lakes (and
freshwater reservoirs in recent years), both open oceans and
land might pose geographic barriers to dispersal. However,
long-range dispersal has been hypothesized for E. affinis,
through transport by birds and fish of adults and digestion-
resistant eggs (Saunders 1993; Conway et al. 1994).
A previous study on freshwater invasions by E. affinis (Lee
1999) revealed unexpectedly high levels of intraspecific ge-
netic divergence, thus casting doubts on its integrity as a
single species. Interpopulation genetic divergences, estimat-
ed from DNA sequences of the mitochondrial cytochrome
oxidase I (COI) gene (652 bp), were as a high as 17% with
no evidence of genetic exchange among continents (Lee
1999) and little among drainage basins. However, morpho-
logical traits that can distinguish among lineages are not ob-
vious, consisting of variation in body proportions between
Europe and other clades and slight or no discernible differ-
2015
PHYLOGEOGRAPHY OF CRYPTIC COPEPOD SPECIES
F
IG
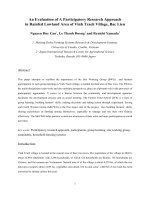
. 1. Populations of Eurytemora affinis sampled for this study (represented by black dots on map with place names listed below).
Gray shading shows the known distribution of E. affinis. Populations of E. affinis in northern Russia may be more widespread. (1) St.
Lawrence estuary, Canada; (2) St. Lawrence marsh, Canada; (3) Saguenay River, PQ, Canada; (4) Lac St. Jean, PQ, Canada; (5) Waquoit
Bay, MA; (6) Parker River pool, MA; (7) Neponset River pool, MA; (8) Oyster Pond, MA; (9) Edgartown Great Pond, MA; (10) Tisbury
Great Pond, MA; (11) Chesapeake Bay, MD; (12) Cape Fear, NC; (13) Cooper River, SC; (14) St. John River, FL; (15) Fourleague Bay,
LA; (16) Lake Pontchartrain, LA; (17) Black Bayou, MI; (18) Lake Beulah, MI; (19) Colorado Estuary, TX; (20) San Francisco Bay,
CA; (21) Columbia River estuary, OR; (22) Chehalis River estuary, WA; (23) Grays Harbor Marsh, WA; (24) Nitinat Lake, BC, Canada;
(25) Nanaimo River, BC, Canada; (26) Campbell River, BC, Canada; (27) Ishikari River, Japan; (28) Lake Baratoka, Japan; (29) Lake
Ohnuma, Japan; (30) Lake Akanko, Japan; (31) Caspian Sea; (32) Gulf of Bothnia; (33) Gulf of Finland; (34) Sa¨llvik Fjord, Finland;
(35) Baltic Sea Proper; (36) IJsselmeer, Netherlands; (37) Gironde estuary, France; (38) Tamar estuary, England.
ence among the non-European clades (B. W. Frost, pers.
comm.). In contrast to the morphological stasis evident
among lineages, considerable plasticity exists within line-
ages, including variation in surface area, body size, and
length/width ratio of the furca (tail) according to season or
habitat type (Busch and Brenning 1992; Castel and Feurtet
1993).
While the previous study focused on reconstructing path-
ways of freshwater invasion from saltwater habitats (Lee
1999), the goals of the present study were to broaden both
the geographic and genetic scopes of the initial survey to (1)
more thoroughly examine geographic patterns of genetic var-
iation; (2) gain rough estimates of timing of divergence
among clades; and (3) determine reproductive compatibility
among genetically distinct but sympatric and genetically sim-
ilar but geographically distant populations. The first goal was
accomplished by adding nine populations from previously
unsampled geographic regions; by including 29 of 39 pop-
2016
CAROL EUNMI LEE
ulations from the previous study using COI (Lee 1999); and
by sequencing an additional locus, the mitochondrial large
subunit (16S) rRNA (450 bp) gene, for 30 populations. The
second goal was accomplished by using 16S rRNA to obtain
a rooted tree for dating speciation events and by comparing
levels of divergence with those of other crustacean taxa (Cun-
ningham et al. 1992; Avise et al. 1994; Bucklin et al. 1995).
To achieve the third goal, four populations of varying degrees
of genetic divergence were intermated to test whether the
populations constitute a single biological species.
M
ATERIALS AND
M
ETHODS
Population Sampling
Eurytemora affinis (Poppe 1880) was collected between
1994 and 1999 from 38 sites spanning much of the global
range of the species (Fig. 1), including diverse habitats such
as hypersaline marshes, brackish estuaries, and freshwater
lakes. Populations from very recently invaded freshwater
sites (mostly reservoirs within the past 60 years) were not
included in this study, but were discussed in a previous paper
(Lee 1999), except for populations from Lakes Ohnuma and
Akanko from Hokkaido, Japan. These two recent populations
were included because they contained unique haplotypes that
were highly divergent. These populations are thought to have
originated from a brackish lake on Honshu Island in Japan
(Ban and Minoda 1989). Congeners, Eurytemora americana
from the Duwamish River, Washington, and E. herdmani
from Halifax, Nova Scotia, Canada, were collected for use
as outgroup species in the phylogenetic analysis. The iden-
tities of E. affinis, E. americana, and E. herdmani were con-
firmed morphologically by G. A. Heron and B. W. Frost.
Detailed morphometric studies have indicated that E. affinis,
E. hirundo (Giesbrecht 1881), and the more slender E. hi-
rundoides (Nordquist 1888) are morphological variants of the
same species (Wilson 1959; Busch and Brenning 1992; Castel
and Feurtet 1993). The varieties E. affinis and E. hirundoides
were collected from the Gironde River, France (by the late
J. Castel) for genetic confirmation that they belong to the
same species.
Phylogenetic Reconstruction
Intraspecific phylogenies of E. affinis were constructed us-
ing the mitochondrial 16S rRNA (450 bp) and the more rap-
idly evolving COI (652 bp) genes. Genomic DNA from eth-
anol-preserved individual copepods was extracted using a
cell-lysis buffer with proteinase K (Hoelzel and Green 1992).
Polymerase chain reaction (PCR) primers 16Sar 2510 and
16Sbr 3080 were used to amplify sequences from 16S rRNA,
and primers COIH 2198 (5
Ј
TAAACTTCAGGGTGAC-
CAAAAAATCA 3
Ј
) and COIL 1490 (5
Ј
GGTCAACAAAT-
CATAAAGATATTGG 3
Ј
; Folmer et al. 1994) were used to
obtain sequences from COI. Primer pairs 16SA2 (5
Ј
CCGGGT C/T TCGCTAAGGTAG) and 16SB2 (5
Ј
CAA-
CATCGAGGTCGCAGTAA) were designed specifically to
amplify 340 bp of 16S rRNA from the Columbia River es-
tuary population and from E. americana.Temperatureprofiles
of five cycles of 90
Њ
C (30 sec), 45
Њ
C (60 sec), 72
Њ
C (90 sec)
followed by 27 cycles of 90
Њ
C (30 sec), 55
Њ
C (45 sec), 72
Њ
C
(60 sec) were used for PCR amplification. PCR product was
run out on agarose gels, excised, and then purified using a
Qiagen (Qiagen, Inc., Valencia, CA) gel extraction kit. Pu-
rified PCR product was sequenced using an Applied Bios-
ystems Inc. 373 automated sequencer (Applied Biosystems,
Foster City, CA). Both strands were sequenced to confirm
accuracy of each haplotype sequence.
Phylogenies were constructed using distance matrix and
parsimony approaches with the software package PAUP* 4.0
(Swofford 1998). For distance matrix reconstructions, the
neighbor-joining algorithm (Saitou and Nei 1987) was used
to construct the starting tree, followed by heuristic searches
with the tree-bisection-reconnection (TBR) branch-swapping
algorithm to optimize the tree. Parsimony reconstructions
were based on heuristic searches with unweighted characters.
For COI, parsimony reconstructions were performed using
all codon positions, with the third codons removed. Sequenc-
es were aligned according to secondary structure for 16S
rRNA and unambiguously by eye for COI. A consensus se-
quence for each population was used based on three to five
individual sequences per population. Polymorphism within
populations was either absent or very low (
Ͻ
1%). Congeners
E. americana and E. herdmani were used as outgroups for
16S rRNA, but not for COI because substitutions were sat-
urated among Eurytemora species (see Results on mutational
saturation). Bootstrapping with 100 replicates (Felsenstein
1985) was performed to obtain a measure of robustness of
tree topology. Maximum-likelihood distances were computed
to account for saturation of substitutions. When obtaining
distances, a maximum-likelihood approach was used to es-
timate transition:transversion ratio (ts:tv ratio; 1.45 for 16S
rRNA and 4.7 for COI, taking into account saturation) and
variation of evolutionary rates among sites (using shape pa-
rameter (
␣
) of a gamma distribution of 0.181 for 16S and
0.184 for COI; Yang 1996).
Partition-homogeneity tests (Farris et al. 1995; Messenger
and McGuire 1998) were performed using PAUP* 4.0 (Swof-
ford 1998) to determine whether datasets were significantly
incongruent and should not be combined for phylogenetic
analyses and for the power test (described in next section on
Hypothesis Testing). Partition-homogeneity tests were per-
formed on (1) stem (paired) versus loop (unpaired) regions
of 16S rRNA; (2) a combined dataset of 16S rRNA and COI;
and (3) first, second, and third codon positions of COI. For
16S rRNA, tests on stem and loop regions were performed
on 15 E. affinis populations (Fig. 1: sites 1, 2, 5, 7, 11, 12,15,
21, 24, 27, 29, 31, 32, 37, 38) and two outgroup species (E.
americana, E. herdmani).
Degree of mutational saturation was estimated to determine
whether particular sequences were appropriate for use in phy-
logenetic analyses and the power test (described below). De-
gree of mutational saturation was assessed by examining the
correlation between ts:tv ratio and pairwise sequence diver-
gence. A decrease in ts:tv ratio with increasing genetic di-
vergence is an indication of mutational saturation (Kocher et
al. 1995). Mutational saturation was determined for stem and
loop regions of 16S rRNA and for codon positions of COI.
Hypothesis Testing
Mantel’s test (Mantel 1967) was performed to test the cor-
relation between genetic and geographic distance using The
2017
PHYLOGEOGRAPHY OF CRYPTIC COPEPOD SPECIES
T
ABLE
1. Geographic and genetic distances between crossed populations of Eurytemora affinis. See Figure 2 for key to clade assignments (in
circles).
Population crosses (site) Clade
Geographic
distance
(km)
% sequence
divergence
16S COI
Waquoit Bay, MA (5)
Edgartown Great Pond, MA (9)
Grays Harbor salt marsh, WA (23)
ⅷ
ⅷ
ϫ Edgartown Great Pond, MA (9)
ϫ Grays Harbor salt marsh, WA (23)
ϫ Columbia River estuary, OR (21)
ⅷ
ⅷ
⅜
20
4000
55
5.16
0.96
7.66
10.6
0.15
17.1
R Package 3.0 (Legendre and Vaudor 1991). This test in-
dicates whether differentiation among the major clades oc-
curred through gradual isolation by distance. Pairwise geo-
graphic distances between populations were determined
while accounting for the curvature of the earth (Geographic
Distances in The R Package 3.0). Pairwise maximum-like-
lihood genetic distances between populations were computed
using PAUP* 4.0 (Swofford 1998).
A power (1
Ϫ
) test (Walsh et al. 1999) was used to
determine whether polytomies among clades resulted from
actual simultaneous speciation events (hard polytomies) or
from rapid cladogenesis (soft polytomies), along with lack
of resolution in the data. The test was applied to sequences
from 16S rRNA (450 bp), sequences from first and second
codon positions of COI (435 bp) and then to a combined
dataset of 16S rRNA and 1,2 codons of COI (885 bp). The
third positions of COI were omitted for this analysis because
substitutions were saturated (see Results). This method tests
whether the amount of sequence data and the pairwise se-
quence divergence rate are sufficient to expect substitutions
within a desired time interval. For instance, if there were
only 500 bp with a substitution rate of 2.2%/million years,
the probability of substitutions occurring within 100,000
years would be low. Thus, the data would be insufficient for
resolving a polytomy where speciation events occurred with-
in such a short time interval. The more conservative ‘‘dif-
ference of a proportion test’’ was applied rather than the
‘‘difference of a mean test’’ (Walsh et al. 1999).
The null hypothesis was that the major clades diverged
roughly simultaneously, and the alternative hypothesis was
that the major clades diverged over successive geological
events. Resolution of less than 1 million years was desired,
because level of genetic divergence suggested that the mul-
tifurcation had occurred around the Miocene/Pliocenebound-
ary (see Results), when climatic fluctuations were probably
occurring on a 1 million-year time scale (Crowley and North
1991). The test statistic, h
ϭ
2
1/2
(
⌽
1
Ϫ⌽
c
), represents the
difference in proportion of substitutions between internodes
of 1 million years (soft polytomy) and an internode of zero
length (hard polytomy). Proportion (P) of bases expected to
undergo substitution during an internode period (the ‘‘effect
size’’) was arcsine transformed (
⌽ϭ
2arcsine[P]
1/2
). Sig-
nificance level was set at 0.05 and power at 0.80 (
ϭ
0.20).
To compute the proportion (P), a substitution rate of ap-
proximately 0.9%/million years was used for 16S rRNA
(Sturmbauer et al. 1996; Schubart et al. 1998). A rate of 0.4%/
million years was assumed for the first two codons of COI,
based on rates from another region of COI for Sesarma crab
sequences taken from Genbank (Schubart et al. 1998). An
average rate of 0.65%/million years was used for the com-
bined dataset, weighted for the number of bases per locus.
The number of bases required to resolve a given internode
length (for a given value of h) was taken from table 1 in
Walsh et al. (1999).
To compare levels and timing of divergence with those of
other crustacean taxa using the same distance scale, an un-
weighted pair group method using arithmetic averages
(UPGMA) was used to cluster distances based on a Kimura
two-parameter model of evolution (Cunningham et al. 1992;
Avise et al. 1994). The dendrogram based on 16S rRNA was
used to estimate timing of events, because rates of evolution
have been calibrated for 16S rRNA in other crustaceans
(Bucklin et al. 1995; Sturmbauer et al. 1996; Schubart et al.
1998), whereas comparable molecular clock calibrationshave
not been made for the region of COI used in this study. A
likelihood-ratio test (Felsenstein 1981; Huelsenbeck and
Rannala 1997) was performed on the 16S rRNA data to de-
termine whether the assumption that substitutions in the data
evolved in a clocklike manner was violated and whether con-
structing a UPGMA tree (which assumes a clocklike substi-
tution rate) was acceptable.
Interpopulation Mating
Interpopulation matings were performed between two ge-
netically divergent clades (North Pacific vs. North America),
between two genetically divergent North American subclades
(Atlantic vs. North Atlantic), and within one subclade (At-
lantic; Table 1). The populations from divergent clades and
subclades were chosen from regions where they come into
contact (Table 1, Fig. 1) to determine whether genetically
divergent but geographically proximate populations are re-
productively isolated. Additionally, two populations from a
single subclade from opposite coasts of the North American
continent (sites 9 and 23) were crossed (Fig. 1) to determine
whether speciation has occurred between genetically proxi-
mate but geographically distant populations.
Populations were reared in the laboratory for at least two
generations to standardize for environmental effects. Ten to
58 replicates were assembled in both reciprocal directions
for each population cross (Table 2). For each replicate, in-
dividual male and juvenile female mating pairs were placed
in 20-ml vials, in a 12
Њ
C environmental chamber on a 15:9
L:D cycle. These vials contained 15 parts per thousand of
salt (PSU) water made from a mixture of water from Puget
Sound, Washington (27 PSU), and Lake Washington(0 PSU).
Populations originated from habitats with overlapping salin-
ity ranges (Columbia River: 3–15 PSU; Grays Harbor marsh:
5–30 PSU; Edgartown Great Pond: found at 11 PSU; Waquoit
Bay: found at 23 PSU). A mixture of three algal species,
2018
CAROL EUNMI LEE
T
ABLE
2. Results from interpopulation crosses among four populations of Eurytemora affinis, showing number of eggs produced per clutch, survivorship per clutch, percent clutches
that produced adults out of all crosses, and development time to adulthood. P, parent; F
1
, first generation; F
2
, second generation; n/a, not applicable; and ?, no data.
Population cross
(Female ϫ Male)
No. replicate
crosses
PF
1
No. eggs/clutch Ϯ SE
(no. clutches)
F
1
F
2
Survival of adults/clutch
(% Ϯ SE) (no. clutches)
F
1
F
2
% clutches
yielding
adults
F
1
F
2
Development time
(day Ϯ SE) (no. clutches)
F
1
F
2
Type of
isolation
(Sites 21 ϫ 23)
Columbia ϫ Grays
Grays ϫ Columbia
Control: Columbia
Control: Grays
58
57
20
17
14
8
n/a
1
n/a
15.6 Ϯ 1.6 (25)
13.4 Ϯ 2.0 (27)
16.4 Ϯ 2.5 (12)
19.3 Ϯ 2.6 (10)
7.8 Ϯ 0.9 (6)
13.6 Ϯ 3.3 (5)
n/a
n/a
13 Ϯ 5 (27)
7 Ϯ 3 (27)
38 Ϯ 9 (12)
28 Ϯ 8 (10)
11 Ϯ 12 (6)
0 (5)
n/a
n/a
17
9
40
41
7
0
n/a
n/a
31.4 Ϯ 3.8 (10)
25.7 Ϯ 2.9 (7)
21.0 Ϯ 0.8 (8)
20.2 Ϯ 1.2 (7)
38.25 (1)
n/a
n/a
inviable F
2
(Sites 23 ϫ 9)
Grays ϫ Edgartown
Edgartown ϫ Grays
Control: Grays
Control: Edgartown
20
20
10
10
10
10
n/a
n/a
10.7 Ϯ 3.3 (9)
13.9 Ϯ 4.4 (15)
44.9 Ϯ 3.4 (8)
11.6 Ϯ 1.9 (9)
n/a
n/a
27 Ϯ 12 (11)
27 Ϯ 9 (18)
45 Ϯ 12 (9)
40 Ϯ 13 (9)
? (5)
0 (5)
n/a
n/a
20
30
70
60
30
0
n/a
n/a
20.1 Ϯ 2.5 (4)
16.7 Ϯ 1.5 (6)
18.7 Ϯ 2.2 (7)
17.8 Ϯ 1.7 (6)
21.2 Ϯ 1.9 (3)
n/a
n/a
inviable F
2
(Sites 9 ϫ 5)
Edgartown ϫ Waquoit
Waquoit ϫ Edgartown
Control: Edgartown
Control: Waquoit
30
29
32
29
1
1
n/a
n/a
13.9 Ϯ 2.0 (17)
9.1 Ϯ 1.9 (8)
12.6 Ϯ 1.5 (24)
16.4 Ϯ 1.3 (21)
n/a
n/a
1.0 Ϯ 0.8 (17)
0 (8)
10 Ϯ 4 (24)
24 Ϯ 7 (21)
no clutches
n/a
n/a
7
0
31
48
0
n/a
n/a
37.5 Ϯ 10.5 (2)
39.2 Ϯ 1.9 (10)
37.2 Ϯ 2.9 (14)
n/a
n/a
sterile F
1
inviable F
1
1
Measurements were not made for controls beyond the parent generation because genetic composition does not vary among generations and controls can reproduce indefinitely in the experimental vials
with no decline in survivorship.
Isochrysis galbana, Thalassiosira pseudonana, and Rhodo-
monas sp., was used as a food source. Number of eggs per
clutch, percentage of survival to adult within a clutch, per-
centage of clutches that produced adults out of all replicate
crosses, and development time to adulthood were recorded
for F
1
and F
2
offspring.
Individuals were classified as adults when malesdeveloped
geniculate right antennules, and females developed large
wing-like processes on the posterior end of their prosome
(body). Each mating experiment lasted for approximately 3
months and experiments were performed in sequence (Grays
ϫ
Edgartown: summer/fall 1996, Columbia
ϫ
Grays: winter/
spring 1997, Edgartown
ϫ
Waquoit: summer/fall 1997). Be-
cause the three mating experiments were performed sequen-
tially at different times of the year, results from different
crosses were not compared directly to one another, but to
intrapopulation crosses (controls). Controlled intrapopulation
matings were performed concurrently with each experiment.
Allozyme data were collected to confirm the production of
hybrids from the crosses using five loci (Amy, Mpi, Pep, Pgi,
and Pgm).
R
ESULTS
Sequence Diversity
Phylogenetic analysis revealed deep splits among clades
(Figs. 2, 3), with maximum pairwise divergences of 10% in
16S rRNA and 19% in COI. Topologies of the phylogenies
based on 16S rRNA and COI were mostly concordant (Fig.
2), with COI providing greater resolution among closely re-
lated populations. Because a partition-homogeneity test (Far-
ris et al. 1995) showed that sequences from 16S rRNA and
COI were not significantly congruent (P
ϭ
0.86), the datasets
were kept separate for phylogenetic reconstructions.
Sequences from stem and loop regions of 16S rRNA were
significantly congruent (P
ϭ
0.16) and thus were combined.
A separate phylogenetic analysis of stem (277 bp) and loop
(173 bp) regions yielded similar tree topologies and propor-
tion of polymorphic sites (loops: 50 bp, 29%; stems: 67 bp,
24%). Degree of mutational saturation, as revealed by de-
clining ts:tv ratios with increasing sequence divergence, was
similar for both stem and loop regions in 16S rRNA (Fig.
4). Mutational saturation was evident among congeneric spe-
cies of Eurytemora (Fig. 4). There were 68 parsimony-in-
formative sites for 16S rRNA, and consistency and retention
indices were 0.67 and 0.74, respectively.
In contrast to the congruence between stem and loop regions
of 16S rRNA, codon positions of COI were not significantly
congruent (P
ϭ
0.99). Mutational saturation at the third codon
position occurred with pairwise sequence divergences above
5%, whereas first and second codon positions of COI did not
become saturated among populations (Fig. 5). A graph for the
second codon position was not presented in Figure 5 because
transversions were rare. Despite the fact that third codon po-
sitions of COI were saturated,they provideduseful information
for phylogenetic analysis. For instance, phylogenetic analyses
using only the first two codons resulted in reconstructions with
much lower bootstrap values, due to insufficient data. Satu-
ration at the third position was accounted for by computing
maximum-likelihood distances (see Methods, Fig. 2b). There
2019
PHYLOGEOGRAPHY OF CRYPTIC COPEPOD SPECIES
were 197 parsimony-informative sites for COI, and consisten-
cy and retention indices were 0.64 and 0.84, respectively. All
substitutions in COI were synonymous, resulting in no amino
acid substitutions. Third codon positions were omitted for the
power test because mutational saturation would violate the
assumption that sequence divergences reflect an even occur-
rence of substitutions over time.
Geographic Structure and Timing of Divergence
The four major clades of E. affinis, corresponding to Europe,
Asia, North America, and North Pacific, formed a polytomy
(multifurcation; Fig. 2a). A phylogenetic reconstruction based
on the combined dataset of 16S rRNA and COI also yielded
a polytomy among the major clades. A power test (Walsh et
al. 1999) indicated that the 16S rRNA data were sufficient to
resolve internodes of 500,000 years (h
ϭ
0.190,
⌽
1
ϭ
0.134,
⌽
c
ϭ
0.000, P
ϭ
0.0045, 2.0 bases), whereas the combined
dataset of 16S and COI (885 bp, third codon positions re-
moved) was sufficient to resolve internodes of 300,000 years
(h
ϭ
0.125,
⌽
1
ϭ
0.088,
⌽
c
ϭ
0.000, P
ϭ
0.00195, 1.72
bases). Results from the test suggest that the polytomy rep-
resented speciation events occurring within 300,000 years, but
the data were insufficient to determine whether the events were
approximately simultaneous. Given rates of evolution of the
loci examined, more than 1000 bp would be required to resolve
internodes of 200,000 years or less.
The major clades, except for the European clade, contained
highly divergent subclades. The North American clade con-
sisted of three subclades, North Atlantic, Atlantic, and Gulf
(Figs. 2, 3), having maximum divergences of 6% in 16S
rRNA and 15% in COI. Even though only a few populations
were sampled, nearly as much genetic divergence was present
in the Asian clade (4% 16S, 13% COI), suggesting the po-
tential for more genetic diversity with additional sampling.
Similarly, genetic diversity within the North Pacific clade
may not have been fully explored because population sam-
pling was confined to a small area in this region (Fig. 3). In
contrast, interpopulation genetic divergences were low in Eu-
rope, with maximum divergences of only 1% in 16S rRNA
and 3% in COI. Morphological variants within Europe, des-
ignated as ‘‘E. affinis’’ and the more slender ‘‘E. hirundoi-
des,’’ were genetically identical at both 16S rRNA and COI,
in concordance with morphological studies that found E. hi-
rundoides to be an invalid species (Wilson 1959; Busch and
Brenning 1992; Castel and Feurtet 1993).
At finer spatial scales, there was almost no sharing of mtDNA
haplotypes among geographically proximate (but nonidentical)
populations, indicating a lack of genetic exchange amongnearby
sites (see Atlantic clade, Fig. 2b) and a completion of lineage
sorting. Populations with identical haplotypes, such as those
from Massachusetts, might reflect a recent common history rath-
er than ongoing dispersal. Variation in sequence within popu-
lations was either absent or very low (
Ͻ
1% divergence).
There was a lack of correlation between genetic and geo-
graphic distances among populations (Mantel’s test; r
ϭ
0.023,
P
ϭ
0.25). This pattern was not surprising, given that highly
divergent clades were distributed in close geographic prox-
imity. A correlation was not present even when the clades
most likely contributing to lack of correlation were removed
from the analysis, such as the most divergent North Pacific
clade and West Coast populations (sites 20, 23) belonging to
the North American clade (Atlantic subclade; Figs. 2, 3).
Zones of contact between highly divergent clades were
present on both coasts of the North American continent (Fig.
3). The highly divergent North American and North Pacific
clades (17–19% COI divergence) both occurred on the West
Coast of North America (sites 20 to 26). The two clades
overlapped in range in Grays Harbor, Washington (Fig. 3),
with one clade present in a salt marsh (Atlantic subclade; site
23) and the other in the Chehalis River estuary (North Pacific
clade, site 22). On the East Coast of North America, popu-
lations from two subclades within the North American clade
(Atlantic and North Atlantic) overlapped in range in the St.
Lawrence River drainage and in Massachusetts (sites 1–10).
An estuarine population from each subclade (
ϳ
11% COI di-
vergence; sites 1 and 3) coexisted within the St. Lawrence
River drainage. Within this drainage, populations from the
Atlantic clade were found in estuarine, salt marsh, and fresh-
water habitats (sites 2, 3, and 4). In contrast to the above
scenarios, genetically proximate populations belonging to the
same subclade (Atlantic) occurred on opposite coasts of the
North American continent. West Coast populations in San
Francisco Bay, California (site 20) and Grays Harbor salt
marsh, Washington (site 23) were most closely related to East
Coast populations from Martha’s Vineyard, Massachusetts
(Tisbury and Edgartown Great Ponds, sites 9 and 10).
Relative to other species of Eurytemora, populations of E.
affinis were clearly monophyletic (Fig. 2a). While sequence
divergences in 16S rRNA never exceeded 10% among E.
affinis populations, divergences were 14–18% between E. af-
finis and E. americana and 17–21% between E. affinis and E.
herdmani. These sequence divergences among species of Eur-
ytemora were probably underestimates due to mutational sat-
uration in 16S rRNA (Fig. 4).
Branch lengths from the UPGMA dendrogram (Fig. 6) sug-
gest a separation among major clades (node B) of approxi-
mately 5.1 million years, dating to the time of the Miocene/
Pliocene boundary. This estimate assumes a substitution rate
of approximately 0.9%/million years in 16S rRNA, calibrated
for fiddler crabs (Uca vocator; Sturmbauer et al. 1996) and
Jamaican grapsid crabs (Sesarma; Schubart et al. 1998). Sim-
ilarly, separation appears to have occurred approximately 19
million years ago between E. affinis and E. americana (node
A) and approximately 23 million years ago between E. amer-
icana and E. herdmani. These estimates are extremely rough
due to the uncertainties of the molecular clock and degree
of mutational saturation among congeners (Fig. 4). Level of
divergence among E. affinis ‘‘populations’’ was similar to
that between sister species of the copepod Calanus (C. gla-
cialis and C. marshallae; Bucklin et al. 1995) and was greater
than that among species of grapsid crabs, Sesarma (Schubart
et al. 1998). Divergences among recognized Eurytemora spe-
cies was also large, equivalent to that among species of Cal-
anus (Bucklin et al. 1995) and horseshoe crabs (Avise et al.
1994), and greater than that between king and hermit crabs
(Cunningham et al. 1992). Nodes on the UPGMA tree that
separate the major clades into two groups (nodes C and D,
Fig. 6) were not statistically supported (see Fig. 2a).
The clustering method used to construct the UPGMA tree
2020
CAROL EUNMI LEE
F
IG
. 2. Phylogeny of populations and sibling species of Eurytemora affinis using (a) 16S rRNA (450 base pairs) and (b) cytochrome oxidase
I (COI, 652 base pairs). Locations of populations are shown at branch tips, with numbers designating populations as in Figure 1. Gray
brackets indicate the four major clades, and thick patterned bars (a) and patterned circles (b) represent distinct clades and subclades within
the North American continent (see Fig. 3 for key). The trees shown were constructed with a distance matrix approach using PAUP* 4.0.
Branch lengths reflect genetic distances, with scale bar indicating 5% genetic distance (maximum likelihood). The maximum-likelihood
distances attempt to account for saturation of substitutions. Numbers next to nodes are bootstrap values based on 100 bootstrap replicates
using distance matrix (upper number) and parsimony approaches (lower number; Felsenstein 1985). Bootstrap values of ns indicate branches
not supported by values greater than 50% for a given phylogenetic method. Congeners, E. americana and E. herdmani, were used as outgroup
species for 16S rRNA but not for COI because level of divergence was saturated among congeners (i.e., COI tree is unrooted).
is based on the assumption that the data are ultrametric (have
constant rate of substitutions). A likelihood-ratio test,applied
to test this assumption, could not reject the null hypothesis
that the tree is clocklike. Using 17 populations, the difference
in log likelihoods between tree reconstructions with and with-
out a clock enforced was
Ϫ
1623.5
Ϫ
(
Ϫ
1637.5)
ϭ
14.0. This
value was less than the
2
value of 24.996 (df
ϭ
15,
␣ϭ
0.05), indicating that the likelihood values for the reconstruc-
tions were not significantly different.
Reproductive Incompatibility among ‘‘Populations’’
None of the crosses (Table 1) were able to produce F
2
offspring in both reciprocal directions (Table 2). Males did
2021
PHYLOGEOGRAPHY OF CRYPTIC COPEPOD SPECIES
F
IG
. 2. Continued.
transfer spermatophores, carried by the fifth leg, to the genital
pores of females with no apparent difficulty. Hybrid break-
down was evident not only from statistical differences in
survivorship or development time, but from morphological
deformities of some of the F
1
and F
2
offspring (see below).
Populations from the Columbia River (site 21) and Grays
Harbor salt marsh (site 23) belong to genetically divergent
clades (North Pacific vs. North America) that overlap in dis-
tribution (Table 1; Fig. 3). F
1
and F
2
offspring from these
crosses were morphologically deformed, with antennules less
2022
CAROL EUNMI LEE
F
IG
. 3. Geographic distribution of three North American subclades and the North Pacific clade within the North American continent.
The North Atlantic, Atlantic, and Gulf subclades belong to the North American clade, whereas the North Pacific clade is highly divergent
from all the other clades (Fig. 2). Zones of contact between genetically divergent clades and subclades are in the Pacific Northwest and
Atlantic Northeast regions of the North American continent near the U.S Canadian border.
than half the normal length, and occasionally with stunted
bodies. Degree of isolation was asymmetric in that the F
2
offspring from Grays Harbor females and Columbia River
males did not survive to the adult stage (Table 2). Survival
of adults per clutch in the F
1
generation was significantly
lower in the crosses relative to controls (Table 2; Mann-
Whitney, P
Ͻ
0.05) and proportion of clutches with offspring
that developed to adults was lower (Table 2). F
1
development
time to adulthood was significantly longer for crosses with
Columbia estuary females (P
Ͻ
0.05), but not for crosses
with Grays Harbor females (P
Ͼ
0.1), and variances were
higher in crosses relative to controls. F
1
hybrids assayed for
allozymes were heterozygous for alleles that were fixed (Amy
and Pgm) in the parent populations.
Populations from Edgartown Great Pond and Waquoit Bay
are from genetically divergent subclades (Atlantic vs. North
Atlantic) that overlap in range (Table 1; Fig 3). Very few F
1
offspring were produced, with only two clutches of 30 rep-
licates yielding survivors to adulthood for the Edgartown
female cross and none surviving in the other cross. Lower
survival and longer development times (Table 2; Mann-Whit-
ney, P
Ͻ
0.05) of Edgartown controls relative to those from
the earlier experiment suggests overall lower performance of
copepods in this experiment, which was performed last (see
Methods). Still, the range of development times observed for
controls were within or near the expected range for E. affinis
at 12
Њ
C (Heinle and Flemer 1975). Moreover, interpopulation
crosses were clearly less successful than the controls (Table
2).
The most surprising result emerged from the cross between
the geographically distant but genetically proximate popu-
lations from Atlantic subclade (Table 1; Fig. 3). Crosses be-
tween these populations, Grays Harbor, Washington (site 23)
and Edgartown Great Pond, Massachusetts (site 9), were
much more successful than those between genetically diver-
gent populations, but results showed clear evidence of hybrid
breakdown (Table 2). Percentage of survival to the adult stage
was lower in crosses than in controls, but was not significant
(Mann-Whitney, P
Ͼ
0.05; Table 2). Most notably, crosses
between Edgartown females and Grays Harbor males were
unable to produce F
2
offspring. Out of ten replicate F
1
cross-
es, five F
2
clutches were produced, but none hatched. The
eggs were darker and more opaque than normal eggs and
appeared malformed (with irregular shapes). Results indicate
that speciation has occurred even between these seemingly
closely related populations.
D
ISCUSSION
Clearly, E. affinis is a sibling species complex, composed
of genetically divergent and reproductively isolated ‘‘pop-
ulations’’ that are difficult to distinguish morphologically
(Mayr and Ashlock 1991; Knowlton 1993). Long branch
lengths on the phylogeny in Figure 2b suggest the presence
of at least eight sibling species (North Pacific, Europe, three
subclades within Asia, and three subclades within the North
American clade). Such high levels of genetic divergences
among morphologically indistinct clades of E. affinis were
equivalent to those of morphologically distinct species in
other crustacean groups (Fig. 6; Cunningham et al. 1992).
Furthermore, the number of species within E. affinis may be
even greater, given the reproductive incompatibility between
two genetically proximate (0.15% divergence in COI) yet
morphologically indistinct populations (Tables 1, 2b). Thus,
2023
PHYLOGEOGRAPHY OF CRYPTIC COPEPOD SPECIES
F
IG
. 4. Relationship between transition/transversion ratio (TS/TV)
and percent pairwise sequence divergence for populations of Eur-
ytemora affinis and congeners E. americana and E. herdmani. (a)
Loop regions of 16S rRNA; (b) stem regions of 16S rRNA.
F
IG
. 5. Relationship between transition/transversion ratio (TS/TV)
and percent pairwise sequence divergence for populations of Eur-
ytemora affinis. (a) First codon position of COI, (b) third codon
position of COI. Scale bar beneath the graphs represents the equiv-
alent percent pairwise sequence divergence for all codon positions.
cryptic species that are genetically close but morphologically
indistinguishable may be far more common than previously
thought, yet difficult to detect because of difficulties of per-
forming interpopulation crosses.
Phylogeography
The polytomy among clades suggests near-simultaneous
divergence of major lineages (Fig. 2), with levels of diver-
gence placing the event roughly 5.1 million years ago, during
the late Miocene or early Pliocene (Fig. 6). This estimate is
extremely rough, and could be an overestimate due to rapid
rates of molecular evolution in E. affinis relative to other
crustaceans, resulting from factors such as small body size
(1 mm) and short generation time (about 20 days; Table 2;
Martin and Palumbi 1993). Higher rates of substitution in E.
affinis would place timing of speciation among the major
clades closer to the Pleistocene epoch, which began 2 million
years ago. Assuming that rates from other species are ap-
plicable, a possible scenario of speciation places E. affinis in
the unglaciated Arctic region during the warmer Miocene,
followed by geographic isolation and speciation during a
southward migration resulting from a cooling period about
5 million years ago (Crowley and North 1991).
A power test (Walsh et al. 1999) revealed that the available
sequence data was sufficient to resolve speciation events oc-
curring at intervals of approximately 300,000 years or great-
er. Thus, speciation events appear too rapid to have been
dependent on the lengthy 1 million-year climatic cycles of
the Late Miocene/Early Pliocene (Crowley and North 1991).
Because the power test depends on assumptions of accurate
and even rates of substitution over time, confidence intervals
for this test can be quite large. If the error for the molecular
clock is
Ϯ
0.1%/million years, the confidence interval for the
resolvable internode is about
Ϯ
50,000 years. Mutational sat-
uration can reduce the resolution of this method, by lowering
the number of substitutions (P) relative to expectations and
increasing the actual amount of sequence data required to
resolve the nodes. Attempts to avoid this problem were taken
by using unsaturated datasets. Even with large confidence
intervals, results from the power test appear to support rapid
speciation events amongthe clades that form a polytomy (Fig.
2a).
2024
CAROL EUNMI LEE
F
IG
. 6. UPGMA dendrogram for populations of Eurytemora affinis based on 16S rRNA gene sequences. The scale bar for genetic
distance is based on a Kimura two-parameter model of evolution. Letters enclosed in circles represent major speciation events. B indicates
a speciation event among major clades of E. affinis, when the polytomy in Figure 2a was formed.
Speciation among the clades probably occurred in allop-
atry, when populations radiated from the polar region (or
some other region) and became geographically isolated. The
presence of postmating, but not premating, reproductive iso-
lation among sympatric clades (Table 2) is consistent with
an allopatric model of speciation followed by secondary con-
tact, given that the ability to copulate would have prevented
speciation in sympatry. Thus, overlapping ranges between
divergent clades and subclades in the Pacific Northwest and
Atlantic Northeast regions of the North American continent
(Fig. 3) most likely reflect secondary contact following spe-
ciation events. This secondary contact probably occurred re-
cently, given that regions of contact were glaciated as re-
cently as 15,000 years ago (Hocutt and Wiley 1986). This
ice cover extended as far south as the Washington-Oregon
border on the West Coast and Massachusetts on the East
Coast of the North American continent (Hocutt and Wiley
1986). Sympatric sibling species of E. affinis, such as the
genetically distinct estuarine populations that share a com-
mon drainage (sites 1 and 3), might conceivably be direct
ecological competitors. Given the geographic juxtaposition
of highly divergent clades, it is not surprising that geographic
and genetic distances were not correlated on a global scale
(Mantel’s test, r
ϭ
0.023, P
ϭ
0.25).
Even though large-scale movements might have been nec-
essary to colonize previously ice-covered regions, the lack
of sharing of mtDNA haplotypes among closely related (but
nonidentical) proximate populations indicates very low dis-
persal even between nearby sites (Fig. 2b, Atlantic clade).
This lack of genetic exchange among drainages and conti-
nents argues against a preponderance of long-distance trans-
port of adults or eggs (Conway et al. 1994; Flinkman et al.
1994) by birds or humans, although such transport couldhave
been rare and episodic. Even in modern times, transport of
E. affinis via any means (including humans) appears to have
been restricted to movement upstream into reservoirs and
lakes within drainages (Lee 1999).
The unusually close genetic proximity between West and
East Coast populations of the Atlantic clade (Fig. 3) could
be an example of such a rare episodic dispersal event. The
Atlantic clade probably originated on the East Coast, which
harbors most of the genetic diversity within the clade. Hap-
lotypes were not shared between the coasts, and level of
divergence at 16S rRNA places their common origin at
300,000 to 800,000 years ago, although this could be an
overestimate. This divergence could reflect either the actual
time of separation or failure to assay the source populations
on the East Coast.
Levels of genetic diversity within the Asian clade were
probably underestimated, given that the region between the
Caspian Sea and Japan was not sampled for this study. The
three long branches within the Asian clade probably represent
sibling species of E. affinis, including two genetically diver-
gent groups on the island of Hokkaido, Japan (Fig. 2, sites
2025
PHYLOGEOGRAPHY OF CRYPTIC COPEPOD SPECIES
27, 28 vs. 29, 30). The two divergent groups on Hokkaido
did not speciate in close proximity, as the populations in
Lakes Ohnuma and Akanko (sites 29 and 30) were thought
to have been introduced from the island of Honshu in Japan
(Ban and Minoda 1989).
Morphological Stasis and Plasticity
For the copepod E. affinis, morphological stasis has been
maintained despite dramatic genetic divergences among lin-
eages (Fig. 2). The pattern of morphological stasis across
lineages of E. affinis coupled with high levels of morpho-
logical plasticity within lineages has been found in other
microcrustaceans, such as within the genus Daphnia (Col-
bourne and Hebert 1996). The relatively large morphological
variation within lineages has led to the erroneous subdivision
of E. affinis into invalid species, such as E. hirundo and E.
hirundoides (Busch and Brenning 1992), whereas the large
genetic distances among lineages are not manifested in ob-
vious phenotypic differences (B. W. Frost, pers. comm.). Not
only are rates of morphological and genetic evolution un-
coupled, but patterns of differentiation are discordant. For
instance, two clades within the North American continent
(North Pacific and North America) were morphologically
very close (B. W. Frost, pers. comm.), but were genetically
the most divergent (19% in COI; Fig. 2b). In contrast, the
European clade was the only one that exhibited consistent
and obvious morphological differences from other clades
(with differences in proportions of the body and in the male
fifth leg; B. W. Frost, pers. comm.), but was not more di-
vergent genetically from other clades (Fig. 2).
Morphological conservatism in copepods has evidently led
to a prevalent pattern of undersplitting of groups. An indi-
cation of undersplitting is the fact that copepod orders exhibit
excessive levels of genetic divergence. For instance, branch
lengths in orders of copepods in 18S rRNA is 2.5–5 times
greater than those among branchiopod orders (brine shrimps,
fairy shrimps, and cladocerans, such as Daphnia), and branch
lengths for copepods are always longer than for other crus-
tacean taxa (T. Spears, pers. comm.). Calibrating a molecular
clock for copepods would help determine whether andto what
extent rates of morphological evolution in copepods are re-
tarded. Relationships among morphology, phylogeny, and
habitat type will be addressed in a future study (C. E. Lee
and B. W. Frost, unpubl. ms.).
Speciation within the Eurytemora affinis Complex
Results from this study emphasize that levels of genetic
divergence and reproductive isolation are not comparable
among species and that speciation events can be genetically
cryptic. Reproductive incompatibility between genetically
proximate, but geographically distant populations (sites 9 vs.
23; Table 2) was somewhat surprising. Such low levels of
genetic divergence (Table 1) between populations from Ed-
gartown Great Pond (site 9) and Grays Harbor Marsh (site
23) would not typically warrant species recognition. The lack
of genetic or morphological divergences between these re-
productively isolated ‘‘populations’’ may reflect slow rates
of divergence or recent speciation (Knowlton and Weigt
1997). In this case, recent speciation is more likely, although
the amount of time separating the two populations (or sibling
species) is not known, but only roughly estimated (see
above). It would be informative to examine reproductive
compatibility between genetically and geographically prox-
imate populations of E. affinis to determine whether repro-
ductive isolation is widespread among closely related pop-
ulations.
Reproductive incompatibility between sibling species from
two different clades (sites 21 vs. 23), and subclades (sites 5
vs. 9) was not surprising, given their large genetic distances
(Table 1; Fig. 2). However, reproductive success was greater
for crosses between distant clades (sites 21 and 23; Table 1)
than between subclades (Table 2), suggesting a lack of cor-
relation between genetic distance and reproductive compat-
ibility. However, the number of interpopulation (or interspe-
cific) crosses was not sufficient for detecting a general trend,
given that rates of divergence are stochastic. A large amount
of noise accompanied a positive trend between genetic dis-
tance and reproductive isolation among species of Drosophila
(Coyne and Orr 1989, 1997) and among populations of the
splash pool copepod Tigriopus californicus (Edmands 1999).
Levels of reproductive incompatibility were much greater
in E. affinis than in both T. californicus and Daphnia.Whereas
hybridization was not possible among both genetically prox-
imate and distant populations of E. affinis (Table 2), hybrid-
ization occurred among highly divergent (up to 22.3% in
COI) populations of T. californicus (Edmands 1999) and
among divergent (14% in 12S rRNA) species of Daphnia
(Colbourne and Hebert 1996). The pattern for E. affinis sug-
gests that reproductive incompatibility can evolve rapidly
between populations.
Beneficial effects of hybridization, in terms of F
1
hybrid
vigor, were not evident in this study, in contrast to results
from a study conducted on the genetically distant copepod,
T. californicus (Edmands 1999). Edmands (1999) found in-
creases in F
1
hybrid vigor relative to parentals with no cor-
respondence with genetic distance and a decline in F
2
hybrid
fitness with increasing genetic (0.2–22.3% in COI) and geo-
graphic (5 m to 2007 km) distances. Patterns similar to those
found for T. californicus, of F
1
hybrid vigor and F
2
hybrid
breakdown, might occur for E. affinis with a large number
of crosses among closely related populations.
Even if the genetically divergent sympatric clades of E.
affinis diverged in allopatry followed by seconday contact,
greater levels of prezygotic isolation is generally expected
in sympatry due to reinforcement (of mating discrimination
by natural selection against maladaptive hybrids; Dobzhan-
sky 1937; Coyne and Orr 1997). Such reinforcement was not
detected in this study (Table 2). Only postzygotic reproduc-
tive isolation was evident in the interpopulation (or inter-
specific) crosses, in the form of hybrid sterility or inviability
(Table 2). An adequate test of prezygotic isolation was not
performed in this study, given that mate choice was not al-
lowed during the experiments. It is possible that E. affinis
can discriminate among sibling species using chemical cues,
given that it uses such cues to distinguish conspecifics from
more distantly related copepods (Katona 1973). In addition,
sibling species might actually occur in a state of microal-
lopatry. For instance, the divergent clades in the St. Lawrence
River drainage (sites 1 and 3) might be prevented from com-
2026
CAROL EUNMI LEE
ing into contact through niche partitioning, such as occupying
reaches of the estuary that differ in flow speed or salinity.
The lack of concordance among geographic distance, ge-
netic divergence, reproductive isolation, and morphological
differentiation emphasizes the importance of using multiple
measures for examining patterns and processes of speciation.
At finer scales, within clades, species boundaries may prove
to be nebulous, if reproductive isolation between genetically
proximate ‘‘populations’’ and asymmetries in reproductive
isolation (Table 2) prove to be the rule. The lack of genetic
exchange among sites (especially among drainages) suggests
that for the most part, populations are geographically isolated
and are in the process of speciation. However, genetic ex-
change may become more prevalent in the future with in-
creases in transport facilitated by humans (Lee 1999; Lee and
Bell 1999).
A
CKNOWLEDGMENTS
This project was funded by the following grants and fel-
lowships to CEL: Postdoctoral Fellowship in Biosciences Re-
lated to the Environment, National Science Foundation DEB-
9623649; American Association of University Women Dis-
sertation Fellowship, University of WashingtonRoyalties Re-
search Fund; American Museum of Natural History Lerner
Gray Fund for Marine Research; Sigma Xi Grants in Aid for
Research; and a Hughes Foundation Undergraduate Fellow-
ship to A. Gibson. Most of the interpopulation matings were
performed by C. Petersen and A. Gibson, and M. Rasmussen
assisted with observations. Copepod cultures were main-
tained by P. Velez and M. Rasmussen. Advice and comments
were provided by B. W. Frost, J. Felsenstein, P. Bentzen, R.
S. Burton, N. Knowlton, C. S. Willett, M. A. Bell, J. R.
Cordell, F. D. Ferrari, G. A. Heron, P. C. Jensen, J. G. King-
solver, N. D. Holland, P. Legendre, and J. T. Smith. Copepod
samples were collected by or with assistance from P. Ar-
nofsky, S. Ban, R. Barnhisel, B. P. Bradley, R. Bureau, J.
Castel, J. H. Chick, A. C. Cohen, A. G. Collins, J. R. Cordell,
J. Conway, J. J. Dodson, B. W. Frost, H. Galesloop, J. E.
Havel, B. Libman, P. W. Lienesch, M. Mallin, M. McGrath,
M. R. McIver, I. McLaren, C. M. Moe, J. Orsi, S. Pascal, S.
Plourde, R. D. Podolsky, M. Rasmussen, M. Ringuette, J.
Runge, D. J. Sollet, J. A. Rabalais, M. Viitasalo, J. Vijver-
berg, and M. M. White.
L
ITERATURE
C
ITED
Avise, J. C., W. S. Nelson, and H. Sugita. 1994. A speciational
history of ‘‘living fossils’’: molecular evolutionary patterns in
horseshoe crabs. Evolution 48:1986–2001.
Ban, S., and T. Minoda. 1989. Seasonal distribution of Eurytemora
affinis (Poppe, 1880) (Copepoda; Calanoida) in freshwater Lake
Ohnuma, Hokkaido. Bull. Fac. Fish. Hokkaido Univ. 40:
147–153.
Boileau, M. G. 1991. A genetic determination of cryptic species
(Copepoda: Calanoida) and their postglacial biogeography in
North America. Zool. J. Linn. Soc. 102:375–396.
Bucklin, A., B. W. Frost, and T. D. Kocher. 1995. Molecular sys-
tematics of six Calanus and three Metridia species (Calanoida:
Copepoda). Mar. Biol. 121:655–664.
Burton, R. S. 1990. Hybrid breakdown in developmental time in
the copepod Tigriopus californicus. Evolution 44:1814–1822.
———. 1998. Intraspecific phylogeography across the Point Con-
ception biogeographic boundary. Evolution 52:734–745.
Busch, A., and U. Brenning. 1992. Studies on the status of Eury-
temora affinis (Poppe, 1880) (Copepoda, Calanoida). Crusta-
ceana 62:13–38.
Carrillo, E., C. B. Miller, and P. H. Wiebe. 1974. Failure of inter-
breeding between Atlantic and Pacific populations of the marine
calanoid copepod Acartia clausi Giesbrecht. Limnol. Oceanogr.
19:452–458.
Castel, J., and A. Feurtet. 1993. Morphological variations in the
estuarine copepod Eurytemora affinis as a response to environ-
mental factors. Pp. 179–189 in Proceedings of the twenty-sev-
enth European marine biology symposium, Dublin, Ireland.
Cervelli, M., B. Battaglia, P. M. Bisol, A. Comaschi Scaramuzza,
and F. Menghetti. 1995. Genetic differentiation in the genus
Acartia from the Lagoon of Venice. Vie et Milieu 45:117–122.
Colbourne, J. K., and P. D. N. Hebert. 1996. The systematics of
North American Daphnia (Crustacea: Anomopoda): a molecular
phylogenetic approach. Phil. Trans. R. Soc. Lond. B 351:
349–360.
Conway, D. V. P., I. R. B. McFadzen, and P. R. G. Tranter. 1994.
Digestion of copepod eggs by larval turbot Scophthalmus max-
imus and egg viability following gut passage. Mar. Ecol. Prog.
Ser. 106:303–309.
Coyne, J. A., and H. A. Orr. 1989. Patterns of speciation in Dro-
sophila. Evolution 43:362–381.
———. 1997. ‘‘Patterns of speciation in Drosophila’’ revisited.
Evolution 51:295–303.
Crowley, T. J., and G. R. North. 1991. Paleoclimatology. Oxford
Univ. Press, New York.
Cunningham, C. W., N. W. Blackstone, and L. W. Buss. 1992.
Evolution of king crabs from hermit crab ancestors. Nature 355:
539–542.
Dobzhansky, T. 1937. Genetics and the origin of species. Columbia
Univ. Press, New York.
Edmands, S. 1999. Heterosis and outbreeding depression in inter-
population crosses spanning a wide range of divergence. Evo-
lution 53:1757–1768.
Einsle, U. 1996. Cyclops heberti n. sp. and Cyclops singularis n.
sp., two new species within the genus Cyclops (‘strenuus-sub-
group’) (Crust. Copepoda) from ephemeral ponds in southern
Germany. Hydrobiologia 319:167–177.
Farris, J. S., A. Ka¨llersjo¨, G. Kuge, and C. Bult. 1995. Constructing
a significance test for incongruence. Syst. Biol. 44:570–572.
Felsenstein, J. 1981. Evolutionary trees from DNA sequences: a
maximum likelihood approach. J. Mol. Evol. 17:368–376.
———. 1985. Confidence limits on phylogenies: an approach using
the bootstrap. Evolution 39:783–791.
Fleminger, A., and K. Hulsemann. 1987. Geographical variation in
Calanus helgolandicus (Copepoda, Calanoida) and evidence of
recent speciation of the Black Sea population. Biol. Oceanogr.
5:43–81.
Flinkman, J., I. Vuorinen, and M. Christiansen. 1994. Calanoid
copepod eggs survive passage through fish digestive tracts. ICES
J. Marine Sci. 51:127–129.
Folmer, O., M. Black, W. Hoeh, R. Lutz, and R. Vrijenhoek. 1994.
DNA primers for amplification of mitochondrial cytochrome c
oxidase subunit I from diverse metazoan invertebrates. Mol.
Mar. Biol. Biotech. 3:294–299.
Frost, B. W. 1974. Calanus marshallae, a new species of calanoid
copepod closely allied to the sibling species C. finmarchicus and
C. glacialis. Mar. Biol. 26:77–99.
———. 1989. A taxonomy of the marine calanoid copepod genus
Pseudocalanus. Can. J. Zool. 67:525–551.
Ganz, H. H., and R. S. Burton. 1995. Genetic differentiation and
reproductive incompatibility among Baja California populations
of the copepod Tigriopus californicus. Mar. Biol. 123:821–827.
Giesbrecht, W. 1881. Vorla¨ufige Mitteilung aus einer Arbeit u¨ber
die freilebenden Copepoden des Kieler Hafens. Zool. Anz. 4:
254–258.
Heinle, D. R., and D. A. Flemer. 1975. Carbon requirements of a
population of the estuarine copepod Eurytemora affinis. Mar.
Biol. 31:235–247.
Hocutt, C. H., and E. O. Wiley. 1986. The zoogeography of North
American freshwater fishes. John Wiley and Sons, New York.
2027
PHYLOGEOGRAPHY OF CRYPTIC COPEPOD SPECIES
Hoelzel, A. R., and A. Green. 1992. Analysis of population-level
variation by sequencing PCR-amplified DNA. Pp. 159–187 in
A. R. Hoelzel, ed. Molecular genetic analysis of populations: a
practical approach. Oxford Univ. Press, New York.
Huelsenbeck, J. P., and B. Rannala. 1997. Phylogenetic methods
come of age: testing hypotheses in an evolutionary context. Sci-
ence 276:227–232.
Katona, S. K. 1973. Evidence for sex pheromones in planktonic
copepods. Limnol. Oceanogr. 18:574–583.
Knowlton, N. 1993. Sibling species in the sea. Annu. Rev. Ecol.
Syst. 24:189–216.
Knowlton, N., and L. A. Weigt. 1997. Species of marine inverte-
brates: a comparison of the biological and phylogenetic species
concepts. Pp. 199–219 in M. F. Claridge, H. A. Dawah, and M.
R. Wilson, eds. Species: the units of biodiversity. Chapman and
Hall, New York.
Kocher, T. D., J. A. Conroy, K. R. McKaye, J. R. Stauffer, and S.
F. Lockwood. 1995. Evolution of NADH dehydrogenase subunit
2 in East African cichlid fish. Mol. Phyl. Evol. 4:420–432.
Lee, C. E. 1999. Rapid and repeated invasions of fresh water by
the saltwater copepod Eurytemora affinis. Evolution 53:
1423–1434.
Lee, C. E., and M. A. Bell. 1999. Causes and consequences of recent
freshwater invasions by saltwater animals. Trends Ecol. Evol.
14:284–288.
Legendre, P., and A. Vaudor. 1991. The R package: multidimen-
sional analysis, spatial analysis. Univ. of Montreal, Montreal.
Mantel, N. 1967. The detection of disease clustering and a gener-
alized regression approach. Cancer Res. 27:209–220.
Martin, A. P., and S. R. Palumbi. 1993. Body size, metabolic rate,
generation time, and the molecular clock. Proc. Natl. Acad. Sci.
90:4087–4091.
Mauchline, J. 1998. The biology of calanoid copepods. Academic
Press, San Diego, CA.
Mayr, E., and P. D.Ashlock. 1991. Principles ofsystematiczoology.
McGraw-Hill, New York.
McKinnon, A. D., W. J. Kimmerer, and J. A. H. Benzie. 1992.
Sympatric sibling species within the genus Acartia (Copepoda:
Calanoida): a case study from Westernport and PortPhillip Bays,
Australia. J. Crust. Biol. 12:239–259.
Messenger, S. L., and J. A. McGuire. 1998. Morphology, molecules,
and the phylogenetics of cetaceans. Syst. Biol. 47:90–124.
Nordquist, O. 1888. Die Calaniden Finlands. Bidrag till Ka¨nnedom
af Finlands Natur och Folk 47:1–86.
Palumbi, S. R. 1996. Nucleic acids. II. The polymerase chain re-
action. Pp. 205–247 in D. M. Hillis, C. Moritz and B. K. Mable,
eds. Molecular systematics. Sinauer Associates, Sunderland,
MA.
Poppe, S. A. 1880. U
¨
ber eine neue Art der Calaniden-Gattung Te-
mora, Baird. Abhandlg. Naturw. Verein Bremen 7:55–60.
Reid, J. W. 1998. How ‘‘cosmopolitan’’ are the continental cyclo-
poid copepods? Comparison of the North American and Eur-
asians faunas, with description of Acanthocyclops parasensitivus
sp. n. (Copepoda: Cyclopoida) from the U.S.A. Zool. Anz. 236:
109–118.
Saitou, N., and M. Nei. 1987. The neighbor-joining method: a new
method for reconstructing phylogenetic trees. Mol. Biol. Evol.
4:406–425.
Saunders, J. F. 1993. Distribution of Eurytemora affinis (Copepoda:
Calanoida) in the southern Great Plains, with notes on zooge-
ography. J. Crust. Biol. 13:564–570.
Schubart, C. D., R. Diesel, and S. B. Hedges. 1998. Rapid evolution
to terrestrial life in Jamaican crabs. Nature 393:363–365.
Sevigny, J M., I. A. Mclaren, andB. W. Frost. 1989.Discrimination
among and variation within species of Pseudocalanus based on
the GPI locus. Mar. Biol. 102:321–328.
Sturmbauer, C., J. S. Levinton, and J. Christy. 1996. Molecular
phylogeny analysis of fiddler crabs: test of the hypothesis of
increasing behavioral complexity in evolution. Proc. Nat. Acad.
Sci. 93:10855–10857.
Swofford, D. L. 1998. PAUP*: phylogenetic analysis using parsi-
mony. Ver. 4.0. Sinauer Associates, Sunderland, MA.
Walsh, H. E., M. G. Kidd, T. Moum, and V. L. Friesen. 1999.
Polytomies and the power of phylogenetic inference. Evolution
53:932–937.
Wilson, M. S. 1959. Calanoida. Pp. 738–794 in W. T. Edmondson,
ed. Freshwater biology. John Wiley and Sons, New York.
Yang, Z. 1996. Among-site rate variation and its impact on phy-
logenetic analyses. Trends Ecol. Evol. 11:367–372.
Corresponding Editor: B. Bowen