Tài liệu Dietary Guidelines for Americans 2005 pptx
Bạn đang xem bản rút gọn của tài liệu. Xem và tải ngay bản đầy đủ của tài liệu tại đây (3.94 MB, 84 trang )
Dietary Guidelines
for Americans
2005
U.S. Department of Health and Human Services
U.S. Department of Agriculture
www.healthierus.gov/dietaryguidelines i
M
ESSAGE FROM THE SECRETARIES
We are pleased to present the 2005
Dietary Guidelines for Americans
. This document is intended to be a primary
source of dietary health information for policymakers, nutrition educators, and health providers. Based on the latest
scientific evidence, the 2005
Dietary Guidelines
provides information and advice for choosing a nutritious diet,
maintaining a healthy weight, achieving adequate exercise, and “keeping foods safe” to avoid foodborne illness.
This document is based on the recommendations put forward by the Dietary Guidelines Advisory Committee. The
Committee was composed of scientific experts who were responsible for reviewing and analyzing the most current
dietary and nutritional information and incorporating this into a scientific evidence-based report. We want to thank
them and the other public and private professionals who assisted in developing this document for their hard work
and dedication.
The more we learn about nutrition and exercise, the more we recognize their importance in everyday life. Children
need a healthy diet for normal growth and development, and Americans of all ages may reduce their risk of chronic
disease by adopting a nutritious diet and engaging in regular physical activity.
However, putting this knowledge into practice is difficult. More than 90 million Americans are affected by chronic
diseases and conditions that compromise their quality of life and well-being. Overweight and obesity, which are
risk factors for diabetes and other chronic diseases, are more common than ever before. To correct this problem,
many Americans must make significant changes in their eating habits and lifestyles.
We live in a time of widespread availability of food options and choices. More so than ever, consumers need good
advice to make informed decisions about their diets. The 2005
Dietary Guidelines
will help Americans choose a
nutritious diet within their energy requirements. We believe that following the recommendations in the
Dietary
Guidelines
will assist many Americans in living longer, healthier, and more active lives.
Tommy G. Thompson
Secretary of Health and Human Services
Ann M. Veneman
Secretary of Agriculture
ii
ACKNOWLEDGMENTS
The U.S. Department of Health and Human Services (HHS) and the U.S. Department of Agriculture (USDA) acknowledge
the recommendations of the Dietary Guidelines Advisory Committee—the basis for this edition. The Committee
consisted of Janet C. King, Ph.D., R.D. (chair), Lawrence J. Appel, M.D., M.P.H., Benjamin Caballero, M.D., Ph.D., Fergus
M. Clydesdale, Ph.D., Penny M. Kris-Etherton, Ph.D., R.D., Theresa A. Nicklas, Dr.P.H., M.P.H., L.N., F. Xavier Pi-Sunyer,
M.D., M.P.H., Yvonne L. Bronner, Sc.D., R.D., L.D., Carlos A. Camargo, M.D., Dr.P.H., Vay Liang W. Go, M.D., Joanne R.
Lupton, Ph.D., Russell R. Pate, Ph.D., Connie M. Weaver, Ph.D., and the scientific writer/editor, Carol Suitor, Sc.D.
The Departments also acknowledge the work of the departmental scientists, staff, and policy officials responsible for
the production of this document:
From HHS: Laura Lawlor, Michael O'Grady, Ph.D., Cristina Beato, M.D., Les Crawford, D.V.M., Ph.D., Barbara Schneeman,
Ph.D., Kathryn Y. McMurry, M.S., Deb Galuska, Ph.D., Van Hubbard, M.D., Ph.D., Mary Mazanec, M.D., J.D., Penelope
Royall, P.T., M.S.W., Laina Bush, M.B.A., Diane Thompson M.P.H., R.D., Susan Anderson, M.S., R.D., Jean Pennington,
R.D., Ph.D., Susan M. Krebs-Smith, Ph.D., R.D., Wendy Johnson-Taylor, Ph.D., Kim Stitzel, M.S., R.D., Jennifer Weber, R.D.,
M.P.H., Pamela E. Starke-Reed, Ph.D., Paula R. Trumbo, Ph.D., Jennifer Seymour, Ph.D., Darla Danford, D.Sc., M.P.H, R.D.,
Christine Dobday, Donna Robie Howard, Ph.D., Ginny Gunderson, and Adam Michael Clark, Ph.D.
From USDA: Beth Johnson, M.S., R.D., Eric Bost, Eric Hentges, Ph.D., Kate Coler, Rodney Brown, Ph.D., Carole Davis,
M.S., R.D., Dorothea K. Vafiadis, M.S., Joan M.G. Lyon, M.S., R.D., L.D., Trish Britten, Ph.D., Molly Kretsch, Ph.D., Pamela
Pehrsson, Ph.D., Jan Stanton, M.S., M.B.A., R.D., Susan Welsh, Ph.D., Joanne Guthrie, M.P.H., R.D., Ph.D., David Klurfeld,
Ph.D., Gerald F. Combs, Jr., Ph.D., Beverly Clevidence, Ph.D., Robert Mitchell Russell, M.D., Colette I. Thibault, M.S., R.D.,
L.D., Sedigheh-Essie Yamini, Ph.D., R.D., Kristin L. Marcoe, M.B.A., R.D., and David M. Herring, M.S.
The Departments also acknowledge the important role of those who provided input and public comments throughout
this process. Finally, the Departments acknowledge the contributions of numerous other internal departmental scientists
and staff that contributed to the production of this document, including the members of the Independent Scientific
Review Panel who peer reviewed the recommendations of the document to ensure they were based on a preponderance
of scientific evidence.
DIE TARY G UID E LIN E S FO R AM E RIC AN S, 2005
iii
Contents
MESSAGE FROM THE SECRETARIES . . . . . . . . . . . . . . . . . . . . . . . . . . . . . . . . . . . . . . . . . . . . . . . . . . . . . . . . . . . . . . . . . . . . . . i
ACKNOWLEDGMENTS . . . . . . . . . . . . . . . . . . . . . . . . . . . . . . . . . . . . . . . . . . . . . . . . . . . . . . . . . . . . . . . . . . . . . . . . . . . . . . . . . . . . . . . . . ii
EXECUTIVE SUMMARY . . . . . . . . . . . . . . . . . . . . . . . . . . . . . . . . . . . . . . . . . . . . . . . . . . . . . . . . . . . . . . . . . . . . . . . . . . . . . . . . . . . . . . . . .v
CHAPTER 1 Background and Purpose of the Dietary Guidelines for Americans . . . . . . . . . . . . . . . . . . . . . . . . . . . . . . . . . 1
CHAPTER 2 Adequate Nutrients Within Calorie Needs . . . . . . . . . . . . . . . . . . . . . . . . . . . . . . . . . . . . . . . . . . . . . . . . . . . . . . 5
CHAPTER 3 Weight Management . . . . . . . . . . . . . . . . . . . . . . . . . . . . . . . . . . . . . . . . . . . . . . . . . . . . . . . . . . . . . . . . . . . . . . 13
CHAPTER 4 Physical Activity . . . . . . . . . . . . . . . . . . . . . . . . . . . . . . . . . . . . . . . . . . . . . . . . . . . . . . . . . . . . . . . . . . . . . . . . . . 19
CHAPTER 5 Food Groups To Encourage . . . . . . . . . . . . . . . . . . . . . . . . . . . . . . . . . . . . . . . . . . . . . . . . . . . . . . . . . . . . . . . . . 23
CHAPTER 6 Fats . . . . . . . . . . . . . . . . . . . . . . . . . . . . . . . . . . . . . . . . . . . . . . . . . . . . . . . . . . . . . . . . . . . . . . . . . . . . . . . . . . . . 29
CHAPTER 7 Carbohydrates . . . . . . . . . . . . . . . . . . . . . . . . . . . . . . . . . . . . . . . . . . . . . . . . . . . . . . . . . . . . . . . . . . . . . . . . . . . 35
CHAPTER 8 Sodium and Potassium . . . . . . . . . . . . . . . . . . . . . . . . . . . . . . . . . . . . . . . . . . . . . . . . . . . . . . . . . . . . . . . . . . . . 39
CHAPTER 9 Alcoholic Beverages . . . . . . . . . . . . . . . . . . . . . . . . . . . . . . . . . . . . . . . . . . . . . . . . . . . . . . . . . . . . . . . . . . . . . . . 43
CHAPTER 10 Food Safety . . . . . . . . . . . . . . . . . . . . . . . . . . . . . . . . . . . . . . . . . . . . . . . . . . . . . . . . . . . . . . . . . . . . . . . . . . . . . . 47
APPENDIX A Eating Patterns . . . . . . . . . . . . . . . . . . . . . . . . . . . . . . . . . . . . . . . . . . . . . . . . . . . . . . . . . . . . . . . . . . . . . . . . . . . 51
APPENDIX A-1 DASH Eating Plan at 1,600-, 2,000-, 2,600-, and 3,100-Calorie Levels . . . . . . . . . . . . . . . . . . . . . . . . . . . . . 51
APPENDIX A-2 USDA Food Guide . . . . . . . . . . . . . . . . . . . . . . . . . . . . . . . . . . . . . . . . . . . . . . . . . . . . . . . . . . . . . . . . . . . . . . . . 53
APPENDIX A-3 Discretionary Calorie Allowance in the USDA Food Guide . . . . . . . . . . . . . . . . . . . . . . . . . . . . . . . . . . . . . . . . 55
APPENDIX B Food Sources of Selected Nutrients . . . . . . . . . . . . . . . . . . . . . . . . . . . . . . . . . . . . . . . . . . . . . . . . . . . . . . . . . . 56
APPENDIX B-1 Food Sources of Potassium . . . . . . . . . . . . . . . . . . . . . . . . . . . . . . . . . . . . . . . . . . . . . . . . . . . . . . . . . . . . . . . . .56
APPENDIX B-2 Food Sources of Vitamin E . . . . . . . . . . . . . . . . . . . . . . . . . . . . . . . . . . . . . . . . . . . . . . . . . . . . . . . . . . . . . . . . . 57
APPENDIX B-3 Food Sources of Iron . . . . . . . . . . . . . . . . . . . . . . . . . . . . . . . . . . . . . . . . . . . . . . . . . . . . . . . . . . . . . . . . . . . . . . 58
APPENDIX B-4 Non-Dairy Food Sources of Calcium . . . . . . . . . . . . . . . . . . . . . . . . . . . . . . . . . . . . . . . . . . . . . . . . . . . . . . . . . 59
APPENDIX B-5 Food Sources of Calcium . . . . . . . . . . . . . . . . . . . . . . . . . . . . . . . . . . . . . . . . . . . . . . . . . . . . . . . . . . . . . . . . . . 60
APPENDIX B-6 Food Sources of Vitamin A . . . . . . . . . . . . . . . . . . . . . . . . . . . . . . . . . . . . . . . . . . . . . . . . . . . . . . . . . . . . . . . . . 61
APPENDIX B-7 Food Sources of Magnesium . . . . . . . . . . . . . . . . . . . . . . . . . . . . . . . . . . . . . . . . . . . . . . . . . . . . . . . . . . . . . . . 62
APPENDIX B-8 Food Sources of Dietary Fiber . . . . . . . . . . . . . . . . . . . . . . . . . . . . . . . . . . . . . . . . . . . . . . . . . . . . . . . . . . . . . . .63
APPENDIX B-9 Food Sources of Vitamin C . . . . . . . . . . . . . . . . . . . . . . . . . . . . . . . . . . . . . . . . . . . . . . . . . . . . . . . . . . . . . . . . . 65
APPENDIX C Glossary of Terms . . . . . . . . . . . . . . . . . . . . . . . . . . . . . . . . . . . . . . . . . . . . . . . . . . . . . . . . . . . . . . . . . . . . . . . . 67
APPENDIX D Acronyms . . . . . . . . . . . . . . . . . . . . . . . . . . . . . . . . . . . . . . . . . . . . . . . . . . . . . . . . . . . . . . . . . . . . . . . . . . . . . . . 70
DIETARY GUIDELINES FOR AMERICANS, 2005
iv
LIST OF FIGURES
FIGURE 1. Percent Increase or Decrease
From Current Consumption (Zero Line)
to Recommended Intakes
FIGURE 2. Adult BMI Chart
FIGURE 3. Example of Boys’ BMI Growth Curve
(2 to 20 years): Boys’ Body Mass
Index-For-Age Percentiles
FIGURE 4. Sources of Dietary Sodium
FIGURE 5. Temperature Rules for Safe Cooking
and Handling of Foods
LIST OF TABLES
TABLE 1. Sample USDA Food Guide and the Dietary
Approaches to Stop Hypertension (DASH)
Eating Plan at the 2,000-Calorie Level
TABLE 2. Comparison of Selected Nutrients in the DASH
Eating Plan, the USDA Food Guide, and Nutrient
Intakes Recommended Per Day by the Institute
of Medicine (IOM)
TABLE 3. Estimated Calorie Requirements (in Kilocalories)
for Each Gender and Age Group at Three Levels
of Physical Activity
TABLE 4. Calories/Hour Expended in Common Physical
Activities
TABLE 5. Fruits, Vegetables, and Legumes (Dry Beans)
That Contain Vitamin A (Carotenoids), Vitamin C,
Folate, and Potassium
TABLE 6. Comparison of 100 Grams of Whole-Grain
Wheat Flour and Enriched, Bleached, White,
All-Purpose Flour
TABLE 7. Whole Grains Available in the United States
TABLE 8. Maximum Daily Amounts of Saturated Fat
To Keep Saturated Fat Below 10 Percent
of Total Calorie Intake
TABLE 9. Differences in Saturated Fat and Calorie
Content of Commonly Consumed Foods
TABLE 10. Contribution of Various Foods to Saturated
Fat Intake in the American Diet
(Mean Intake = 25.5 g)
TABLE 11. Contribution of Various Foods to Trans Fat
Intake in the American Diet
(Mean Intake = 5.84 g)
TABLE 12. Relationship Between LDL Blood Cholesterol Goal
and the Level of Coronary Heart Disease Risk
TABLE 13. Major Sources of Added Sugars
(Caloric Sweeteners) in the American Diet
TABLE 14. Names for Added Sugars That Appear
on Food Labels
TABLE 15. Range of Sodium Content for Selected Foods
TABLE 16. Calories in Selected Alcoholic Beverages
DIETARY GUIDELINES FOR AMERICANS, 2005
v
Executive Summary
The
Dietary Guidelines for Americans [Dietary Guidelines]
provides science-based advice to promote health and to
reduce risk for major chronic diseases through diet and
physical activity. Major causes of morbidity and mortality
in the United States are related to poor diet and a seden-
tary lifestyle. Some specific diseases linked to poor diet
and physical inactivity include cardiovascular disease,
type 2 diabetes, hypertension, osteoporosis, and certain
cancers. Furthermore, poor diet and physical inactivity,
resulting in an energy imbalance (more calories consumed
than expended), are the most important factors contrib-
uting to the increase in overweight and obesity in this
country. Combined with physical activity, following a diet
that does not provide excess calories according to the
recommendations in this document should enhance the
health of most individuals.
An important component of each 5-year revision of the
Dietary Guidelines
is the analysis of new scientific informa-
tion by the Dietary Guidelines Advisory Committee (DGAC)
appointed by the Secretaries of the U.S. Department of
Health and Human Services (HHS) and the U.S. Department
of Agriculture (USDA). This analysis, published in the DGAC
Report (
report/), is the primary resource for development of the
report on the Guidelines by the Departments. The
Dietary
Guidelines
and the report of the DGAC differ in scope and
purpose compared to reports for previous versions of the
Guidelines.
The 2005 DGAC report is a detailed scientific
analysis. The scientific report was used to develop the
Dietary Guidelines
jointly between the two Departments
and forms the basis of recommendations that will be used
by USDA and HHS for program and policy development.
DIETARY GUIDELINES FOR AMERICANS, 2005
vi
Thus it is a publication oriented toward policymakers,
nutrition educators, nutritionists, and healthcare providers
rather than to the general public, as with previous
versions of the
Dietary Guidelines
, and contains more
technical information.
The intent of the
Dietary Guidelines
is to summarize and
synthesize knowledge regarding individual nutrients and
food components into recommendations for a pattern
of eating that can be adopted by the public. In this publi-
cation, Key Recommendations are grouped under nine
inter-related focus areas. The recommendations are based
on the preponderance of scientific evidence for lowering
risk of chronic disease and promoting health. It is impor-
tant to remember that these are integrated messages that
should be implemented as a whole. Taken together, they
encourage most Americans to eat fewer calories, be more
active, and make wiser food choices.
A basic premise of the
Dietary Guidelines
is that nutrient
needs should be met primarily through consuming foods.
Foods provide an array of nutrients and other compounds
that may have beneficial effects on health. In certain cases,
fortified foods and dietary supplements may be useful
sources of one or more nutrients that otherwise might be
consumed in less than recommended amounts. However,
dietary supplements, while recommended in some cases,
cannot replace a healthful diet.
Two examples of eating patterns that exemplify the
Dietary Guidelines
are the USDA Food Guide (http://
www.usda.gov/cnpp/pyramid.html) and the DASH
(Dietary Approaches to Stop Hypertension) Eating Plan.
1
Both of these eating patterns are designed to integrate
dietary recommendations into a healthy way to eat for
most individuals. These eating patterns are not weight
loss diets, but rather illustrative examples of how to eat
in accordance with the
Dietary Guidelines
. Both eating
patterns are constructed across a range of calorie levels
to meet the needs of various age and gender groups. For
the USDA Food Guide, nutrient content estimates for
each food group and subgroup are based on population-
weighted food intakes. Nutrient content estimates for
the DASH Eating Plan are based on selected foods
chosen for a sample 7-day menu. While originally devel-
oped to study the effects of an eating pattern on the
prevention and treatment of hypertension, DASH is one
example of a balanced eating plan consistent with the
2005
Dietary Guidelines
.
Throughout most of this publication, examples use a
2,000-calorie level as a reference for consistency with the
Nutrition Facts Panel. Although this level is used as a
reference, recommended calorie intake will differ for indi-
viduals based on age, gender, and activity level. At each
calorie level, individuals who eat nutrient-dense foods
may be able to meet their recommended nutrient intake
without consuming their full calorie allotment. The remain-
ing calories—the
discretionary calorie allowance
—allow
individuals flexibility to consume some foods and beverages
that may contain added fats, added sugars, and alcohol.
The recommendations in the
Dietary Guidelines
are for
Americans over 2 years of age. It is important to incorporate
the food preferences of different racial/ethnic groups, vege-
Taken together, [the
Dietary Guidelines
]
encourage most
Americans to eat
fewer calories, be
more active, and make
wiser food choices.
1
NIH Publication No. 03-4082, Facts about the DASH Eating Plan, United States Department of Health and Human Services, National Institutes of Health, National Heart, Lung, and Blood Institute,
Karanja NM et al. Journal of the American Dietetic Association (JADA) 8:S19-27, 1999.
DIE TARY G UID E LIN E S FO R AM E RIC AN S, 2005
vii
tarians, and other groups when planning diets and devel-
oping educational programs and materials. The USDA Food
Guide and the DASH Eating Plan are flexible enough to
accommodate a range of food preferences and cuisines.
The
Dietary Guidelines
is intended primarily for use
by policymakers, healthcare providers, nutritionists, and
nutrition educators. The information in the
Dietary
Guidelines
is useful for the development of educational
materials and aids policymakers in designing and imple-
menting nutrition-related programs, including federal
food, nutrition education, and information programs. In
addition, this publication has the potential to provide
authoritative statements as provided for in the Food
and Drug Administration Modernization Act (FDAMA).
Because the
Dietary Guidelines
contains discussions
where the science is emerging, only statements included
in the Executive Summary and the sections titled “Key
Recommendations,” which reflect the preponderance
of scientific evidence, can be used for identification of
authoritative statements. The recommendations are inter-
related and mutually dependent; thus the statements
in this document should be used together in the context
of planning an overall healthful diet. However, even
following just some of the recommendations can have
health benefits.
The following is a listing of the
Dietary Guidelines
by chapter.
ADEQUATE NUTRIENTS WITHIN
CALORIE NEEDS
Key Recommendations
• Consume a variety of nutrient-dense foods and bever-
ages within and among the basic food groups while
choosing foods that limit the intake of saturated and
trans
fats, cholesterol, added sugars, salt, and alcohol.
• Meet recommended intakes within energy needs by
adopting a balanced eating pattern, such as the USDA
Food Guide or the DASH Eating Plan.
Key Recommendations for Specific Population Groups
•
People over age 50.
Consume vitamin B
12
in its
crystalline form (i.e., fortified foods or supplements).
•
Women of childbearing age who may become pregnant.
Eat foods high in heme-iron and/or consume iron-rich
plant foods or iron-fortified foods with an enhancer of
iron absorption, such as vitamin C-rich foods.
•
Women of childbearing age who may become pregnant
and those in the first trimester of pregnancy.
Consume
adequate synthetic folic acid daily (from fortified foods
or supplements) in addition to food forms of folate from
a varied diet.
•
Older adults, people with dark skin, and people exposed
to insufficient ultraviolet band radiation (i.e., sunlight).
Consume extra vitamin D from vitamin D-fortified foods
and/or supplements.
WEIGHT MANAGEMENT
Key Recommendations
• To maintain body weight in a healthy range,
balance calories from foods and beverages with
calories expended.
• To prevent gradual weight gain over time, make
small decreases in food and beverage calories and
increase physical activity.
Key Recommendations for Specific Population Groups
•
Those who need to lose weight.
Aim for a slow, steady
weight loss by decreasing calorie intake while main-
taining an adequate nutrient intake and increasing
physical activity.
•
Overweight children.
Reduce the rate of body weight
gain while allowing growth and development. Consult
a healthcare provider before placing a child on a
weight-reduction diet.
•
Pregnant women.
Ensure appropriate weight gain
as specified by a healthcare provider.
•
Breastfeeding women.
Moderate weight reduction
is safe and does not compromise weight gain of the
nursing infant.
•
Overweight adults and overweight children with
chronic diseases and/or on medication.
Consult a
healthcare provider about weight loss strategies prior
to starting a weight-reduction program to ensure
appropriate management of other health conditions.
DIETARY GUIDELINES FOR AMERICANS, 2005
viii
PHYSICAL ACTIVITY
Key Recommendations
• Engage in regular physical activity and reduce
sedentary activities to promote health, psychological
well-being, and a healthy body weight.
• To reduce the risk of chronic disease in adulthood:
Engage in at least 30 minutes of moderate-intensity
physical activity, above usual activity, at work or
home on most days of the week.
• For most people, greater health benefits can be
obtained by engaging in physical activity of more
vigorous intensity or longer duration.
• To help manage body weight and prevent gradual,
unhealthy body weight gain in adulthood: Engage in
approximately 60 minutes of moderate- to vigorous-
intensity activity on most days of the week while
not exceeding caloric intake requirements.
• To sustain weight loss in adulthood: Participate in
at least 60 to 90 minutes of daily moderate-intensity
physical activity while not exceeding caloric intake
requirements. Some people may need to consult
with a healthcare provider before participating in
this level of activity.
• Achieve physical fitness by including cardiovascular
conditioning, stretching exercises for flexibility, and
resistance exercises or calisthenics for muscle strength
and endurance.
Key Recommendations for Specific Population Groups
•
Children and adolescents
. Engage in at least 60
minutes of physical activity on most, preferably all,
days of the week.
•
Pregnant women.
In the absence of medical or obstetric
complications, incorporate 30 minutes or more of
moderate-intensity physical activity on most, if not all,
days of the week. Avoid activities with a high risk of
falling or abdominal trauma.
•
Breastfeeding women.
Be aware that neither acute nor
regular exercise adversely affects the mother’s ability
to successfully breastfeed.
•
Older adults
. Participate in regular physical activity to
reduce functional declines associated with aging and
to achieve the other benefits of physical activity identi-
fied for all adults.
DIETARY GUIDELINES FOR AMERICANS, 2005
FOOD GROUPS TO ENCOURAGE
Key Recommendations
• Consume a sufficient amount of fruits and vegetables
while staying within energy needs. Two cups of fruit
and 2
1
/2 cups of vegetables per day are recommended
for a reference 2,000-calorie intake, with higher or
lower amounts depending on the calorie level.
• Choose a variety of fruits and vegetables each day.
In particular, select from all five vegetable subgroups
(dark green, orange, legumes, starchy vegetables, and
other vegetables) several times a week.
• Consume 3 or more ounce-equivalents of whole-grain
products per day, with the rest of the recommended
grains coming from enriched or whole-grain products.
In general, at least half the grains should come from
whole grains.
• Consume 3 cups per day of fat-free or low-fat milk or
equivalent milk products.
Key Recommendations for Specific Population Groups
•
Children and adolescents.
Consume whole-grain prod-
ucts often; at least half the grains should be whole
grains. Children 2 to 8 years should consume 2 cups
per day of fat-free or low-fat milk or equivalent milk
products. Children 9 years of age and older should
consume 3 cups per day of fat-free or low-fat milk or
equivalent milk products.
FATS
Key Recommendations
• Consume less than 10 percent of calories from
saturated fatty acids and less than 300 mg/day
of cholesterol, and keep
trans
fatty acid consumption
as low as possible.
• Keep total fat intake between 20 to 35 percent of
calories, with most fats coming from sources of polyun-
saturated and monounsaturated fatty acids, such as
fish, nuts, and vegetable oils.
• When selecting and preparing meat, poultry, dry beans,
and milk or milk products, make choices that are lean,
low-fat, or fat-free.
• Limit intake of fats and oils high in saturated and/or
trans
fatty acids, and choose products low in such fats
and oils.
ix
Key Recommendations for Specific Population Groups
•
Children and adolescents
. Keep total fat intake between
30 to 35 percent of calories for children 2 to 3 years of age
and between 25 to 35 percent of calories for children and
adolescents 4 to 18 years of age, with most fats coming
from sources of polyunsaturated and monounsaturated
fatty acids, such as fish, nuts, and vegetable oils.
CARBOHYDRATES
Key Recommendations
• Choose fiber-rich fruits, vegetables, and whole
grains often.
• Choose and prepare foods and beverages with little
added sugars or caloric sweeteners, such as amounts
suggested by the USDA Food Guide and the DASH
Eating Plan.
• Reduce the incidence of dental caries by practicing
good oral hygiene and consuming sugar- and starch-
containing foods and beverages less frequently.
SODIUM AND POTASSIUM
Key Recommendations
• Consume less than 2,300 mg (approximately
1 tsp of salt) of sodium per day.
• Choose and prepare foods with little salt. At the same
time, consume potassium-rich foods, such as fruits
and vegetables.
Key Recommendations for Specific Population Groups
•
Individuals with hypertension, blacks, and middle-aged
and older adults.
Aim to consume no more than 1,500
mg of sodium per day, and meet the potassium recom-
mendation (4,700 mg/day) with food.
ALCOHOLIC BEVERAGES
Key Recommendations
• Those who choose to drink alcoholic beverages should
do so sensibly and in moderation—defined as the
consumption of up to one drink per day for women
and up to two drinks per day for men.
• Alcoholic beverages should not be consumed by some
individuals, including those who cannot restrict their
alcohol intake, women of childbearing age who may
become pregnant, pregnant and lactating women, chil-
dren and adolescents, individuals taking medications
that can interact with alcohol, and those with specific
medical conditions.
• Alcoholic beverages should be avoided by individuals
engaging in activities that require attention, skill, or
coordination, such as driving or operating machinery.
FOOD SAFETY
Key Recommendations
• To avoid microbial foodborne illness:
• Clean hands, food contact surfaces, and fruits
and vegetables. Meat and poultry should
not
be washed or rinsed.
• Separate raw, cooked, and ready-to-eat foods
while shopping, preparing, or storing foods.
• Cook foods to a safe temperature to kill
microorganisms.
• Chill (refrigerate) perishable food promptly and
defrost foods properly.
• Avoid raw (unpasteurized) milk or any products
made from unpasteurized milk, raw or partially
cooked eggs or foods containing raw eggs, raw
or undercooked meat and poultry, unpasteurized
juices, and raw sprouts.
Key Recommendations for Specific Population Groups
•
Infants and young children, pregnant women, older
adults, and those who are immunocompromised.
Do
not eat or drink raw (unpasteurized) milk or any products
made from unpasteurized milk, raw or partially cooked
eggs or foods containing raw eggs, raw or undercooked
meat and poultry, raw or undercooked fish or shellfish,
unpasteurized juices, and raw sprouts.
•
Pregnant women, older adults, and those who are
immunocompromised:
Only eat certain deli meats and
frankfurters that have been reheated to steaming hot.
DIETARY GUIDELINES FOR AMERICANS, 2005
1
chapter
11
Background and Purpose of the
Dietary Guidelines for Americans
The Dietary Guidelines for Americans [Dietary Guidelines],
first published in 1980, provides science-based advice to
promote health and to reduce risk for chronic diseases
through diet and physical activity. The recommendations
contained within the Dietary Guidelines are targeted to the
general public over 2 years of age who are living in the
United States. Because of its focus on health promotion and
risk reduction, the Dietary Guidelines form the basis of
federal food, nutrition education, and information programs.
By law (Public Law 101-445, Title III, 7 U.S.C. 5301 et seq.),
the Dietary Guidelines is reviewed, updated if necessary,
and published every 5 years. The process to create the
Dietary Guidelines is a joint effort of the U.S. Department
of Health and Human Services (HHS) and the U.S.
Department of Agriculture (USDA) and has evolved to
include three stages.
In the first stage, an external scientific Advisory Committee
appointed by the two Departments conducted an analysis
of new scientific information and prepared a report summa
rizing its findings.
2
The Advisory Committee’s report was
made available to the public and Government agencies for
comment. The Committee’s analysis was the primary
resource for development of the Dietary Guidelines by the
Departments. A significant amount of the new scientific
information used by the Dietary Guidelines Advisory
Committee (DGAC) was based on the Dietary Reference
Intake (DRI) reports published since 2000 by the Institute
of Medicine (IOM), in particular the macronutrient report
and the fluid and electrolyte report.
During the second stage, the Departments jointly devel-
oped Key Recommendations based on the Advisory
Committee’s report and public and agency comments.
-
2
For more information about the process, summary data, and the resources used by the Advisory Committee, see the 2005 Dietary Guidelines Advisory Committee Report
(2005 DGAC Report) at
DIE TARY G UID E LI N E S FO R AM E RIC AN S, 2005
2
The Dietary Guidelines details these science-based policy
recommendations. Finally, in the third stage, the two
Departments developed messages communicating the
Dietary Guidelines to the general public.
Because of the three-part process used to develop and
communicate the 2005 Dietary Guidelines, this publication
and the report of the DGAC differ in scope and purpose
compared to reports for previous versions of the Guidelines.
The 2005 DGAC report is a detailed scientific analysis that
identifies key issues such as energy balance, the conse-
quences of a sedentary lifestyle, and the need to emphasize
certain food choices to address nutrition issues for the
American public. The scientific report was used to develop
the Dietary Guidelines jointly between the two Departments,
and this publication forms the basis of recommendations
that will be used by USDA and HHS for program and
policy development. Thus it is a publication oriented
toward policymakers, nutrition educators, nutritionists
and healthcare providers rather than to the general public,
as with previous versions of the Dietary Guidelines, and
contains more technical information.
New sections in the Dietary Guidelines, consistent with
its use for program development, are a glossary of terms
and appendixes with detailed information about the
USDA Food Guide and the Dietary Approaches to Stop
Hypertension (DASH) Eating Plan as well as tables listing
sources of some nutrients. Consumer messages have
been developed to educate the public about the Key
Recommendations in the Dietary Guidelines and will be
used in materials targeted for consumers separate from
this publication. In organizing the Dietary Guidelines for
the Departments, chapters 2 to 10 were given titles that
characterize the topic of each section, and the Dietary
Guidelines itself is presented as an integrated set of Key
Recommendations in each topic area.
These Key Recommendations are based on a preponder-
ance of the scientific evidence of nutritional factors that
are important for lowering risk of chronic disease and
promoting health. To optimize the beneficial impact of
these recommendations on health, the Guidelines should
be implemented in their entirety.
IMPORTANCE OF THE DIETARY GUIDELINES
FOR HEALTH PROMOTION AND DISEASE
PREVENTION
Good nutrition is vital to good health and is absolutely
essential for the healthy growth and development of
children and adolescents. Major causes of morbidity and
mortality in the United States are related to poor diet and
a sedentary lifestyle. Specific diseases and conditions
linked to poor diet include cardiovascular disease, hyper-
tension, dyslipidemia, type 2 diabetes, overweight and
obesity, osteoporosis, constipation, diverticular disease,
iron deficiency anemia, oral disease, malnutrition, and
some cancers. Lack of physical activity has been associ-
ated with cardiovascular disease, hypertension, overweight
and obesity, osteoporosis, diabetes, and certain cancers.
Furthermore, muscle strengthening and improving balance
can reduce falls and increase functional status among
older adults. Together with physical activity, a high-quality
diet that does not provide excess calories should enhance
the health of most individuals.
Poor diet and physical inactivity, resulting in an energy
imbalance (more calories consumed than expended), are
the most important factors contributing to the increase
in overweight and obesity in this country. Moreover, over-
weight and obesity are major risk factors for certain chronic
diseases such as diabetes. In 1999–2002, 65 percent of
U.S. adults were overweight, an increase from 56 percent
in 1988–1994. Data from 1999–2002 also showed that 30
percent of adults were obese, an increase from 23 percent
in an earlier survey. Dramatic increases in the prevalence
of overweight have occurred in children and adolescents
of both sexes, with approximately 16 percent of children
and adolescents aged 6 to 19 years considered to be over-
weight (1999–2002).
3
In order to reverse this trend, many
Americans need to consume fewer calories, be more
active, and make wiser choices within and among food
groups. The Dietary Guidelines provides a framework to
promote healthier lifestyles (see ch. 3).
Given the importance of a balanced diet to health, the
intent of the Dietary Guidelines is to summarize and
synthesize knowledge regarding individual nutrients and
3
Hedley AA, Ogden CL, Johnson CL, Carroll MD, Curtin LR, Flegal KM. Prevalence of overweight and obesity among U.S. children, adolescents, and adults, 1999-2002. Journal of the American Medical
Association (JAMA) 291(23):2847-2850, 2004.
DIE TARY G UID E LI N E S FO R AM E RIC AN S, 2005
3
food components into recommendations for an overall
pattern of eating that can be adopted by the general public.
These patterns are exemplified by the USDA Food Guide
and the DASH Eating Plan (see ch. 2 and app. A). The
Dietary Guidelines is applicable to the food preferences
of different racial/ethnic groups, vegetarians, and other
groups. This concept of balanced eating patterns should
be utilized in planning diets for various population groups.
There is a growing body of evidence which demonstrates
that following a diet that complies with the Dietary
Guidelines may reduce the risk of chronic disease.
Recently, it was reported that dietary patterns consistent
with recommended dietary guidance were associated
with a lower risk of mortality among individuals age 45
years and older in the United States.
4
The authors of the
study estimated that about 16 percent and 9 percent of
mortality from any cause in men and women, respectively,
could be eliminated by the adoption of desirable dietary
behaviors. Currently, adherence to the Dietary Guidelines
is low among the U.S. population. Data from USDA illustrate
the degree of change in the overall dietary pattern of
Americans needed to be consistent with a food pattern
encouraged by the Dietary Guidelines (fig. 1).
A basic premise of the Dietary Guidelines is that nutrient
needs should be met primarily through consuming foods.
Foods provide an array of nutrients (as well as phyto-
chemicals, antioxidants, etc.) and other compounds that
may have beneficial effects on health. In some cases, forti-
fied foods may be useful sources of one or more nutrients
that otherwise might be consumed in less than recom-
mended amounts. Supplements may be useful when they
fill a specific identified nutrient gap that cannot or is not
otherwise being met by the individual’s intake of food.
Nutrient supplements cannot replace a healthful diet.
Individuals who are already consuming the recommended
amount of a nutrient in food will not achieve any addi-
tional health benefit if they also take the nutrient as
a supplement. In fact, in some cases, supplements and
fortified foods may cause intakes to exceed the safe levels
of nutrients. Another important premise of the Dietary
Guidelines is that foods should be prepared and handled
in such a way that reduces risk of foodborne illness.
USES OF THE DIETARY GUIDELINES
The Dietary Guidelines is intended primarily for use by
policymakers, healthcare providers, nutritionists, and
nutrition educators. While the Dietary Guidelines was
developed for healthy Americans 2 years of age and older,
where appropriate, the needs of specific population groups
have been addressed. In addition, other individuals may
find this report helpful in making healthful choices. As
noted previously, the recommendations contained within
the Dietary Guidelines will aid the public in reducing their
risk for obesity and chronic disease. Specific uses of the
Dietary Guidelines include:
Development of Educational Materials and
Communications.
The information in the Dietary Guidelines is useful for the
development of educational materials. For example, the
federal dietary guidance-related publications are required
by law to be based on the Dietary Guidelines. In addition,
this publication will guide the development of messages
to communicate the Dietary Guidelines to the public.
Finally, the USDA Food Guide, the food label, and Nutrition
Facts Panel provide information that is useful for imple-
menting the key recommendations in the Dietary Guidelines
and should be integrated into educational and communi-
cation messages.
Development of Nutrition-Related Programs.
The Dietary Guidelines aids policymakers in designing
and implementing nutrition-related programs. The Federal
Government bases its nutrition programs, such as the
National Child Nutrition Programs or the Elderly Nutrition
Program, on the Dietary Guidelines.
Development of Authoritative Statements.
The Dietary Guidelines has the potential to provide
authoritative statements as provided for in the Food
and Drug Administration Modernization Act (FDAMA).
Because the recommendations are interrelated and mutu-
ally dependent, the statements in this publication should
be used together in the context of an overall healthful
diet. Likewise, because the Dietary Guidelines contains
discussions about emerging science, only statements
included in the Executive Summary and the highlighted
boxes entitled “Key Recommendations,” which reflect the
preponderance of scientific evidence, can be used for
identification of authoritative statements.
4
Kant AK, Graubard BI, Schatzkin A. Dietary patterns predict mortality in a national cohort: The national health interview surveys, 1987 and 1992. Journal of Nutrition (J Nutr) 134:1793-1799, 2004.
DIE TARY G UID E LI N E S FO R AM E RIC AN S, 2005
4
DIETARY GUIDELINES FOR AMERICANS, 2005
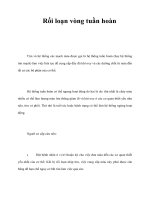
FIGURE 1. Percent Increase or Decrease From Current Consumption (Zero Line) to Recommended Intakes
a,b
A graphical depiction of the degree of change in average daily food consumption by Americans that would be needed to be consistent with the food
patterns encouraged by the Dietary Guidelines for Americans. The zero line represents average consumption levels from each food group or subgroup by
females 31 to 50 years of age and males 31 to 50 years of age. Bars above the zero line represent recommended increases in food group consumption,
while bars below the line represent recommended decreases.
Actual change from consumption to recommended intakes:
Females
+0.8 cups +0.9 cups +0.1 oz +0.4 oz +1.6 cups +0.4 g
Males
+1.2 cups +0.9 cups -1.0 oz -1.4 oz +1.2 cups -4.2 g
Fruit
Group
Vegetable
Group
Milk
Group
Meat & Bean
Group
Grain
Group
Oils
Percent change from current consumption
Females 31-50 (1800 calories)
Males 31-50 (2200 calories)
Food Groups
and Oils
350
400
300
250
200
150
100
50
0
-50
Dark green Orange Legumes
Vegetables Grains Discretionary Calories
Starchy Other Whole
grains
Enriched
grains
Solid
fats
Added
sugars
Percent change from current consumption
Females 31-50 (1800 calories)
Males 31-50 (2200 calories)
Subgroups,
Solid Fats, and
Added Sugars
Actual change from consumption to recommended intakes:
Females
Males
+0.3 cups
+0.3 cups
+0.2 cups
+0.2 cups
+0.3 cups
+0.2 cups
-0.1 cups
+0.2 cups
+0.1 cups
+0.0 cups
+2.2 oz
+2.6 oz
-2.1 oz
-3.6 oz
-18 g
-27 g
-14 tsp
-18 tsp
-100
0
400
-50
350
300
250
200
150
100
50
0
a
USDA Food Guide in comparison to National Health and Nutrition Examination Survey 2001-2002 consumption data.
b
Increases in amounts of some food groups are offset by decreases in amounts of solid fats (i.e., saturated and trans fats) and added sugars so that total calorie intake is at the recommended level.
5
chapter
22
Adequate Nutrients
Within Calorie Needs
OVERVIEW
Many Americans consume more calories than they need
without meeting recommended intakes for a number
of nutrients. This circumstance means that most people
need to choose meals and snacks that are high in
nutrients but low to moderate in energy content; that
is, meeting nutrient recommendations must go hand
in hand with keeping calories under control. Doing so
offers important benefits—normal growth and develop-
ment of children, health promotion for people of all ages,
and reduction of risk for a number of chronic diseases
that are major public health problems.
Based on dietary intake data or evidence of public health
problems, intake levels of the following nutrients may be
of concern for:
• Adults: calcium, potassium, fiber, magnesium, and
vitamins A (as carotenoids), C, and E,
• Children and adolescents: calcium, potassium, fiber,
magnesium, and vitamin E,
• Specific population groups (see below): vitamin B
12
,
iron, folic acid, and vitamins E and D.
At the same time, in general, Americans consume too
many calories and too much saturated and trans fats,
cholesterol, added sugars, and salt.
DIETARY GUIDELINES FOR AMERICANS, 2005
6
DISCUSSION
Meeting Recommended Intakes
Within Energy Needs
A basic premise of the Dietary Guidelines is that food
guidance should recommend diets that will provide all
the nutrients needed for growth and health. To this end,
food guidance should encourage individuals to achieve
the most recent nutrient intake recommendations of the
Institute of Medicine, referred to collectively as the Dietary
Reference Intakes (DRIs). Tables of the DRIs are provided
at
An additional premise of the Dietary Guidelines is that
the nutrients consumed should come primarily from foods.
Foods contain not only the vitamins and minerals that are
often found in supplements, but also hundreds of naturally
occurring substances, including carotenoids, flavonoids
and isoflavones, and protease inhibitors that may protect
against chronic health conditions. There are instances
when fortified foods may be advantageous, as identified
in this chapter. These include providing additional sources
of certain nutrients that might otherwise be present only
in low amounts in some food sources, providing nutrients
in highly bioavailable forms, and where the fortification
addresses a documented public health need.
Two examples of eating patterns that exemplify the Dietary
Guidelines are the DASH Eating Plan and the USDA Food
Guide. These two similar eating patterns are designed to
integrate dietary recommendations into a healthy way
to eat and are used in the Dietary Guidelines to provide
examples of how nutrient-focused recommendations can
be expressed in terms of food choices. Both the USDA
Food Guide and the DASH Eating Plan differ in important
ways from common food consumption patterns in the
United States. In general, they include:
• More dark green vegetables, orange vegetables, legumes,
fruits, whole grains, and low-fat milk and milk products.
• Less refined grains, total fats (especially cholesterol, and
saturated and trans fats), added sugars, and calories.
KEY RECOMMENDATIONS
• Consume a variety of nutrient-dense foods and bever-
ages within and among the basic food groups while
choosing foods that limit the intake of saturated and
trans
fats, cholesterol, added sugars, salt, and alcohol.
• Meet recommended intakes within energy needs by
adopting a balanced eating pattern, such as the USDA
Food Guide or the DASH Eating Plan.
Key Recommendations for Specific Population Groups
• People over age 50. Consume vitamin B
12
in its
crystalline form (i.e., fortified foods or supplements).
•
Women of childbearing age who may become pregnant.
Eat foods high in heme-iron and/or consume iron-rich
plant foods or iron-fortified foods with an enhancer of
iron absorption, such as vitamin C-rich foods.
•
Women of childbearing age who may become
pregnant and those in the first trimester of pregnancy.
Consume adequate synthetic folic acid daily (from
fortified foods or supplements) in addition to food
forms of folate from a varied diet.
•
Older adults, people with dark skin, and people
exposed to insufficient ultraviolet band radiation
(i.e., sunlight).
Consume extra vitamin D from
vitamin D-fortified foods and/or supplements.
Both the USDA Food Guide and the DASH Eating Plan
are constructed across a range of calorie levels to meet
the nutrient needs of various age and gender groups.
Table 1 provides food intake recommendations, and table 2
provides nutrient profiles for both the DASH Eating Plan
and the USDA Food Guide at the 2,000-calorie level. These
tables illustrate the many similarities between the two
eating patterns. Additional calorie levels are shown in
appendixes A-1 and A-2 for the USDA Food Guide and
the DASH Eating Plan. The exact amounts of foods in
these plans do not need to be achieved every day, but
on average, over time. Table 3 can aid in identification of
an individual’s caloric requirement based on gender, age,
and physical activity level.
DIETARY GUIDELINES FOR AMERICANS, 2005
7
Variety Among and Within Food Groups
Each basic food group
5
is the major contributor of at least
one nutrient while making substantial contributions of
many other nutrients. Because each food group provides
a wide array of nutrients in substantial amounts, it is
important to include all food groups in the daily diet.
Both illustrative eating patterns include a variety of nutrient-
dense foods within the major food groups. Selecting a
variety of foods within the grain, vegetable, fruit, and meat
groups may help to ensure that an adequate amount of
nutrients and other potentially beneficial substances are
consumed. For example, fish contains varying amounts of
fatty acids that may be beneficial in reducing cardiovas-
cular disease risk (see ch. 6).
Nutrient-Dense Foods
Nutrient-dense foods are those foods that provide substan-
tial amounts of vitamins and minerals (micronutrients)
and relatively few calories. Foods that are low in nutrient
density are foods that supply calories but relatively small
amounts of micronutrients, sometimes none at all. The
greater the consumption of foods or beverages that are
low in nutrient density, the more difficult it is to consume
enough nutrients without gaining weight, especially for
sedentary individuals. The consumption of added sugars,
saturated and trans fats, and alcohol provides calories
while providing little, if any, of the essential nutrients. (See
ch. 7 for additional information on added sugars, ch. 6 for
information on fats, and ch. 9 for information on alcohol.)
Selecting low-fat forms of foods in each group and forms
free of added sugars—in other words nutrient-dense
versions of foods—provides individuals a way to meet
their nutrient needs while avoiding the overconsumption
of calories and of food components such as saturated fats.
However, Americans generally do not eat nutrient-dense
forms of foods. Most people will exceed calorie recom-
mendations if they consistently choose higher fat foods
within the food groups—even if they do not have dessert,
sweetened beverages, or alcoholic beverages.
If only nutrient-dense foods are selected from each food
group in the amounts proposed, a small amount of calories
can be consumed as added fats or sugars, alcohol, or other
foods—the discretionary calorie allowance. Appendixes
A-2 and A-3 show the maximum discretionary calorie
allowance that can be accommodated at each calorie level
in the USDA Food Guide. Eating in accordance with the
USDA Food Guide or the DASH Eating Plan will also keep
intakes of saturated fat, total fat, and cholesterol within
the limits recommended in chapter 6.
Nutrients of Concern
The actual prevalence of inadequacy for a nutrient can
be determined only if an Estimated Average Requirement
(EAR) has been established and the distribution of usual
dietary intake can be obtained. If such data are not avail-
able for a nutrient but there is evidence for a public health
problem associated with low intakes, a nutrient might still
be considered to be of concern.
Based on these considerations, dietary intakes of the follow-
ing nutrients may be low enough to be of concern for:
• Adults: calcium, potassium, fiber, magnesium, and
vitamins A (as carotenoids), C, and E,
• Children and adolescents: calcium, potassium, fiber,
magnesium, and vitamin E,
• Specific population groups: vitamin B
12
, iron, folic acid,
and vitamins E and D.
…meeting nutrient
recommendations
must go hand in hand
with keeping calories
under control.
5
The food groups in the USDA Food Guide are grains; vegetables; fruits; milk, yogurt, and cheese; and meat, poultry, fish, dry beans, eggs, and nuts. Food groups in the DASH Eating Plan are grains
and grain products; vegetables; fruits; low-fat or fat-free dairy; meat, poultry, and fish; and nuts, seeds, and dry beans.
DIE TARY G UID E LI N E S FO R AM E RIC AN S, 2005
8
Efforts may be warranted to promote increased dietary
intakes of potassium, fiber, and possibly vitamin E, regard-
less of age; increased intakes of calcium and possibly
vitamins A (as carotenoids) and C and magnesium by
adults; efforts are warranted to increase intakes of calcium
and possibly magnesium by children age 9 years or older.
Efforts may be especially warranted to improve the dietary
intakes of adolescent females in general. Food sources of
these nutrients are shown in appendix B.
Low intakes of fiber tend to reflect low intakes of whole
grains, fruits, and vegetables. Low intakes of calcium
tend to reflect low intakes of milk and milk products. Low
intakes of vitamins A (as carotenoids) and C and magne-
sium tend to reflect low intakes of fruits and vegetables.
Selecting fruits, vegetables, whole grains, and low-fat and
fat-free milk and milk products in the amounts suggested
by the USDA Food Guide and the DASH Eating Plan will
provide adequate amounts of these nutrients.
Most Americans of all ages also need to increase their
potassium intake. To meet the recommended potassium
intake levels, potassium-rich foods from the fruit, vegetable,
and dairy groups must be selected in both the USDA Food
Guide and the DASH Eating Plan. Foods that can help
increase potassium intake are listed in table 5 (ch. 5) and
appendix B-1.
Most Americans may need to increase their consumption
of foods rich in vitamin E (α-tocopherol) while decreasing
their intake of foods high in energy but low in nutrients.
The vitamin E content in both the USDA Food Guide and
the DASH Eating Plan is greater than current consump-
tion, and specific vitamin E-rich foods need to be included
in the eating patterns to meet the recommended intake of
vitamin E. Foods that can help increase vitamin E intake
are listed in appendix B-2, along with their calorie content.
Breakfast cereal that is fortified with vitamin E is an
option for individuals seeking to increase their vitamin E
intake while consuming a low-fat diet.
In addition, most Americans need to decrease sodium
intake. The DASH Eating Plan provides guidance on how
to keep sodium intakes within recommendations. When
using the USDA Food Guide, selecting foods that are lower
in sodium than others is especially necessary to meet the
recommended intake level at calorie levels of 2,600/day and
above. Food choices that are lower in sodium are identi-
fied in chapter 8.
Considerations for Specific Population Groups
People Over 50 and Vitamin B
12
Although a substantial proportion of individuals over age
50 have reduced ability to absorb naturally occurring
vitamin B
12
, they are able to absorb the crystalline form.
Thus, all individuals over the age of 50 should be encour-
aged to meet their Recommended Dietary Allowance
(RDA) (2.4 µg/day) for vitamin B
12
by eating foods fortified
with vitamin B
12
such as fortified cereals, or by taking the
crystalline form of vitamin B
12
supplements.
Women and Iron
Based on blood values, substantial numbers of adolescent
females and women of childbearing age are iron deficient.
Thus, these groups should eat foods high in heme-iron
(e.g., meats) and/or consume iron-rich plant foods (e.g.,
spinach) or iron-fortified foods with an enhancer of iron
absorption, such as foods rich in vitamin C (e.g., orange
juice). Appendix B-3 lists foods that can help increase
iron intake and gives their iron and calorie content.
Women and Folic Acid
Since folic acid reduces the risk of the neural tube defects,
spina bifida, and anencephaly, a daily intake of 400 µg/day
of synthetic folic acid (from fortified foods or supplements
in addition to food forms of folate from a varied diet) is
recommended for women of childbearing age who may
become pregnant. Pregnant women should consume 600
µg/day of synthetic folic acid (from fortified foods or
supplements) in addition to food forms of folate from a
varied diet. It is not known whether the same level of
protection could be achieved by using food that is natu-
rally rich in folate.
Special Groups and Vitamin D
Adequate vitamin D status, which depends on dietary
intake and cutaneous synthesis, is important for optimal
calcium absorption, and it can reduce the risk for bone
DIETARY GUIDELINES FOR AMERICANS, 2005
9
loss. Two functionally relevant measures indicate that
optimal serum 25-hydroxyvitamin D may be as high as
80 nmol/L. The elderly and individuals with dark skin
(because the ability to synthesize vitamin D from exposure
to sunlight varies with degree of skin pigmentation) are at
a greater risk of low serum 25-hydroxyvitamin D concen-
trations. Also at risk are those exposed to insufficient
ultraviolet radiation (i.e., sunlight) for the cutaneous
production of vitamin D (e.g., housebound individuals).
For individuals within the high-risk groups, substantially
higher daily intakes of vitamin D (i.e., 25 µg or 1,000
International Units (IU) of vitamin D per day) have been
recommended to reach and maintain serum 25-hydroxyvit-
amin D values at 80 nmol/L. Three cups of vitamin D-
fortified milk (7.5 µg or 300 IU), 1 cup of vitamin D-fortified
orange juice (2.5 µg or 100 IU), and 15 µg (600 IU) of
supplemental vitamin D would provide 25 µg (1,000 IU)
of vitamin D daily.
Fluid
The combination of thirst and normal drinking behavior,
especially the consumption of fluids with meals, is usually
sufficient to maintain normal hydration. Healthy individ-
uals who have routine access to fluids and who are not
exposed to heat stress consume adequate water to meet
their needs. Purposeful drinking is warranted for individuals
who are exposed to heat stress or perform sustained
vigorous activity (see ch. 4).
Flexibility of Food Patterns for Varied Food Preferences
The USDA Food Guide and the DASH Eating Plan are
flexible to permit food choices based on individual and
cultural food preferences, cost, and availability. Both can
also accommodate varied types of cuisines and special
needs due to common food allergies. Two adaptations of
the USDA Food Guide and the DASH Eating Plan are:
Vegetarian Choices
Vegetarians of all types can achieve recommended
nutrient intakes through careful selection of foods.
These individuals should give special attention to their
intakes of protein, iron, and vitamin B12, as well as
calcium and vitamin D if avoiding milk products. In
addition, vegetarians could select only nuts, seeds, and
legumes from the meat and beans group, or they could
include eggs if so desired. At the 2,000-calorie level, they
could choose about 1.5 ounces of nuts and
2
/3 cup
legumes instead of 5.5 ounces of meat, poultry, and/or
fish. One egg,
1
/2 ounce of nuts, or
1
/4 cup of legumes is
considered equivalent to 1 ounce of meat, poultry, or fish in
the USDA Food Guide.
Substitutions for Milk and Milk Products
Since milk and milk products provide more than 70 percent
of the calcium consumed by Americans, guidance on other
choices of dietary calcium is needed for those who do not
consume the recommended amount of milk products.
Milk product consumption has been associated with
overall diet quality and adequacy of intake of many nutri-
ents, including calcium, potassium, magnesium, zinc, iron,
riboflavin, vitamin A, folate, and vitamin D. People may
avoid milk products because of allergies, cultural prac-
tices, taste, or other reasons. Those who avoid all milk
products need to choose rich sources of the nutrients
provided by milk, including potassium, vitamin A, and
magnesium in addition to calcium and vitamin D (see
app. B). Some non-dairy sources of calcium are shown in
appendix B-4. The bioavailability of the calcium in these
foods varies.
Those who avoid milk because of its lactose content may
obtain all the nutrients provided by the milk group by
using lactose-reduced or low-lactose milk products, taking
small servings of milk several times a day, taking the
enzyme lactase before consuming milk products, or eating
other calcium-rich foods. For additional information, see
appendixes B-4 and B-5 and NIH Publication No. 03-2751.
6
6
NIH Publication No. 03-2751, U.S. Department of Health and Human Services, National Institutes of Health, National Institute of Diabetes and Digestive and Kidney Diseases, March 2003. http://diges-
tive.niddk.nih.gov/ddiseases/pubs/lactoseintolerance/index.htm.
DIE TARY G UID E LI N E S FO R AM E RIC AN S, 2005
1
0
TABLE 1. Sample USDA Food Guide and the DASH Eating Plan at the 2,000-Calorie Level
a
Amounts of various food groups that are recommended each day or each week in the USDA Food Guide and in the DASH Eating Plan (amounts are daily
unless otherwise specified) at the 2,000-calorie level. Also identified are equivalent amounts for different food choices in each group. To follow either eating
pattern, food choices over time should provide these amounts of food from each group on average.
Food Groups and Subgroups USDA Food Guide Amount
b
DASH Eating Plan Amount Equivalent Amounts
Fruit Group
2 cups (4 servings) 2 to 2.5 cups (4 to 5 servings)
1
/
2 cup equivalent is:
•
1
/
2 cup fresh, frozen, or canned fruit
• 1 med fruit
•
1
/
4 cup dried fruit
• USDA:
1
/
2 cup fruit juice
• DASH:
3
/
4 cup fruit juice
Vegetable Group 2.5 cups (5 servings) 2 to 2.5 cups (4 to 5 servings)
1
/
2 cup equivalent is:
• Dark green vegetables 3 cups/week •
1
/
2 cup of cut-up raw or
• Orange vegetables 2 cups/week cooked vegetable
• Legumes (dry beans) 3 cups/week • 1 cup raw leafy vegetable
• Starchy vegetables 3 cups/week • USDA:
1
/
2 cup vegetable juice
• Other vegetables 6.5 cups/week • DASH:
3
/
4 cup vegetable juice
Grain Group 6 ounce-equivalents 7 to 8 ounce-equivalents 1 ounce-equivalent is:
• Whole grains
• Other grains
3 ounce-equivalents
3 ounce-equivalents
(7 to 8 servings) • 1 slice bread
• 1 cup dry cereal
•
1
/
2 cup cooked rice, pasta, cereal
• DASH: 1 oz dry cereal
(
1
/
2–1
1
/
4 cup depending
on cereal type—check label)
Meat and Beans Group 5.5 ounce-equivalents 6 ounces or less 1 ounce-equivalent is:
meat, poultry, fish • 1 ounce of cooked lean meats,
poultry, fish
4 to 5 servings per week
nuts, seeds, and dry beans
c
• 1 egg
• USDA:
1
/
4 cup cooked dry beans
or tofu, 1 Tbsp peanut butter,
1
/
2 oz nuts or seeds
• DASH: 1
1
/
2 oz nuts,
1
/
2 oz seeds,
1
/
2 cup cooked dry beans
Milk Group 3 cups 2 to 3 cups 1 cup equivalent is:
• 1 cup low-fat/fat-free milk, yogurt
• 1
1
/
2 oz of low-fat or
fat-free natural cheese
• 2 oz of low-fat or
fat-free processed cheese
Oils 24 grams (6 tsp) 8 to 12 grams (2 to 3 tsp)
1 tsp equivalent is:
• DASH: 1 tsp soft margarine
• 1 Tbsp low-fat mayo
• 2 Tbsp light salad dressing
• 1 tsp vegetable oil
Discretionary Calorie Allowance
• Example of distribution:
Solid fat
d
Added sugars
267 calories
18 grams
8 tsp
~2 tsp (5 Tbsp per week)
1 Tbsp added sugar equivalent is:
• DASH: 1 Tbsp jelly or jam
•
1
/
2 oz jelly beans
• 8 oz lemonade
a
All servings are per day unless otherwise noted. USDA vegetable subgroup amounts and amounts of DASH nuts, seeds, and dry beans are per week.
b
The 2,000-calorie USDA Food Guide is appropriate for many sedentary males 51 to 70 years of age, sedentary females 19 to 30 years of age, and for some other gender/age groups who are more
physically active. See table 3 for information about gender/age/activity levels and appropriate calorie intakes. See appendixes A-2 and A-3 for more information on the food groups, amounts, and
food intake patterns at other calorie levels.
c
In the DASH Eating Plan, nuts, seeds, and dry beans are a separate food group from meat, poultry, and fish.
d
The oils listed in this table are not considered to be part of discretionary calories because they are a major source of the vitamin E and polyunsaturated fatty acids, including the essential fatty acids, in
the food pattern. In contrast, solid fats (i.e., saturated and trans fats) are listed separately as a source of discretionary calories.
DIE TARY G UID E LI N E S FO R AM E RIC AN S, 2005
11
TABLE 2. Comparison of Selected Nutrients in the Dietary Approaches to Stop Hypertension (DASH) Eating Plan
a
,
the USDA Food Guide
b
, and Nutrient Intakes Recommended Per Day by the Institute of Medicine (IOM)
c
Estimated nutrient levels in the DASH Eating Plan and the USDA Food Guide at the 2,000-calorie level, as well as the nutrient intake levels recom-
mended by the Institute of Medicine for females 19—30 years of age.
Nutrient DASH Eating Plan
(2,000 kcals)
USDA Food Guide
(2,000 kcals)
IOM Recommendations
for Females 19 to 30
Protein, g 108 91 RDA: 46
Protein, % kcal 21 18 AMDR: 10—35
Carbohydrate, g 288 271 RDA: 130
Carbohydrate, % kcal 57 55 AMDR: 45—65
Total fat, g 48 65 —
Total fat, % kcal 22 29 AMDR: 20—35
Saturated fat, g 10 17 —
Saturated fat, % kcal 5 7.8 ALAP
d
Monounsaturated fat, g 21 24 —
Monounsaturated fat, % kcal 10 11 —
Polyunsaturated fat, g 12 20 —
Polyunsaturated fat, % kcal 5.5 9.0 —
Linoleic acid, g 11 18 AI: 12
Alpha-linolenic acid, g 1 1.7 AI: 1.1
Cholesterol, mg 136 230 ALAP
d
Total dietary fiber, g 30 31 AI: 28
e
Potassium, mg 4,706 4,044 AI: 4,700
Sodium, mg 2,329
f
1,779 AI: 1,500, UL: <2,300
Calcium, mg 1,619 1,316 AI: 1,000
Magnesium, mg 500 380 RDA: 310
Copper, mg 2 1.5 RDA: 0.9
Iron, mg 21 18 RDA: 18
Phosphorus, mg 2,066 1,740 RDA: 700
Zinc, mg 14 14 RDA: 8
Thiamin, mg 2.0 2.0 RDA: 1.1
Riboflavin, mg 2.8 2.8 RDA: 1.1
Niacin equivalents, mg 31 22 RDA: 14
Vitamin B
6
, mg 3.4 2.4 RDA: 1.3
Vitamin B
12
, μg 7.1 8.3 RDA: 2.4
Vitamin C, mg 181 155 RDA: 75
Vitamin E (AT)
g
16.5 9.5 RDA: 15.0
Vitamin A, μg (RAE)
h
851 1,052 RDA: 700
a
DASH nutrient values are based on a 1-week menu of the DASH Eating Plan. NIH publication No. 03-4082. www.nhlbi.nih.gov.
b
USDA nutrient values are based on population-weighted averages of typical food choices within each food group or subgroup.
c
Recommended intakes for adult females 19—30; RDA = Recommended Dietary Allowance; AI = Adequate Intake; AMDR = Acceptable Macronutrient Distribution Range; UL = Upper Limit.
d
As Low As Possible while consuming a nutritionally adequate diet.
e
Amount listed is based on 14 g dietary fiber/1,000 kcal.
f
The DASH Eating Plan also can be used to follow at 1,500 mg sodium per day.
g
AT = mg d-α-tocopherol
h
RAE = Retinol Activity Equivalents
DIETARY GUIDELINES FOR AMERICANS, 2005
1
2
TABLE 3. Estimated Calorie Requirements (in Kilocalories) for Each Gender and Age Group
at Three Levels of Physical Activity
a
Estimated amounts of calories needed to maintain energy balance for various gender and age groups at three different levels of physical activity. The esti-
mates are rounded to the nearest 200 calories and were determined using the Institute of Medicine equation.
b,c,d
Activity Level
Gender Age (years)
b
Sedentary
c
Moderately Active
Active
d
Child 2–3
1,000
e
1,000–1,400
e
1,000–1,400
Female
4–8
9–13
14–18
19–30
31–50
51+
1,200
1,600
1,800
2,000
1,800
1,600
1,400–1,600
1,600–2,000
2,000
2,000–2,200
2,000
1,800
1,400–1,800
1,800–2,200
2,400
2,400
2,200
2,000–2,200
Male 4–8
9–13
14–18
19–30
31–50
51+
1,400
1,800
2,200
2,400
2,200
2,000
1,400–1,600
1,800–2,200
2,400–2,800
2,600–2,800
2,400–2,600
2,200–2,400
1,600–2,000
2,000–2,600
2,800–3,200
3,000
2,800–3,000
2,400–2,800
a
These levels are based on Estimated Energy Requirements (EER) from the Institute of Medicine Dietary Reference Intakes macronutrients report, 2002, calculated by gender, age, and activity level for
reference-sized individuals. “Reference size,” as determined by IOM, is based on median height and weight for ages up to age 18 years of age and median height and weight for that height to give a
BMI of 21.5 for adult females and 22.5 for adult males.
b
Sedentary means a lifestyle that includes only the light physical activity associated with typical day-to-day life.
c
Moderately active means a lifestyle that includes physical activity equivalent to walking about 1.5 to 3 miles per day at 3 to 4 miles per hour, in addition to the light physical activity associated with
typical day-to-day life
d
Active means a lifestyle that includes physical activity equivalent to walking more than 3 miles per day at 3 to 4 miles per hour, in addition to the light physical activity associated with typical day-to-
day life.
e
The calorie ranges shown are to accommodate needs of different ages within the group. For children and adolescents, more calories are needed at older ages. For adults, fewer calories are needed at
older ages.
DIE TARY G UID E LI N E S FO R AM E RIC AN S, 2005
1
3
chapter
33
Weight Management
OVERVIEW
The prevalence of obesity in the United States has
doubled in the past two decades. Nearly one-third of
adults are obese, that is, they have a body mass index
(BMI ) of 30 or greater. One of the fastest growing
segments of the population is that with a BMI
>
30 with
–
accompanying comorbidities. Over the last two decades,
the prevalence of overweight among children and
adolescents has increased substantially; it is estimated
that as many as 16 percent of children and adolescents
are overweight, representing a doubling of the rate
among children and tripling of the rate among adoles-
cents. A high prevalence of overweight and obesity is
of great public health concern because excess body fat
leads to a higher risk for premature death, type 2
DIETARY GUIDELINES FOR AMERICANS, 2005
diabetes, hypertension, dyslipidemia, cardiovascular
disease, stroke, gall bladder disease, respiratory dysfunc-
tion, gout, osteoarthritis, and certain kinds of cancers.
Ideally, the goal for adults is to achieve and maintain
a body weight that optimizes their health. However, for
obese adults, even modest weight loss (e.g., 10 pounds)
has health benefits, and the prevention of further weight
gain is very important. For overweight children and
adolescents, the goal is to slow the rate of weight gain
while achieving normal growth and development.
Maintaining a healthy weight throughout childhood
may reduce the risk of becoming an overweight or obese
adult. Eating fewer calories while increasing physical
activity are the keys to controlling body weight.
1
4
While overweight and obesity are currently significant
public health issues, not all Americans need to lose weight.
People at a healthy weight should strive to maintain their
weight, and underweight individuals may need to increase
their weight.
DISCUSSION
Overweight and obesity in the United States among adults
and children has increased significantly over the last two
decades. Those following typical American eating and
activity patterns are likely to be consuming diets in excess
of their energy requirements. However, caloric intake is
only one side of the energy balance equation. Caloric
expenditure needs to be in balance with caloric intake to
maintain body weight and must exceed caloric intake to
achieve weight loss (see tables 3 and 4). To reverse the
trend toward obesity, most Americans need to eat fewer
calories, be more active, and make wiser food choices.
Prevention of weight gain is critical because while the
behaviors required are the same, the extent of the behav-
iors required to lose weight makes weight loss more
challenging than prevention of weight gain. Since many
adults gain weight slowly over time, even small decreases
in calorie intake can help avoid weight gain, especially if
accompanied by increased physical activity. For example,
for most adults a reduction of 50 to 100 calories per day
may prevent gradual weight gain, whereas a reduction
of 500 calories or more per day is a common initial goal
in weight-loss programs. Similarly, up to 60 minutes of
moderate- to vigorous-intensity physical activity per day
may be needed to prevent weight gain, but as much as 60
to 90 minutes of moderate-intensity physical activity per
day is recommended to sustain weight loss for previously
overweight people. It is advisable for men over age 40,
women over age 50, and those with a history of chronic
diseases such as heart disease or diabetes to consult with
a healthcare provider before starting a vigorous exercise
program. However, many people can safely increase their
physical activity without consulting a healthcare provider.
7
KEY RECOMMENDATIONS
• To maintain body weight in a healthy range, balance
calories from foods and beverages with calories
expended.
• To prevent gradual weight gain over time, make small
decreases in food and beverage calories and increase
physical activity.
Key Recommendations for Specific Population Groups
• Those who need to lose weight. Aim for a slow, steady
weight loss by decreasing calorie intake while main-
taining an adequate nutrient intake and increasing
physical activity.
• Overweight children. Reduce the rate of body weight
gain while allowing growth and development. Consult
a healthcare provider before placing a child on a
weight-reduction diet.
• Pregnant women. Ensure appropriate weight gain as
specified by a healthcare provider.
• Breastfeeding women. Moderate weight reduction is
safe and does not compromise weight gain of the
nursing infant.
• Overweight adults and overweight children with
chronic diseases and/or on medication. Consult a
healthcare provider about weight loss strategies prior
to starting a weight-reduction program to ensure
appropriate management of other health conditions.
Monitoring body fat regularly can be a useful strategy for
assessing the need to adjust caloric intake and energy
expenditure. Two surrogate measures used to approximate
body fat are BMI (adults and children) and waist circum-
ference (adults).
8
BMI is defined as weight in kilograms
divided by height, in meters, squared. For adults, weight
status is based on the absolute BMI level (fig. 2). For
children and adolescents, weight status is determined by
the comparison of the individual’s BMI with age- and
gender-specific percentile values (see fig. 3 for a sample
boys’ growth curve). Additional growth curves can be
7
For more information on recommendations to consult a healthcare provider, see Physical Activity and Public Health—A Recommendation from the Centers for Disease Control and Prevention and the
American College of Sports Medicine, JAMA 273:402-407, 1995.
8
NIH Publication Number 00-4084, The Practical Guide: Identification, Evaluation and Treatment of Overweight and Obesity in Adults, U.S. Department of Health and Human Services, National
Institutes of Health, National Heart, Lung, and Blood Institute, October 2000.
DIE TARY G UID E LI N E S FO R AM E RIC AN S, 2005