Tài liệu Time trends in leisure time physical activity and physical fitness in elderly people: 20 year followup of the Spanish population national health survey (1987-2006) docx
Bạn đang xem bản rút gọn của tài liệu. Xem và tải ngay bản đầy đủ của tài liệu tại đây (1.07 MB, 11 trang )
Palacios-Ceña et al. BMC Public Health 2011, 11:799
/>
RESEARCH ARTICLE
Open Access
Time trends in leisure time physical activity and
physical fitness in elderly people: 20 year followup of the Spanish population national health
survey (1987-2006)
Domingo Palacios-Ceña1,3*, Cristina Alonso-Blanco1, Rodrigo Jiménez-Garcia2, Valentin Hernández-Barrera2,
Pilar Carrasco-Garrido2, Elena Pileño-Martinez1 and Cesar Fernández-de-las-Peñas4
Abstract
Background: To estimate trends in leisure time physical activity and physical fitness between 1987-2006 in older
Spanish people.
Methods: We analyzed data collected from the Spanish National Health Surveys conducted in 1987 (n = 29,647),
1993 (n = 20,707), 1995-1997 (n = 12,800), 2001 (n = 21,058), 2003 (n = 21,650), and 2006 (n = 29,478). The number
of subjects aged ≥ 65 years included in the current study was 29,263 (1987: n = 4,958-16.7%; 1993: n = 3,75117.8%; 1995-97: n = 2,229-17.4%; 2001: n = 4,356-20.7%; 2003: 6,134-28.3%; 2006: 7,835-26.5%). Main variables
included leisure-time physical activity and physical fitness. We analyzed socio-demographic characteristics, self-rated
health status, lifestyle habit and co-morbid conditions using multivariate logistic regression models.
Results: Women exhibited lower prevalence of leisure time physical activity and physical fitness compared to men
(P < 0.05). The multivariate analysis for time trends found that practising leisure time physical activity increased
from 1987 to 2006 (P < 0.001). Variables associated with a lower likelihood of practicing leisure time physical
activity were: age ≥ 80 years old, ≥ 2 co-morbid chronic conditions, and obesity. Variables associated with lower
physical fitness included: age ≥ 80 years, worse self rated health; ≥ 2 medications (only for walking), and obesity.
Conclusions: We found an increase in leisure time physical activity in the older Spanish population. Older age,
married status, co-morbid conditions, obesity, and worse self-perceived health status were associated with lower
activity. Identification of these factors can help to identify individuals at risk for physical inactivity.
Background
In recent years, there has been an increase of aging in
the society [1]. The aging of the population can lead to
an increase in the number of individuals at risk for
chronic diseases [2]. In an article from the Center for
Disease Control and Prevention’s Healthy Aging Network, physical activity (PA) was considered one key element for determining health status [3]. Recent
guidelines include PA recommendations for older people [4] because regular PA can provide health benefits,
even when it is initiated later in life [5]. In fact, evidence
* Correspondence:
1
Department of Health Science II, Universidad Rey Juan Carlos, Madrid, Spain
Full list of author information is available at the end of the article
suggests that PA is associated with more years of life,
self-perceived healthy life, years without impairment in
daily live activities [6], lower rates of functional decline
[7], lower risk of mortality [8,9], increased longevity
[6,10], reduced risk of type 2 diabetes [11], and better
quality of life [12].
Physical activity is defined as any bodily movement
produced by skeletal muscles that result in energy
expenditure [13]. Nevertheless, physical activity is a
broad term that encompasses both leisure-time activity
(sports, exercise) [13] and activities of daily life [13,14].
Leisure time physical activity (LTPA) refers to conditioning exercise or sports not related to regular work
activities [13,15]. Walking is the most common form of
© 2011 Palacios-Ca et al; licensee BioMed Central Ltd. This is an Open Access article distributed under the terms of the Creative
Commons Attribution License ( which permits unrestricted use, distribution, and
reproduction in any medium, provided the original work is properly cited.
Palacios-Ceña et al. BMC Public Health 2011, 11:799
/>
physical activity and is recommended for all ages
[16-18]. Physical fitness is defined as a set of attributes
that people have or achieve that relates to the ability to
perform physical activity [13]. In fact, different studies
have used walking and walking up-stairs to evaluate
physical fitness of older people [19,20]. However, PA
research has mainly focused on middle-aged and the
elderly combined [17,21-28]. In fact, few studies have
investigated PA only in older people [14,16,29-33].
Studies conducted in the USA [28], Australia [21],
England [27] and Scotland [22] had reported a trend
towards an increased PA in individuals older than 60
years of age. In fact, the increase in PA has been found
to be higher in people older than 65 years than in middle-aged population [17,25,33]. Nevertheless, some
authors have suggested the opposite, that older people
report lower PA [21,23,26]. In line with this hypothesis,
the Center for Disease Control [24] reported that the
prevalence of LTPA declined from 29.8% in 1994 to
23.7% in 2007 in the United States.
In Spain, more than 40% of older adults are sedentary
[34-37]. Although the percentage of people who practice
LTPA has increased [36], more information is needed to
understand factors that facilitate or inhibit older people
tendency to engage in LTPA. Previous studies conducted in older adults have reported that important
variables for PA include those potentially handled from
public health and social-educational policies: gender
[16,29,33], age [16,22,29], educational level [14,32,33],
monetary income [14,17,32], marital status [29], co-morbid diseases [16,17,29], alcohol consumption [16,17],
smoking [17,29], self-perceive health [30,33], and obesity
[14,22,31].
No previous study has examined the time trends of
physical activity in the last 20 years in older Spanish
people. Therefore, the current study examines time
trends in prevalence of PA for adults aged 65 and over
using Spanish National Health Surveys (SNHS) conducted in the period 1987-2006. The objectives of this
study were: 1) to describe the prevalence of LTPA and
physical fitness among the Spanish elderly population in
the period 1987-2006; 2) to determine socio-demographic features, self-perceived health status, co-morbidity, and lifestyle-related habits associated with LTPA
and physical fitness in older people; and, 3) to analyze
time trends in prevalence of LTPA and physical fitness
in the period 1987-2006 in Spanish older people.
Methods
Ethical aspects
As this analysis was conducted on a de-identified, public-use dataset it was not necessary to have the approval
of an ethics committee according to Spanish legislation.
Page 2 of 11
The Spanish National Health Surveys (SNHS)
We conducted a cross-sectional study using individualized data obtained from the SNHS done in 1987, 1993,
1995, 1997, 2001, 2003, and 2006. The SNHS is an
ongoing, home-based personal interview examining a
national representative sample of non-institutionalized
population residing in main family dwellings (households) of Spain and is mainly performed by the Ministry
of Health and Consumer Affairs and the National Statistics Institute (Instituto Nacional Estadística-INE). The
SNHS uses a multistage cluster sampling, with proportional random selection of primary and secondary sampling units (towns and sections, respectively), with the
final units (individuals) being selected by means of random routes and sex- and age-based quotas.
Surveyors were previously trained about basic communication skills, procedures and the used questionnaire.
Informed consent was signed by all participants before
they answered the survey. In order to meet the surveys’
stated aim of being able to furnish estimates with a certain degree of reliability at both national and regional
levels the following samples of adult aged 15 years and
older were selected in the SNHS: 29,647 in 1987; 20,707
in 1993; 21,058 in 2001; 21,650 in 2003; and 29,478 in
2006. Surveys conducted in 1995 and 1997 were based
on smaller sample sizes (N = 6,400), therefore these two
databases were joined and analyzed together. The number of subjects aged ≥ 65 years included in the study
along the entire period was 29,263 (1987: n = 4,95816.7%; 1993: n = 3,751-17.8%; 1995-97: n = 2,229-17.4%;
2001: n = 4,356-20.7%; 2003: 6,134-28.3%; 2006: 7,83526.5%). More details about the SNHS methodology are
described elsewhere [38,39].
For the purpose of the current study, we included
answers from adults aged 65 years and older from these
7 SNHS. The variables included in the current study
were created on the basis of several questions included
in the questionnaires and identical in all surveys. The
dependent variables were: 1, LTPA, which was collected
using the following question: “Do you practice any physical activity during your leisure time?”, with 2 possible
answers: “none” or “once a month or more”, and 2, physical daily fitness, which was assessed with 2 questions:
“Can you walk up 10 steps without help?” and, “Can
you keep walking for one hour without rest?.” The
answer to both questions could be “yes” or “no”. These
last two questions were first collected within the 1993
survey.
We also analyzed socio-demographic characteristics
such as age (65 to 79 years, 80 years and older), marital
status (married or living as a couple, unmarried/widow/
divorced), and educational level (no study, primary education completed, secondary education, or more).
Palacios-Ceña et al. BMC Public Health 2011, 11:799
/>
Self-perceived health status was assessed with the following question: “How did you self-perceive your health
status over the previous 12 months?” Subjects described
their health status as very good, good, fair, poor, very
poor. The answer was dichotomized into very good/
good or fair/poor/very poor self-perceived health status.
We also collected the number of medical doctor diagnoses of co-morbid chronic conditions (high blood pressure, diabetes, chronic heart disease, chronic bronchitis,
emphysema, or asthma) as follows: none, one, two, or
more. The number of prescribed medications for any of
these chronic conditions was also categorized as none,
one, two or more. Body mass index (BMI) was calculated from self-reported body weight and height. Individuals with a BMI ≥ 30 were classified as obese, those
with BMI between 25 and 29.9 were classified as overweight and those with BMI < 25 were considered to
have normal weight. Individuals with BMI < 18.5 or
incomplete data on height and weight were excluded for
the analysis.
Regarding lifestyle habits, smoking habits differentiated between current smokers, non-smokers or exsmokers. Finally, sleep habits were divided into subjects
sleeping > 8 hours per day and those sleeping < 8 hours
per day.
Statistical analysis
In this study we analyzed physical activity and physical
fitness separately for men and women and we excluded
respondents with missing data for any outcome. We calculated descriptive measures for all variables of interest
by aged-group and SNHS. Second, we compared the
reported prevalence for the dependent variables and age
group according to the SNHS. Third, we fit logistic
regression models by gender to assess factors independently associated for each dependent variable. Finally, to
evaluate the time trend across the period 1987-2006,
adjusted odds ratios (ORs) with their confidence intervals were estimated using multivariate logistic regression
models. Models were initially adjusted by age and by
those variables that yield significant associations within
the bivariate analysis. We assessed significant interaction
terms in fully adjusted models; for significant effects, we
stratified the fully adjusted models by the relevant factor. The estimates were made using the “svy” (survey
command) functions of the STATA program, which
allowed us to incorporate the study design and weights
in all our statistical calculations. Statistical significance
was established at P < 0.05 (two-tailed P values).
Results
The mean age increased significantly from 72.3 to 74.8
years for women and from 72.2 to 74.5 years for men
across the study period (P < 0.05). Women were slightly,
Page 3 of 11
but significantly older than men in all surveys (P < 0.05).
Tables 1, 2 summarize the distribution by socio-demographic characteristics and health related variables
among women and men according to the SNHS conducted (1987 2006).
Among women, the prevalence of those married,
higher education, higher number of chronic conditions
and medications, obesity and smoking habit significantly
increased along the period 1987-2006 (P < 0.01). Among
men, the evolution was very similar to women except
for smoking habits that decreased from 33.8% to 15.4%
(P < 0.01).
Time trends for LTPA, capacity to walk up ten steps
without help and to walk for one hour without rest by
aged-group and gender are summarized in Table 3.
Overall, women exhibited lower prevalence of LTPA
and physical fitness (in both variables) as compared to
men in all surveys (P < 0.01). In both gender, the prevalence for all dependent variables were always higher in
the younger aged group. The highest prevalence of
LTPA was found for both genders in the SNHS conducted in 2006, with 54.6% for women, and 69.6% for
men, respectively (P < 0.05).
Crude time trends analysis by aged-group and gender
revealed an increase in the prevalence of LTPA over
time among women and men in all aged-groups (P <
0.001). On the contrary, no significant changes for physical fitness during the time period by gender or agedgroup were found (P > 0.05).
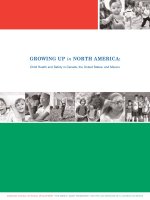
The multivariate analysis for time trends in women
found that LTPA increased significantly from 1987 to
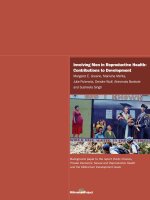
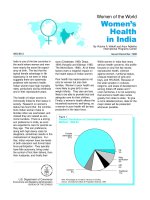
2006 (P < 0.001, Figure 1). In addition, time trends
(1993-2006) for the variable walking for one hour, but
not for walking 10 steps without help (Figure 2) also
exhibited a significant improvement (P < 0.01, Figure 3).
The results of the multivariate analysis to estimate time
trends and associated factors for older women are summarized in the table 4. Further, variables significantly
associated with a lower likelihood of reporting LTPA
among women were: age ≥ 80 years, ≥ 2 co-morbid
chronic conditions, and obesity. Variables associated
with not being able to walk up ten steps or walking for
one hour included: age ≥ 80 years, worse self-rated
health, ≥ 2 medications (only for walking for one hour)
and again obesity.
Among men, LTPA has also significantly increased
from 1987 to 2006 (P < 0.001, Figure 1), but no significant changes for physical fitness were observed (Figures
2, 3). The results of the multivariate analysis to estimate
time trends and associated factors for older men are
found within table 5. Factors associated to less practicing LTPA in men were: age ≥ 80 years, being married,
and obesity. Variables associated with worse physical fitness among men were the same as for women: age 80
Palacios-Ceña et al. BMC Public Health 2011, 11:799
/>
Page 4 of 11
Table 1 Frequencies Statistic for WOMEN: Spanish National Health Surveys (SNHS) 1987, 1993, 1995-7, 2001, 2003 and
2006
SNHS 1987
SNHS 95-97
SNHS 2001
SNHS 2003
SNHS 2006
N = 2,137
N = 1,303
N = 2,494
N = 3,830
N = 5,022
72.3 (0.15)
Age Mean (SE)+
SNHS 1993
N = 2,846
74.3 (0.23)
72.6 (0.17)
73.0 (0.14)
74.7 (0.16)
74.8 (0.14)
Age group+
65-79
85.5
84.5
84.9
83.6
76.2
75.5
≥ 80
14.5
15.5
15.1
16.4
23.8
24.5
Marital status*
Unmarried/widow/divorced
54.0
47.9
49.8
47.5
50.9
49.4
Married or living with couple
46.0
52.1
50.2
52.5
49.1
50.6
42.0
Educational level*
72.9
49.7
38.9
26.5
42.0
21.7
42.7
55.2
67.2
46.3
45.2
Secondary education or more
Self rated health
No studies
Primary education completed
5.4
7.6
5.9
6.3
11.7
12.8
34.6
39.4
37.0
36.5
33.0
33.1
65.4
60.6
63.0
63.5
67.0
66.9
None
40.8
41.3
37.6
32.9
26.8
19.0
1
Nª of chronic conditions*
Very good/good
Fair/poor/very poor
31.8
33.0
32.3
33.2
33.2
32.7
48.3
≥2
27.4
25.7
30.1
33.9
40.0
None
26.7
26.1
19.0
15.4
9.1
6.5
1
Number of medications*
34.5
33.6
33.1
31.2
21.4
14.7
≥2
47.9
53.4
69.5
78.8
39.1
49.7
31.2
35.2
31.5
41.9
43.4
31.4
41.8
42.3
42.4
16.5
17.5
18.9
27.0
22.5
26.1
Smoker
1.9
3.9
1.7
2.2
1.7
3.1
Ex Smoker
2.7
2.5
2.4
2.9
2.9
4.5
Non Smoker
95.4
93.6
95.9
94.9
95.4
92.4
<8
45.8
48.2
41.9
42.8
44.8
46.8
≥8
Sleep habits (hours day)
40.3
41.6
Obesity
Smoking habits*
38.8
Normal
Overweight
BMI*
54.2
51.8
58.1
57.2
55.2
53.2
Data are expressed as percentages (%)
+
Significant differences between SNHS/*Significant differences between SNHS (adjusted by age)
years or over, worse self-rated health, ≥ 2 medications,
and obesity (only for walking for one hour).
Discussion
Our study revealed an increase in LTPA from 1987 to
2006 in older Spanish people. The results are consistent
with studies conducted in European, American and
Asian countries [22,25,27]. In Spain, the study conducted by Roman-Viñas et al [40] observed a slight
decreased in the proportion of sedentary leisure time
activities for males (from 50% to 45%) and females
(from 67% to 63%). However, this study was conducted
in Catalonia, a region of Spain, and did not focus in
LTPA in older people [40,41]. Therefore, our study is
the first one that includes national data over a period of
20 years in the Spanish older population.
The Scottish Health Survey found an increase in PA
among older people aged between 65 to 74 years, but a
decline in walking (65-74 year) and training sports
among 75 years and over [22]. The results derived from
the Health Survey in England (1991-2004) found an
upward trend in regular sports participation in all age
groups, but particularly pronounced among the older
groups (≥ 65 years) [27]. The Behavioral Risk Factors
Surveillance System found an increase in the prevalence
of walking from 1987 to 2000, particularly in older people [28]. The Japan Collaborative Cohort Study also
showed an increase in sports and physical exercise in
subjects aged 50-79 years old [25]. Previous studies have
shown a tendency that decreased activity occurs with
increasing age [14,24,31]; however, a cross-sectional
study conducted with Chinese women found that older
age was positively associated with participation in exercise/sports and walking [17].
We have also found that women exhibit lower prevalence of LTPA and physical fitness as compared to men
in all surveys, which is in agreement with the results by
Stamatakis et al [27]. The Cardiovascular Health Study
showed that men were more active in LTPA than
women in all age groups [6], which also agree with the
Palacios-Ceña et al. BMC Public Health 2011, 11:799
/>
Page 5 of 11
Table 2 Frequencies Statistic for MEN: Spanish National Health Surveys (SNHS) 1987, 1993, 1995-7, 2001, 2003 and
2006
SNHS 1987
SNHS 95-97
SNHS 2001
SNHS 2003
SNHS 2006
N = 1,614
N = 926
N = 1,862
N = 2,304
N = 2,813
72.2 (0.18)
Age Mean (SE)+
SNHS 1993
N = 2,112
74.9 (0.28)
73.3 (0.21)
73.3 (0.16)
73.8 (0.19)
74.5 (0.16)
Age group+
65-79
85.3
84.7
84.6
84.4
80.5
77.3
≥ 80
14.7
15.3
15.4
15.6
19.5
22.7
Marital status
Unmarried/widow/divorced
20.8
22.7
20.2
19.4
19.0
20.0
Married or living with couple
79.2
77.3
79.8
80.6
81.0
80.0
30.4
Educational level*
57.9
32.3
34.7
21.2
34.8
29.7
49.9
52.6
66.3
44.5
45.5
Secondary education or more
Self rated health*
No studies
Primary education completed
12.4
17.8
12.7
12.5
20.7
24.1
45.0
48.4
44.5
47.6
44.9
48.5
55.0
51.6
55.5
52.4
55.1
51.5
None
44.5
47.4
40.9
35.6
33.0
21.6
1
Nª of chronic conditions*
Very good/good
Fair/poor/very poor
32.3
34.2
33.9
33.7
33.5
32.3
≥2
23.2
18.4
25.2
30.7
33.5
46.1
None
37.7
36.4
26.3
22.1
15.0
12.3
1
Number of medications*
35.0
37.7
37.0
34.1
30.6
22.8
≥2
36.7
43.8
54.4
64.9
37.8
40.3
30.9
27.7
28.0
44.5
48.1
45.1
51.8
53.1
51.0
10.4
14.1
14.6
17.3
19.2
21.0
Smoker
33.8
27.9
24.2
19.3
16.8
15.4
Ex Smoker
43.3
43.9
50.0
53.1
52.2
54.3
Non Smoker
22.9
28.2
25.8
27.6
31.0
30.3
<8
59.5
57.3
56.8
52.3
61.0
58.0
≥8
Sleep habits (hours/day)
25.9
45.1
Obesity
Smoking habits*
27.3
Normal
Overweight
BMI*
40.5
42.7
43.2
47.7
39.0
42.0
Data are expressed as percentages (%)
+
Significant differences between SNHS/*Significant differences between SNHS (adjusted by age)
current results. Contrary, Simpson et al. [28] have
shown a higher prevalence of elder women who walk. In
this study, women were two to three times more likely
than men to report that walking was one of their LTPA.
The decreased prevalence of LTPA among women can
be attributed to monitorization of daily transports [26].
Gallant and Dorn [42] have reported that social network
emerged more importantly for women than for men,
which indicates that women may perform many of
health behaviors within a social context [43]. The omission of household activities may underestimate the total
PA within women and result in misclassified as physically not very active [26]. Further, cultural perspectives
can influence LTPA [44]. In fact, Spanish people have a
poor attitude to change or improve their physical activity as compared to Europeans [45]. In Spain, gender differences in LTPA are in accordance with findings
previously reported by Cornelio et al [41].
We found that age ≥80 years, to be married, ≥ 2 comorbid chronic conditions and obesity were associated
with a lower likelihood of reporting LTPA in both genders, which is in agreement with previous studies conducted in Australia [16] and USA [29]. Gallant and
Dorn [42] reported that marital status showed an influential element in men’s health behavior. Our results are
also consistent with Kaplan et al [29] who found that
married subjects were less likely to be active than single,
widowed, or divorced.
The current study also found that education level (primary or over) was related with LTPA and fitness activity, which agrees with previous studies [14,17,32]. The
Shanghai Women’s Health Study reported that women
aged 40-70 years of age with more education were more
likely to practice sports, but widows/divorced/separated
were more likely to walk [17]. In contrast, Wong et al
reported that people with lower educational level spent
more time on walking than those with higher level [32].
Among behavioral factors, smoking and BMI > 28
were negatively associated with LTPA. These results
agree with previous studies showing that obesity was
Palacios-Ceña et al. BMC Public Health 2011, 11:799
/>
Page 6 of 11
Table 3 Time trends by gender and age group in leisure time physical activity and physical fitness between 1987 and
2006
WOMEN
Age group SNHS 1987 SNHS 1993 SNHS 95-97 SNHS 2001 SNHS 2003 SNHS 2006 P-value*
Leisure time physical activity+
36.4
59.2
< 0.001
26.9
18.3
40.3
< 0.001
12.7
24.2
35.1
38.2
32.1
54.6
< 0.001
65-79
NA
86.5
87.9
87.6
88.2
85.6
0.056
NA
68.4
70.7
71.2
61.6
66.4
0.108
NA
83.8
85.3
85.0
81.8
80.9
0.401
65-79
NA
77.8
75.8
79.0
78.5
75.5
0.065
≥ 80
NA
53.6
44.4
53.5
42.6
45.3
0.385
Total
NA
74.2
71.0
75.0
70.0
68.1
0.172
65-79
26.6
45.2
56.7
60.5
45.0
73.0
< 0.001
≥ 80
18.9
49.0
41.7
46.8
33.1
58.4
< 0.001
Total
Walking up 10 step
40.4
26.0
Total
Leisure time physical activity
36.8
23.1
≥ 80
MEN
28.2
9.1
Total
Walking for one hour+
13.3
≥ 80
Walking up 10 step+
65-79
25.5
46.0
53.9
58.4
42.6
69.6
< 0.001
65-79
NA
92.9
93.8
94.5
92.6
91.0
0.158
≥ 80
80.5
82.5
82.9
77.0
74.7
0.502
NA
91.4
91.8
92.7
89.6
87.3
0.056
65-79
NA
87.7
88.6
88.3
87.8
84.7
0.072
≥ 80
NA
75.3
66.2
70.6
65.7
61.2
0.248
Total
Walking for one hour
NA
Total
NA
86.3
84.8
85.7
83.4
79.4
0.066
P value for association between the prevalence of study variables and the SNHS (multivariate regression models)/NA: Not available.
+ Significant differences in the total prevalence of study variables between women and men
Figure 1 Time trends of Leisure Time Physical Activity (LTPA).
Palacios-Ceña et al. BMC Public Health 2011, 11:799
/>
Page 7 of 11
Figure 2 Time trends of Walk 10 steps.
associated with lower activity [22,46]. In the longitudinal analyses of the CHIANTI study, obese older population with low muscle strength had steeper decline in
walking speed, walk 400 m or climb one flight on
stairs as compared with those without obesity or low
Figure 3 Time trends of Walk 1 hour.
muscle strength [47]. Spanish sedentary older people
exhibited lower education level in both genders. Sedentary men consume alcohol less frequently and have a
higher number of chronic diseases than women, while
sedentary older women are obese, have never smoked
Palacios-Ceña et al. BMC Public Health 2011, 11:799
/>
Page 8 of 11
Table 4 Logistic Regression Models for WOMEN
Leisure time physical activity
Marital status
Walking up 10 step
65-79
1
1
1
≥ 80
Age group
Walking for one hour
0.43 (0.36-0.51)
0.27 (0.22-0.34)
0.23 (0.19-0.28)
Educational level
Unmarried/widow/divorced
1
1
1
Married or living with couple
0.87 (0.75-1.00)
1.29 (1.06-1.58)
1.41 (1.19-1.66)
No studies
1
1
1
Primary education completed
1.28 (0.97-1.68)
Very good/good
1
1
1
1.13 (0.97-1.32)
0.22 (0.16-0.29)
0.19 (0.16-0.24)
None
1
1
1
0.89 (0.74-1.08)
1.50 (1.11-2.04)
1.33 (1.04-1.71)
≥2
Number of medications
1.28 (1.08-1.51)
1.48 (1.05-2.08)
1
Nª of chronic conditions
1.64 (1.34-2.00)
1.13 (0.90-1.42)
Fair/poor/very poor
Self rated health
1.15 (0.99-1.33)
Secondary education or more
0.74 (0.61-0.89)
1.19 (0.90-1.57)
0.93 (0.74-1.17)
1
1
1
1
1.28 (0.96-1.72)
1.02 (0.56-1.84)
0.83 (0.52-1.30)
≥2
BMI
None
1.15 (0.87-1.53)
0.58 (0.33-1.02)
0.48 (0.31-0.72)
1
1
1
0.98 (0.84-1.15)
0.99 (0.79-1.27)
0.97 (0.79-1.18)
Obesity
Smoking habits
Normal
Overweight
0.77 (0.63-0.95)
0.60 (0.46-0.77)
0.56 (0.45-0.70)
Smoker
1
1
1
Ex Smoker
1.03 (0.60-1.77)
0.59 (0.24-1.45)
1.20 (0.60-2.42)
Non Smoker
1.37 (0.90-20.7)
0.51 (0.25-1.04)
0.86 (0.50-1.48)
Sleep habits (hours/day)
<8
1
1
1
≥8
1.01 (0.88-1.15)
1.19 (0.99-1.43)
1.35 (1.15-1.58)
SNHS
1987
1
-
-
1993
1.82 (1.40-2.36)
1
1
1995-97
2.82 (2.15-3.70)
0.98 (0.65-1.49)
1.44 (1.02-2.05)
2001
3.66 (2.86-4.67)
1.15 (0.78-1.69)
1.70 (1.24-2.34)
2003
2.53 (1.99-3.21)
1.20 (0.84-1.72)
1.59 (1.19-2.13)
2006
3.69 (2.89-4.70)
1.29 (0.90-1.86)
1.63 (1.21-2.19)
The results of the logistic models are shown as adjusted odds ratios (ORs) with 95% confidence intervals. Models adjusted by all variables shown in the table, no
significant interactions were found
and consumed more frequently 3 or more drugs than
men [34].
Our results provide evidence that older people reporting a fair/poor/very poor self-rated health status have
difficulties in walking and climbing stairs. Self-perceived
health status is considered as a reliable predictor of PA,
walking decline and mortality in older people [6]. In
fact, perceived poor health status has been associated
with lower PA [33], as PA significantly correlates with
self-reported health in older adults [48].
Our study has revealed an increase in LTPA during
the last 20 years, but not for the capacity to walk up ten
steps or walk for one hour. The tendency to respond
affirmatively to LTPA can be explained because older
people sometimes have a negative opinion of those inactive, and have their own beliefs about the effects of PA
[49]. In addition, the less active older individual tends to
underestimate the benefits of exercise [50]. This may be
related to the fact that this group is determined by antiaging messages that appear in mass media [51], social
[42] and cultural contexts [44]. They may have a tendency to integrate socially, avoiding showing they need
help for anything [52]. In addition, elders may overestimate the PA [18] which they practiced, or be unaware
of the recommendations or levels of exercise for effective results [14]. Other factors that may influence adherence to PA in the elderly are outcome expectations and
environmental barriers [53], self-efficacy [54]. It is also
possible that older people meet the PA recommendations to maintain their health status but at the same
time have a sedentary lifestyle, and therefore their physical fitness has not improved.
Finally, we should recognize some limitations of our
study. First, discrepancies between trends of increase or
Palacios-Ceña et al. BMC Public Health 2011, 11:799
/>
Page 9 of 11
Table 5 Logistic Regression Models for MEN
Leisure time physical activity
Marital status
Walking up 10 step
65-79
1
1
1
≥ 80
Age group
Walking for an hour
0.61 (0.49-0.75)
0.37 (0.28-0.49)
0.30 (0.24-0.39)
Educational level
Unmarried/widow/divorced
1
1
1
Married or living with couple
0.79 (0.65-0.95)
0.74 (0.54-1.02)
0.94 (0.73-1.22)
No studies
1
1
1
Primary education completed
1.29 (0.92-1.81)
Very good/good
1
1
1
0.91 (0.76-1.08)
0.17 (0.11-0.25)
0.16 (0.12-0.22)
None
1
1
1
1.10 (0.87-1.37)
1.45 (0.95-2.20)
1.52 (1.06-2.16)
≥2
Number of medications
1.46 (1.13-1.88)
1.64 (1.06-2.57)
1
Nª of chronic conditions
1.68 (1.25-2.26)
1.13 (0.88-1.44)
Fair/poor/very poor
Self rated health
1.27 (1.04-1.54)
Secondary education or more
1.13 (0.88-1.44)
1.12 (0.75-1.66)
0.97 (0.68-1.38)
1
1
1
1
1.00 (0.76-1.32)
1.25 (0.57-2.71)
0.63 (0.35-1.15)
≥2
BMI
None
0.89 (0.66-1.18)
0.35 (0.18-0.71)
0.33 (0.19-0.59)
1
1
1
1.00 (0.84-1.22)
1.40 (1.02-1.91)
1.08 (0.83-1.41)
Obesity
Smoking habits
Normal
Overweight
0.66 (0.43-0.96)
0.92 (0.62-1.36)
0.70 (0.51-0.98)
Smoker
1
1
1
Ex Smoker
0.90 (0.72-1.13)
0.54 (0.33-0.87)
0.95 (0.66-1.36)
Non Smoker
0.79 (0.62-1.02)
0.66 (0.39-1.12)
1.41 (0.95-2.09)
Sleep habits (hours/day)
<8
1
1
1
≥8
0.99 (0.84-1.17)
1.24 (0.93-1.65)
1.27 (1.00-1.60)
SNHS
1987
1
-
-
1993
2.51 (2.03-3.11)
1
1
1995-97
3.35 (2.65-4.23)
1.01 (0.57-1.78)
0.81 (0.51-1.26)
2001
3.76 (3.04-4.66)
1.35 (0.89-2.02)
0.96 (0.69-1.35)
2003
1.99 (1.62-2.45)
1.18 (0.80-1.74)
1.01 (0.73-1.41)
2006
4.22 (2.85-5.59)
1.09 (0.74-1.62)
0.81 (0.58-1.13)
The results of the logistic models are shown as adjusted odds ratios (ORs) with 95% confidence intervals. Models adjusted by all variables shown in the table, no
significant interactions were found.
decrease in PA among studies may be related to the
definition and measurement of LTPA and physical fitness [18], study designs, or the statistical analysis [51].
In the current study, we used a self-reported measure
of PA including two questions with 2 possible answers,
which can have limited the assessment of activity and
exercise. Additionally, the SNHS only assessed LTPA
and PA; therefore, we cannot examine occupational,
recreational, and transport-related PA independently.
In addition, the validity of the questions included in
the surveys have not been analyzed. The use of objective measures could complement self-report data to
avoid bias, i.e., quantification of physical activity level
by calculating MET or using accelerometers [27]; however, this is not generally feasible in large-scale population surveys due to extensive costs. Further, even when
individuals can overestimate their participation in exercise, and underestimate sedentary behaviors [14,18],
surveys are extremely useful for investigating patterns,
frequencies, and time trends. Finally, the use of objective measurements for assessing PA has changed over
the last years, so the use of the same outcome for 20
years is difficult. Secondly, the study design does not
permit to establish a cause and effect relationship due
to the lack of longitudinal follow-up of the same individuals. Nevertheless, the use of a national populationbased survey permits the inclusion of representative
national sample sizes. Despite these limitations this
study provides additional insight into demographic
aspects of LTPA and physical fitness in older adults
for whom there is little information at population
levels, particularly in Spain.
Palacios-Ceña et al. BMC Public Health 2011, 11:799
/>
Conclusion
Our study revealed an increase in LTPA, but not in physical fitness, from 1987 to 2006 in older Spanish people.
Older people (age ≥ 80 years), married, with a greater
number of co-morbid chronic conditions and obese
exhibited a relatively lower LTPA. Similarly, older people (age ≥ 80 years, those taking a greater number of
medications for chronic conditions, obese, and with
worse self-perceived health status tended to have a relatively lower physical fitness. These results have potential
implications for health services, as identification of these
factors can help to prevent physical inactivity and
improve the health status of older people in Spain
List of abbreviations
PA: Physical activity; LTPA: Leisure time physical activity; SNHS: The Spanish
National Health Surveys; ORs: Odds ratios.
Acknowledgements and funding
None
Author details
1
Department of Health Science II, Universidad Rey Juan Carlos, Madrid, Spain.
2
Preventive Medicine and Public Health Teaching and Research Unit,
Department of Health Sciences, Universidad Rey Juan Carlos, Madrid, Spain.
3
School of Public Health. Madrid. Spain. 4Department of Physical Therapy,
Occupational Therapy, Rehabilitation and Physical Medicine, Universidad Rey
Juan Carlos, Alcorcón, Madrid, Spain.
Authors’ contributions
DPC conceived of the study, and participated in its design and coordination
and draft the manuscript. CAB carried out the acquisition of the data,
analysis and interpretation of data. She has been involved in revising it
critically. VHB participated in the design of the study and performed the
statistical analysis. PCG carried out the acquisition of the data, analysis and
interpretation of data. She has been involved in revising it critically. RJG
participated in the design of the study and performed the statistical analysis.
EPM carried out the acquisition of the data, analysis and interpretation of
data. She has been involved in revising it critically. CFP conceived of the
study, and participated in its design and coordination and helped to draft
the manuscript.
All authors read and approved the final manuscript.
Authors’ information
None
Competing interests
The authors declare that they have no financial competing interests and
non-financial competing interests.
Conflict of interest: The manuscript, or parts of it, have not been and will
not be submitted elsewhere for publication.
Role of the funding source: We have not financial interest and we have not
received direct o indirect funding, and there is not conflict of interest.
Page 10 of 11
4.
5.
6.
7.
8.
9.
10.
11.
12.
13.
14.
15.
16.
17.
18.
19.
20.
21.
22.
Received: 15 June 2011 Accepted: 13 October 2011
Published: 13 October 2011
23.
References
1. United Nations: Population Division: World Population Ageing 1950-2050.
New York: United Nations; 2002.
2. Christensen K, Doblhammer G, Rau R, Vaupel JW: Ageing populations: the
challenges ahead. Lancet 2009, 374:1196-1208.
3. Prohaska T, Belansky E, Belza B, Buchner D, Marshall V, McTigue K,
Santariano W, Wilcox S: Physical activity, public health, and aging: Critical
24.
25.
issues and research priorities. J Gerontol B Psychol Sci Soc Sci 2006, 6:
S352-S356.
Elsawy B, Higgins KE: Physical activity guidelines for older adults. Am Fam
Physician 2010, 81:55-9.
Gregg EW, Cauley JA, Stone K, Thompson TJ, Bauer DC, Cummings SR,
Ensrud KE: Study of Osteoporotic Fractures Research Group: Relationship
of changes in physical activity and mortality among older women. J Am
Med Dir Assoc 2003, 289:2379-86.
Hirsch CH, Diehr P, Newman AB, Gerrior SA, Pratt C, Lebowitz MD,
Jackson SA: Physical Activity and Years of Healthy Life in Older Adults:
Results From the Cardiovascular Health study. J Aging Phys Activity 2010,
18:313-334.
Boyle PA, Buchman AS, Wilson RS, Bienias JL, Bennett DA: Physical activity
is associated with incident disability in community-based older persons.
J Am Geriatr Soc 2007, 55:195-201.
Byberg L, Melhus H, Gedeborg R, Sundström J, Ahlbom A, Zethelius B,
Berglund LG, Wolk A, Michaëlsson K: Total mortality after changes in
leisure time physical activity in 50 year old men: 35 year follow-up of
population based cohort. BMJ 2009, 338:b688.
Ueshima K, Ishikawa-Takata K, Yorifuji T, Suzuki E, Kashima S, Takao S,
Sugiyama M, Ohta T, Doi H: Physical activity and mortality risk in the
Japanese elderly: a cohort study. Am J Prev Med 2010, 38:410-8.
Stessman J, Hammerman-Rozenberg R, Cohen A, Ein-Mor E, Jacobs JM:
Physical activity, function, and longevity among the very old. Arch Intern
Med 2009, 169:1476-83.
Demakakos P, Hamer M, Stamatakis E, Steptoe A: Low-intensity physical
activity is associated with reduced risk of incident type 2 diabetes in
older adults: evidence from the English Longitudinal Study of Ageing.
Diabetologia 2010, 53:1877-85.
Motl RW, McAuley E: Physical activity, disability, and quality of life in
older adults. Phys Med Rehabil Clin N Am 2010, 21:299-308.
Caspersen CJ, Powell KE, Christenson GM: Physical Activity, Exercise, and
Physical Fitness: Definitions and Distinctions for Health-Related
Research. Public Health Rep 1985, 100:126-131.
Ashe MC, Miller WC, Eng JJ, Noreau L: Physical Activity and Chronic
Conditions Research Team: Older adults, chronic disease and leisuretime physical activity. Gerontology 2009, 55:64-72.
Centers for Disease Control and Prevention: Physical activity and health A
report of the Surgeon General. Atlanta: US Dept of Health and Human
Services; 1996 [ />Lim K, Taylor L: Factors associated with physical activity among older
people- a population-based study. Prev Med 2005, 40:33-40.
Jurj AL, Wen W, Gao YT, Matthews CE, Yang G, Li HL, Zheng W, Shu XO:
Patterns and correlates of physical activity: a cross-sectional study in
urban Chinese women. BMC Public Health 2007, 7:213.
Merom D, Bowles H, Bauman A: Measuring Walking for Physical Activity
Surveillance- The effect of Prompts and Respondents’ Interpretation of
Walking in a Leisure-Time Survey. J Phys Activity Health 2009, 6:S81-S88.
Fors S, Lennartsson C, Lundberg O: Health inequalities among older
adults in Sweden 1991-2002. Eur J Public Health 2008, 18:138-43.
Murabito JM, Pencina MJ, Zhu I, Kelly-Hayes M, Shrader P, D’Agostino RB Sr:
Temporal trends in self-reported functional limitations and physical
disability among the community-dwelling elderly population: the
Framingham Heart Study. Am J Public Health 2008, 98:1256-62.
Allman-Farinelli MA, Chey T, Merom D, Bowles H, Bauman AE: The effects
of age, birth cohort and survey period on leisure-time physical activity
by Australian adults: 1990-2005. Br J Nutr 2009, 101:609-617.
Bromley C, Sproston K, Shelton N: The Scottish Health Survey 2003. Adults.
Scotland: Scottish Executive 2005, 2: [ />Doc/76169/0019729.pdf].
Carlson SA, Densmore D, Fulton JE, Yore MM, Kohl HW: Differences in
Physical Activity Prevalence and Trends From 3 U.S. Surveillance
Systems: NHIS, NHANES, and BRFSS. J Phys Activity Health 2009, 6:S18-S27.
Center for Disease Control: Trends in leisure-time physical inactivity by
age, sex, and race/ethnicity-Unites Sates, 1994-2004. MMWR 2005,
54:991-994.
Kurozawa Y, Hosoda T, Iwai N, Nose T, Yoshimura T, Tamakoshi A, for the
JACC Study Group: Levels of Physical Activity among Participants in the
JACC Study. J Epidemiol 2005, 15:S43-S47.
Palacios-Ceña et al. BMC Public Health 2011, 11:799
/>
26. Orsini N, Bellocco R, Bottai M, Pagano M, Wolk A: Age and Temporal
Trends of Total Physical Activity among Swedish Women. Med Sci Sports
Exerc 2006, 240-5.
27. Stamatakis E, Ekelund U, Wareham NJ: Temporal trends in physical activity
in England: The health Survey for England 1991 to 2004. Prev Med 2007,
45:416-423.
28. Simpson ME, Serluda M, Galuska DA, Gillespie C, Donehoo R, Macera C,
Mack K: Walking Trends Among U. S. Adults. The Behavioral Risk Factors
Surveillance System, 1987-2000. Am J Prev Med 2003, 25:95-100.
29. Kaplan MS, Newson JT, McFarland BH, Lu L: Demographic and
psychosocial correlates of physical activity in late life. Am J Prev Med
2001, 21:306-312.
30. Knuth AG, Hallal PC: Temporal trends in Physical Activity: A Systematic
review. J Phys Act Health 2009, 6:548-559.
31. Lindström M, Isacsson SO, Merlo J: Increasing prevalence of overweight,
obesity and physical inactivity: Two population-based studies 1986 and
1994. Eur J Public Health 2003, 13:306-312.
32. Pan SY, Cameron C, DesMeules M, Morrison H, Craig CL, Jiang XH:
Individual, social, environmental, and physical environmental correlates
with physical activity among Canadians: a cross-sectional study. BMC
Public Health 2009, 9:21.
33. Wong CH, Wong SF, Shen L: Correlates of Habitual Walking and Sports/
Leisure-time Physical Activity in Older Persons in Singapore: Interaction
Effects Between Educational Attainment and Gender. Ann Acad Med
Singapore 2003, 32:801-6.
34. Guallar-Castillón P, Santa-Olalla Peralta P, Banegas JR, López E, RodríguezArtalejo F: Physical activity and quality of life in older adults in Spain.
Med Clin (Barc) 2004, 123:606-10.
35. López-García E, Banegas-Banegas JR, Gutiérraz-Fisac JL, Graciani PérezRegadera A, Díez Gán L, Rodríguez-Artalejo F: Relation between body
weight and health-related quality of life among the elderly in Spain. Int
J Obes Relat Metab Disord 2003, 27:701-9.
36. Rodríguez-Artalejo F, López García E, Gutiérrez-Fisac JL, Banegas Banegas JR,
LaFuente Urdinguio P, Domínguez Rojas V: Changes in the prevalence of
overweight and obesity and their risk factors in Spain, 1987-1997. Prev
Med 2002, 34:72-811.
37. Garatachea N, Molinero O, Martínez-García R, Jiménez-Jiménez R, GonzálezGallego J, Márquez S: Feelings of well being in elderly people:
relationship to physical activity and physical function. Arch Gerontol
Geriatr 2009, 48:306-1.
38. Instituto Nacional de Estadística: panish National Health Survey 2006.
Madrid, Spain: Spanish Goverment; 2006 [ />estadisticas/encuestaNacional/encuesta2006.htm].
39. Ministerio de Sanidad y Consumo: Spanish National Health Survey 19872003. Madrid, Spain: Ministerio de Sanidad y Consumo; 2004 [http://www.
msps.es/estadEstudios/estadisticas/estadisticas/microdatos/
frmBusquedaMicrodatos.jsp].
40. Román-Viñas B, Serra-Majem L, Ribas-Barba L, Roure-Cuspinera E, Cabezas C,
Vallbona C, Plasencia A: Trends in physical activity status in Catalonia,
Spain (1992-2003). Public Health Nutr 2007, 10:1389-1395.
41. Cornelio CI, García M, Schiaffino A, Borrás JM, Nieto FJ, Fernández E, for the
CHIS.FU Study Group: Changes in leisure time and occupational physical
activity over 8 years: the Cornellá Health Interview Survey Follow-Up
Study. J Epidemiol Community Health 2008, 62:239-244.
42. Gallant MP, Dorn GP: Gender and race differences in the predictors of
daily health practices among older adults. Health Educ Res 2001, 16:21-31.
43. Krause MP, Januário RSB, Hallage T, Haile L, Miculis CP, Gama MPR, Goss FL,
da Silva SGA: A comparison of Functional Fitness of Older Brazilian and
American Women. J Aging Phys Act 2009, 17:387-397.
44. Mathews AE, Laditka SB, Laditka JN, Wilcox S, Corwin SJ, Liu R,
Friedman DB, Hunter R, Tseng W, Logsdon RG: Older adults’ perceived
physical activity enablers and barriers: a multicultural perspective. J
Aging Phys Act 2010, 18:119-40.
45. Varo-Cenarruzabeitia JJ, Martínez-González MA, Sánchez-Villegas A,
Martínez-Hernández JA, Irala-Estévez JJ, Gibney MJ: Attitudes and practices
regarding physical activity: situation in Spain with respect to the rest of
Europe. Aten Primaria 2003, 31:77-84.
46. Stenholm S, Rantanen T, Alanen E, Reunanen A, Sainio P, Koskinen S:
Obesity history as a predictor of walking limitation at old age. Obesity
2007, 15:929-938.
Page 11 of 11
47. Stenholm S, Alley D, Bandinelli S, Griswold ME, Koskinen S, Rantanen T,
Guralnik JM, Ferrucci L: The effect of obesity combined with low muscle
strength on decline in mobility in older persons: results from the
InCHIANTI Study. Int J Obes 2009, 33:635-644.
48. Chad K, Reeder BA, Harrison EL, Ashworth NL, Sheppard SM, Schultz SL,
Bruner BG, Fisher KL, Lawson JA: Profile of physical activity levels in
community-dwelling older adults. Med Sci Sports Exerc 2005, 37:1774-84.
49. Wilcox S, Sharkey JR, Mathews AE, Laditka JN, Laditka SB, Logsdon RG,
Sahyoun N, Robare JF, Liu R: Perceptions and beliefs about the role of
physical activity and nutrition on brain health in older adults.
Gerontologist 2009, 49:S61-71.
50. Leavy B, Aberg AC: “Not ready to throw in the towel": perceptions of
physical activity held by older adults in Stockholm and Dublin. J Aging
Phys Act 2010, 18:219-36.
51. Wadsworth LA, Johnson CP: Mass media and healthy aging. J Nutr Elder
2008, 27:319-31.
52. Gooberman-Hill R, Ebrahim S: Making decisions about simple
interventions: older people’s use of walking aids. Age Ageing 2007,
36:569-73.
53. Ayotte BJ, Margrett JA, Hicks-Patrick J: Physical activity in middle-aged
and young-old adults: the roles of self-efficacy, barriers, outcome
expectancies, self-regulatory behaviors and social support. J Health
Psychol 2010, 15:173-85.
54. McAuley E, May KS, Motl RW, White SM, Wójcicki TR, Hu L, Doerksen SE:
Trajectory of Declines in Physical Activity in Community-Dwelling Older
Women: Social Cognitive Influences. J Gerontol B Psychol Sci Soc Sci 2009,
64:543-50.
Pre-publication history
The pre-publication history for this paper can be accessed here:
/>doi:10.1186/1471-2458-11-799
Cite this article as: Palacios-Ceña et al.: Time trends in leisure time
physical activity and physical fitness in elderly people: 20 year followup of the Spanish population national health survey (1987-2006). BMC
Public Health 2011 11:799.
Submit your next manuscript to BioMed Central
and take full advantage of:
• Convenient online submission
• Thorough peer review
• No space constraints or color figure charges
• Immediate publication on acceptance
• Inclusion in PubMed, CAS, Scopus and Google Scholar
• Research which is freely available for redistribution
Submit your manuscript at
www.biomedcentral.com/submit