Tài liệu Department of Pesticide Regulation ppt
Bạn đang xem bản rút gọn của tài liệu. Xem và tải ngay bản đầy đủ của tài liệu tại đây (132.38 KB, 27 trang )
Department of Pesticide Regulation
Mary-Ann Warmerdam
Director
M E M O R A N D U M
Edmund G. Brown Jr.
Governor
1001 I Street • P.O. Box 4015 • Sacramento, California 95812-4015 • www.cdpr.ca.gov
A Department of the California Environmental Protection Agency
Printed on recycled paper, 100% post-consumer processed chlorine-free.
TO: Randy Segawa
Environmental Program Manager I
Environmental Monitoring Branch
Original signed by Frank Spurlock
FROM: Daniel R. Oros, Ph.D. for
Environmental Scientist
Environmental Monitoring Branch
Frank C. Spurlock, Ph.D. Original signed by
Research Scientist III
Environmental Monitoring Branch
916-324-4124
DATE: January 27, 2011
SUBJECT: ESTIMATING PESTICIDE PRODUCT VOLATILE ORGANIC COMPOUND
OZONE REACTIVITY. PART 1: SPECIATING TGA -BASED VOLATILE
ORGANIC COMPUND EMISSIONS USING CONFIDENTIAL STATEMENTS
OF FORMULA
ABSTRACT
This memo describes a Confidential Statement of Formula (CSF)-based speciation/emission
potential (EP) estimation procedure. EP refers the volatile fraction of a pesticide product
under the conditions of the Department Pesticide Regulation’s (DPR’s) thermogravimetric
analysis (TGA) method (Marty et al., 2010). EP is assumed to represent product volatilization
under actual use conditions. Speciation refers to identification of the actual chemical species
comprising the volatile fraction of a pesticide product. In this paper we document the EP
estimation procedure and assess its accuracy by comparing product CSF estimated-EPs to
measured-EPs. The volatile components of 134 nonfumigant products reported as used in the
1990 and/or 2007 San Joaquin Valley (SJV) ozone season pesticide volatile organic
chemical (VOC) inventory were identified using product CSFs and an empirical vapor
pressure (VP) cutoff. The total percentage of estimated volatiles in each product was then
compared to TGA-measured EPs. The VP
25C
cutoff (vapor pressure at 25C) that yielded the best
agreement between estimated and measured EPs was approximately 0.05 Pa. Components with
VP
25C
> 0.05 Pa were classified as volatile, while those with VP
25C
< 0.05 were classified as
nonvolatile. A paired t-test demonstrated a small but significant bias in estimated EPs relative to
measured values. The mean difference between measured and estimated EPs (TGA-measured
EP CSF-estimated EP) was +1.4% (p=0.003), the measured TGA EPs being greater. This
difference was attributable to inadequate or inaccurate product composition information in
most cases. For some products, composition data for the concentrated manufacturing use
products (MUP) used to formulate end use products (EUP) was not available. The net effect
was a low bias in CSF-estimated EPs because unidentified volatile components in the MUP
Randy Segawa
January 27, 2011
Page 2
(e.g. solvents) were not accounted for in the EUP CSF. However, the CSF-estimation procedure
also identified products where TGA-measured EPs were substantially in error. This occurred
when water was present in the liquid MUP used to formulate the EUP, but was not accounted for
in the EUP TGA data submission. When this happens, the water volatilized during TGA analysis
is incorrectly assumed to be a VOC and the TGA-measured EP is too high. An additional source
of TGA error was due to the absorption of water by clays or other hygroscopic materials in
certain dry EUPs, again causing an upward bias in the TGA-measured EPs. In spite of the
deviations between TGA-measured and CSF-estimated EPs, overall the agreement between the
two was good. Regression of estimated EPs on measured EP yielded a slope not significantly
different than one (slope = 1.02; 0.99, 1.05; 95%CI) with an R
2
of 0.985. Recommendations
include CSF analysis of additional products with the goal of refining the 0.05 Pa VP
25C
cutoff,
and more consistent use of CSFs in evaluating TGA data and correcting questionable data.
Finally, the CSF analysis provides a method to estimate the composition of pesticide product
volatile components, thereby supporting eventual incorporation of reactivity into the VOC
inventory.
1. INTRODUCTION
The current pesticide volatile organic compound (VOC) inventory is a mass-based inventory that
tracks pounds of VOCs emitted from agricultural and commercial structural pesticide
applications. The inventory does not account for differences among VOCs in their ability to
participate in ozone forming reactions, i.e. their “ozone reactivity.” DPR recently proposed a
pilot study to examine how ozone reactivity could be incorporated into the pesticide inventory
(Oros, 2009). The objective of the study is to quantify the relative ozone reactivity of individual
pesticide products. In estimating relative ozone reactivity, the first step is identify the
composition of a product’s volatile emissions (speciation). The second step is then to determine
the product’s relative ozone formation potential using individual component reactivity data.
These reactivity data may include Maximum Incremental Reactivity or Equal Benefit
Incremental Reactivity data, among others (Carter, 1994). This memorandum
• describes a method for speciating emissions using pesticide product CSFs,
• compares CSF-estimated and TGA-measured-EPs for several high VOC contributing
products, and
• documents potential problems that arose when estimating VOC speciation using CSF data.
2. METHODS
A. Compilation of Confidential Statement of Formulas
The CSFs for pesticide products typically contain the following information: chemical name,
source product name, Chemical Abstracts Service registry number, purpose in formulation
Randy Segawa
January 27, 2011
Page 3
(e.g., inert or active ingredients[A.I.s]), and percentage by weight of the chemical in the
formulated product. Individual chemicals listed in CSFs are primarily classified as
either A.I.s or inert ingredients. The Code of Federal Regulations, 40 Code of Federal
Regulations Part 180 (sections 180.910 – 180.960) outlines inert ingredients that the
U.S. Environmental Protection Agency (U.S. EPA) has approved for use in pesticide
products (< />>), and these “inerts” are
used in pesticide products in California. DPR lists over 981 A.I.s and 13,417 pesticide
products for use here in California (< />>, data
accessed on December 24, 2009).
For this pilot study, registrant-submitted CSFs were compiled for the top nonfumigant
VOC-emitting EUPs in the SJV in each of 2 years: the 1990 base year and 2007. When
available, CSFs were also obtained for the MUPs used to formulate the EUPs. In total, CSFs
were compiled for a total of 84 distinct California-registered products. The products (including
their subregistrations and label revisions, as explained later) corresponded to 58% and 60% of
SJV adjusted nonfumigant ozone season emissions in 1990 and 2007, respectively.
B. Classification of Product Components
Many pesticide products use the same chemical ingredients. These can function as an A.I.,
anti-caking agent, anti-foaming agent, dye, emulsifying agent, odorant, solvent, surfactant, or
thickener. Except for solvents, most of these ingredients have low volatility. Many, such as
surfactants, have high molecular weight and very low VPs. Such components are not espected to
contribute significantly to tropospheric VOCs.
Active Ingredients: An A.I. is any substance or group of substances that prevents, destroys,
repels or mitigates any pest, or that functions as a plant regulator, desiccant, defoliant, or
nitrogen stabilizer. End use nonfumigant pesticide products are often formulated from MUPs.
MUPs usually contain a high percentage of A.I., and may consist of the technical grade of A.I.
only, or may contain inert ingredients, such as solvents or stabilizers, etc. that serve different
functions in the product formulation. Most A.I.s are not sufficiently volatile to contribute to
tropospheric VOCs due to their high molecular weight and low VPs.
Antifreezes: Antifreezes are used to prevent freezing of a pesticide product. Common antifreeze
agents used in pesticide products are ethylene glycol and propylene glycol.
Emulsifying/Dispersing Agents: Emulsifiers have a hydrophobic and a hydrophilic end, which
act by surrounding an immiscible molecule, including oils, and forming a protective layer
keeping the molecules from clumping together. Dispersing agents are used to keep an emulsion
Randy Segawa
January 27, 2011
Page 4
well dispersed. Emulsifier and dispersing agent compositions can include very large polymers of
high molecular weight and low VP.
Odorants: Odorants are used as volatile indicators due to their distinctive odor and volatility. An
odorant commonly used in pesticide products is methyl salicylate also known as wintergreen.
The VP
25
of methyl salicylate is comparable to some solvents.
Oils: Oils such as mineral oil and soybean oil generally function as solvents. Mineral oil is
composed mainly of alkanes (typically 15 to 40 carbons) and cyclic paraffins, while soybean oil
is composed mainly of unsaturated fatty acids including oleic acid (C
18:1
), linoleic acid (C
18:2
),
linolenic acid (C
18:3
). Oils are composed of a range of high molecular weight components that
generally have low VPs.
Solvents: Organic solvents are liquids that are used to dissolve active ingredients. Examples of
several solvents approved by U.S. EPA for use in pesticide products include: methyl isobutyl
ketone, cyclohexanone and N-methyl-pyrrolidinone. Most solvents are volatile enough to
contribute to tropospheric VOCs based on their low molecular weight and high VPs.
Solvent Mixtures: Solvent mixtures (e.g. aromatic 100, aromatic 150, aromatic 200) are also used
in pesticide products. Aromatic solvent mixtures are generally distillation cuts with a range of
volatile components and VPs. The major difference between the aromatic solvent mixtures is
carbon number. which increases with distillation range. For instance, aromatic 100 is largely
composed of C9-10 dialkyl and trialkylbenzenes, aromatic 150 is composed largely of C10-11
alkylbenzenes and aromatic 200 includes C10-14 alkylnaphthalenes (Table 1).
Surfactants: Surfactants aid in suspending the A.I. when the product is mixed with a solvent.
When applied in the field, surfactants may also allow easier spreading of a product by lowering
the surface tension of the liquid. Surfactants are typically high molecular weight, amphoteric and
possess very low or no volatility.
Other Agents: Carriers (e.g., clays, fruit pulp, crushed corn cobs, etc.), thickeners, anti-caking
agents, anti-foaming agents, preservatives, and dyes are also used in non-fumigant products.
Most are used in low amounts in pesticide products and generally have high molecular weight
and low VPs.
Randy Segawa
January 27, 2011
Page 5
Table 1. General composition and approximate component vapor pressures
(VPs) of aromatic product solvent mixtures
A
aromatic 100 aromatic 150 aromatic 200
mean VP
of chemical class
Total Aromatics (%) >99.5% >99.5% >99.5% Pascals/(N)
B
CHEMICAL CLASS
alkylbenzenes
C8 ~5-10% <5% <5% 924/(4)
C9 80% <5% <5% 328/(8)
C10 10% 58% <5% 118/(17)
C11 <5% 12% <5% 46/(4)
indanes/THN
C
<5% 14% 6% 26/(4)
alkylnaphthalenes
C10 <5% 11% <5% 24/(1)
C11 <5% <5% 52% 5.8/(2)
C12 <5% <5% 20% 2.4/(4)
C13 <5% <5% 8% 0.9/(2)
A
Composition data: Krenek and Rhode, 1988; Vapor pressure data: Syracuse Research
Corporation Environmental Fate Database, < />>;
U.S. EPA SPARC < />two/onsite/sparcproperties.htm> (SPARC references - Hilal et al., 2003a, 2003b)
B
N = Number of chemicals in class used to calculate mean
C
Tetrahydronaphthalenes
C. Analysis of Vapor Pressure for Determining Volatility
Vapor pressure at 25C (VP
25C
) was used to discriminate between chemicals that did or did not
volatilize under the experimental TGA conditions.
Vapor pressure: The pressure of a vapor in equilibrium with a condensed phase (liquid or solid).
While VPs vary with temperature, we used each chemical’s VP at 25°C as a relative measure of
a chemical’s tendency to vaporize at the TGA temperature of 115C.
VP
25C
data were collected from various databases accessible via the worldwide web including
the European Union's Footprint Pesticide Properties Database
(< />>), California Air Resources Control Board’s
Consumer Product Solvent Database (< and
Syracuse Research Corporation’s Interactive Physical Properties Database
(< />>). Because vapor pressure are
Randy Segawa
January 27, 2011
Page 6
sometime variable, we compared database values with published literature data where necessary
to identify an accurate VP
25
for each chemical.
The VP
25C
of common chemicals included in high use pesticide products from 1990 and 2007
years are shown in Table 2. From the data it is obvious that solvents generally have much higher
VP
25C
than most A.I.s. In a few cases the VP
25C
of some nonfumigant A.I.s are comparable to
those of low volatility solvents.
Chemical Name CAS
VP at 25°C (Pa)
unless noted
VP
Reference
Active Ingredients
Phorate
98-02-2 385 SRC
Pebulate 1114-71-2
12 SRC
EPTC 759-94-4
3SRC
Butylate
2008-41-5
2SRC
Molinate 2212-67-1
0.7 SRC
Naled 300-76-5
0.03 SRC
Diazinon 333-41-5
0.012 SRC
Trifluralin 1582-09-8
6.1E-03 SRC
Methamidophos
10265-92-6 4.7E-03 SRC
Metolachlor 51218-45-2
4.2E-03 SRC
Oxydemeton-methyl 301-12-2 3.8E-03 SRC
Alachlor
15972-60-8 2.9E-03 SRC
Chlorpyrifos 2921-88-2
2.7E-03 SRC
Dimethoate 60-51-5
2.5E-03 SRC
Thiram
137-26-8 2.3E-03 SRC
Metalaxyl
57837-19-1 7.5E-04 SRC
Fenpropathrin 39515-41-8 7.3E-04 SRC
Tribufos
78-48-8 7.1E-04 SRC
Ethofumesate
26225-79-6 6.5E-04 SRC
Methidathion
950-37-8 4.5E-04 SRC
Azinphos-methyl 86-50-0
2.1E-04 IUPAC
Carbaryl 63-25-2
1.8E-04 SRC
Prometryne
7287-19-6 1.7E-04 SRC
Fenamiphos
22224-92-6 1.3E-04 SRC
Dicofol
115-32-2 5.3E-05 SRC
Oxamyl 23135-22-0 5.1E-05 IUPAC
Propargite
2312-35-8 4.0E-05 SRC
Fluazifop-p-butyl
79241-46-6 3.3E-05 SRC
Table 2. Vapor pressures of common chemicals included in high
use pesticide products from 1990 and 2007.
(Cont.)
Randy Segawa
January 27, 2011
Page 7
Chemical Name CAS VP at 25°C (Pa) VP
Oxyfluorfen 42874-03-3
2.7E-05 SRC
Endosulfan 115-29-7 2.3E-05 SRC
Napropamide
15299-99-7 2.3E-05 SRC
Sethoxydim 74051-80-2 2.1E-05 SRC
Carboxin
5234-68-4 2.0E-05 SRC
2,4-D 94-75-7 1.9E-05 IUPAC
Cyanazine
21725-46-2 1.8E-05 SRC
Ethephon 16672-87-0 1.3E-05 SRC
Permethrin 52645-53-1
2.9E-06 SRC
Thiabendazole
148-79-8 5.3E-07 SRC
Cypermethrin 52315-07-8
4.1E-07 SRC
Clethodim 99129-21-2 3.5E-07 SRC
Esfenvalerate 66230-04-4 2.0E-07 SRC
Endothal
145-73-3 2.1E-08 SRC
Gibberellic Acid 77-06-5 1.7E-11 SRC
Solvents
Methanol 67-56-1
16,932 SRC
Ethanol
64-17-5
7,906 SRC
Isopropyl alcohol
67-63-0
6,053 SRC
Toluene
108-88-3
3,786 SRC
Water 7732-18-5
3,173 SRC
Methyl isobutyl ketone 108-10-1
2,653 SRC
1-Methoxypropanol
107-98-2 1,667 SRC
Aromatic 100 64742-95-6 269
ExxonMobil
Monochlorobenzene
108-90-7
1,600 SRC
Ethylbenzene 100-41-4
1,280 SRC
p-Xylene 106-42-3
1,179 SRC
Cyclohexanone 108-94-1
577 SRC
Aromatic 150 64742-94-5 74
ExxonMobil
Kerosene
8008-20-6
387 (20°C)
CARB
1,2,4-Trimethylbenzene
95-63-6
280 SRC
d-Limonene
5989-27-5
264 SRC
Stoddard solvent 8052-41-3
133 CARB
Hexanol
111-27-3
124 SRC
2-Butoxyethanol 111-76-2
117 SRC
Cyclohexanol
108-93-0
107 SRC
Butyrolactone
96-48-0
60 SRC
Propylene glycol
57-55-6
17 SRC
Naphthalene
91-20-3
11 SRC
Table 2. Continue
d
(Cont.)
Randy Segawa
January 27, 2011
Page 8
Chemical Name CAS
VP at 25°C (Pa)
unless noted
VP
Reference
Aromatic 200 68477-31-6 5 (20°C)
ExxonMobil
Triacetin 102-76-1
0.3 SRC
Methyl oleate 112-62-9
0.0008 SRC
Other Ingredients
Ethylene glycol
107-21-1
12 SRC
Methyl salicylate
119-36-8 5 SRC
Butylated hydroxytoluene
128-37-0 1 SRC
Glycerol
56-81-5 0.02 SRC
CARB. California Air Resource Board, Consumer Product Solvent
Database. Web site- />ExxonMobil Chemical. Website-
/>SRC PhysProp Database. Syracuse Research Corporation. Website-
IUPAC. Pesticide Properties Database accessed via IUPAC Portal.
Website- />Table 2. Continued
D. Speciation and Estimation of Emission Potential
Speciation: Speciation refers to identification of the actual composition of the VOCs emitted
from a pesticide product. The purpose of this study was to create a robust method for speciating
VOCs from a pesticide product by using the product’s CSF. Table 3 illustrates a simplified CSF,
including percent composition (%) of chemical ingredients (active and inerts) and their purpose
in the formulation.
Table 3. Example CSF for a nonfumigant pesticide product
Chemical Purpose Percent by Weight (%)
A Active Ingredient 10
B Solvent 45
C Emulsifier 2
D Antifreeze 2
E Water 40
F Dye 1
Randy Segawa
January 27, 2011
Page 9
Emission Potential: EP refers to the fraction of a product that is assumed to contribute to
atmospheric VOCs. In this study, product EPs were estimated by summing the weight percent of
all VOCs. For example, in Table 3 if ingredient B, a solvent, is identified as the only VOC in the
product then the product EP is 45%, which is the weight percent (%) of ingredient B in the
product. As a second example, if ingredients A and B are both identified as VOCs, then the
product EP is 55%, the sum of weight percents (%) of ingredient A (10%) and ingredient
B (45%). Thus, the problem of estimating product EPs from CSF data reduces to determining
which chemicals are volatile and which are not. This issue is addressed in the next section.
E. Thermogravimetric Analysis
The potential for solid or liquid-based pesticide products to emit VOCs is estimated by TGA
(DPR, 1994). DPR generally requires registrants to provide TGA analysis for newly registered
liquid products. During TGA, pesticide products are heated in an environmentally controlled
chamber and held isothermally until the rate of sample mass loss drops below a defined
threshold. The mean of three replicate measurements is used to estimate a product EP. The TGA
method uses a final holding temperature of 115°C (239°F) to facilitate volatilization and loss of
water contained in a pesticide formulation.
The 115°C temperature has been criticized because ambient temperatures in agricultural areas
where pesticides are applied are much lower. However, volatilization of chemicals depends on
both temperature and time. In TGA, a relatively high temperature is used in conjunction with a
very short testing interval. The 115°C TGA test regimen has a maximum duration of only
80 minutes. In contrast, actual volatilization of nonfumigant pesticides in the field occurs over
characteristic time periods of weeks to month(s) (Ross et al., 1989; Seiber and McChesney,
1988; Seiber et al., 1991; Yates, 2006a; Yates, 2006b; Taylor and Glotfelty, 1989 and numerous
references there-in). The high temperature used in the TGA test offsets the short test duration.
Longer laboratory test periods would be experimentally difficult, if not impossible. The
115°C/80 minute maximum test TGA test regimen was determined based on a response surface
analysis of different temperature/time combinations across a series of pesticide products. Details
on the development of the TGA method for pesticides, method validation and inter-laboratory
comparisons are described in Marty et al. (2010).
Randy Segawa
January 27, 2011
Page 10
Carter and Malkina (2007) reported that ozone reactivities of chemicals with VP down to
approximately 0.01 Pa may be effectively studied under laboratory conditions, and further
suggest that such chemicals are likely to participate in gas phase reactions in the environment.
As shown later, a comparison of product CSFs and TGA-measured EPs supports 0.05 Pa as a
VP cutoff for distinguishing volatile product components under experimental TGA conditions.
However, few products examined here had components with 0.01 Pa < VP < 0.1 Pa.
Consequently, 0.05 Pa is an approximate cutoff, and additional product analyses is desirable to
refine that cutoff value.
DPR currently assumes that volatilization under the short duration - high temperature TGA
regimen approximates actual volatilization over the longer time intervals in the field. However,
there is some evidence that a lower VP cutoff may be applicable for defining actual volatility in
the environment. A recent paper prepared on behalf of the European Crop Protection Association
evaluated 24 hr volatilization data from 190 experiments carried out with 80 crop protection
chemicals (Guth et al., 2004). These studies were carried out to meet pesticide registration
regulatory requirements. Based on those data, Guth et al. (2004) identified approximate lower
VP limits of 0.001 Pa for volatilization from soil, and 0.0001 Pa for volatilization from crops.
Below these limits they concluded “no noticeable volatility” is expected. Thus, the 0.05 Pa cutoff
for identifying volatile components under TGA conditions may yield a low-biased estimate of
actual post-application volatilization as it occurs in the field.
3. COMPARISON OF CSF-ESTIMATED EMISSION POTENTIALS AND
THERMOGRAVIMETRIC ANALYSIS-MEASURED EMISSION POTENTIALS
In the absence of data demonstrating otherwise, DPR’s presumption is that the composition
of all products that share the same primary EPA registration number are substantively the same.
Consequently DPR assigns EPs determined for one product to all of it’s related sub-registrations
and label revisions. In this study CSFs were estimated for a total of 84 distinct
California-registered products with TGA measured EP data from the 1990 and 2007
SJV VOC inventories. Some products were used in both years, and a few of the 84 products
were related label revisions or subregistrations. Consequently the 84 products represented
79 distinct EPA primary registration numbers (“Primary Registrant Firm Number-Label
Number”). Most of the primary registration numbers represented at least two label revision or
subregistered products that had been or were currently registered in California. Consequently the
total number of (active and inactive) California products represented by the 79 distinct EPA
primary registration numbers was 215. Of these, a total of 148 products were in one or both of
the 1990 and 2007 inventories. The 148 products account for 58% and 60% of SJV adjusted
nonfumigant ozone season emissions in 1990 and 2007, respectively. To estimate the EP from
CSF data, the VP
25C
of individual product components in each CSF were compiled. Components
Randy Segawa
January 27, 2011
Page 11
with VP
25C
>0.05 Pa were classified as volatile and their weight percent in the product summed
to yield the CSF-estimated product EP.
In our initial comparisons, there were large differences (>10%) between CSF-estimated EPs and
TGA-measured EPs in some cases. Most of these were attributable to unknown components in
the EUP. A principal source of the unknowns was the MUPs used to formulate the EUPs. We
were able to obtain MUP CSFs from the original product chemistry registration data submissions
for approximately half of the cases and use these to identify the unknown components. Several of
the unknowns were volatile solvents in the MUP that were subsequently added to the EUP
during the manufacturing process. For these the CSF-estimated EPs were modified accordingly.
In a few other cases, the unknown components turned out to be water. Because this water was
not reported on the EUP CSF, the measured TGA was not properly corrected for the presence of
this water in the original data submission. Consequently the TGA determination was inaccurate
(high-biased). For the sake of comparisons here, water was treated as a VOC in the EP
estimation procedure for these products. However, product EPs for all subregistered and label
revision products of these primary registrations will be corrected in future inventory calculations
and in subsequent reactivity calculations (Oros and Spurlock, 2010).
For seven other primary registration numbers where unknown components were > 4% of the
EUP, the MUP CSFs could not be located. While some of these yielded relatively good
agreement between CSF-estimated and TGA-measured EPs, others showed marked
deviations-likely due to unidentified solvents in the MUPs used to formulate the EUPs. All
seven were excluded from subsequent analysis to reduce the uncertainty in CSF-estimated EPs
and to provide a consistent basis dataset for comparison of the two EP methods. Thus, the final
basis data set consisted of 72 primary registration numbers representing 200 total products, of
which 134 were in one or both of the 1990 and 2007 inventories. These 72 primary registration
numbers represented 45% and 54% of SJV adjusted nonfumigant ozone season emissions in
1990 and 2007, respectively.
Based on a t-test of paired differences between measured and estimated EPs (difference = TGA
measured EP-CSF estimated EP), there was a small but significant difference between estimated
EPs and the measured values (paired t-test, p=0.003). The mean difference between measured
and estimated EPs was 1.4%, the TGA EPs being greater. There were two causes for these
differences: error in the CSF-estimation procedure and error in the experimental TGA
determinations. In the CSF estimation procedure there were numerous products with small
amounts of unknown components, even after censoring those products with > 4% unknowns. In
the case where these are volatile, the resultant CSF-estimated EPs were low-biased. However,
when water is present as an unknown in the MUP, either due to introduction in the MUP or
absorption by hygroscopic materials such as clays, the TGA value will be high-biased. We have
observed several products in this study and elsewhere that contain bentonite, kaolin or other
finely-divided high surface area materials, and that also yield nonzero EPs even though they
Randy Segawa
January 27, 2011
Page 12
contain no volatile organic chemicals. For example, a recent FTIR analysis analysis of TGA
emissions from six sulfur products concluded that the observed mass loss was attributable to
water (McConnell et al., 2008). The result of this artifact is a high-bias in TGA-measured EPs.
Finally, there is evidence that DPR’s basic assumption, that “the composition of all products that
share the same primary EPA registration number are substantively the same” may not always be
true. For example, one primary EPA registration number had two CSFs submitted at different
times that differed substantially in percentage of volatile solvent and other components.
Composition differences between products that share the same primary EPA registration number
will be especially problematic in situations where the CSF of one is compared to the TGA data
for another.
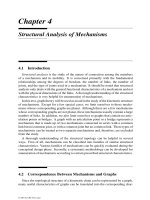
Overall the agreement between estimated and measured EPs was quite good, with the 5th - 95th
percentile range of (TGA measured EP - CSF estimated EP) of -3% to 7% (Figure 1). A
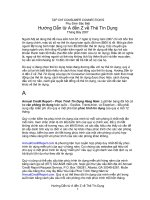
regression of CSF-estimated EPs on TGA-measured EPs yields a slope that is not significantly
different than one (0.99, 1.05; 95%CI; Figure 2). We conclude that pesticide emissions under
TGA conditions can be accurately speciated using CSF analysis. It's also apparent that TGA and
CSF analysis are complementary, and both should used to derive product EPs.
(TGA measured EP - CSF estimated EP)
Cumulative frequency (percent)
151050-5-10
99.9
99
95
90
80
70
60
50
40
30
20
10
5
1
0.1
Figure 1. Cumulative frequency of (TGA measured EP-CSF estimated EP) for data compiled for
72 primary registration numbers.
Randy Segawa
January 27, 2011
Page 13
TGA-measured
CSF-estimated
100806040200
100
80
60
40
20
0
R-square = 0.99, p < 0.001
CSF-estimated = -2.01 + 1.02 TGA-measured
Figure 2. Regression of CSF-estimated EPs on TGA-measured EPs based on data compiled for
72 primary registration numbers.
4. CONCLUSION
In summary, a simple vapor pressure cutoff was used to distinguish “volatile” and “nonvolatile”
product components under TGA conditions using product CSFs. While a few issues arose in
compiling and analyzing the data, we anticipate these will be easily resolved as CSF analysis
becomes routine. The problems included:
• difficulty obtaining complete composition data for some EUPs. One principal cause was
difficulty in locating CSFs for MUPs used to formulate EUPs. In some cases this resulted in
our inability to identify all volatile components in a product.
• difficulty locating product CSFs for older products where the primary registrant had sold the
product or if the company re-organized.
• lack of composition data for proprietary mixtures such as certain surfactants and emulsifiers;
these sometimes contain unidentified VOC components. While the total VOC contribution
from such mixtures is relatively low in comparison to other pesticide product components
(i.e. generally <<5%), they are a potential source of error when using CSFs to estimate EUP
EPs.
Randy Segawa
January 27, 2011
Page 14
The accuracy of the CSF-based EP estimation/speciation procedure was demonstrated using data
compiled for 72 EPA registration numbers representing 134 products reported as used in the
1990 and/or 2007 SJV pesticide VOC inventories. Regression of CSF-estimated EPs on
TGA-measured values yielded a slope not significantly different than one with a correlation
coefficient r > 0.99 (p<0.001). A small bias was observed, with the mean of (TGA-measured
EP-CSF-estimated EP) of +1.4% (paired t-test, p=0.003). This bias was attributable to
incomplete product composition information for some products. However, the bias is comparable
to the error in TGA analysis of some products. For example, formulations containing
finely-divided hygroscopic materials such as clays may absorb water, leading to errors in TGA
measured EPs.
DPR plans to retain TGA as the primary method for estimating product emission potentials. However, in
spite of the
small bias, the data support the use of CSF analysis in both review of TGA data and
for speciating TGA emissions. Detailed CSF analysis should be viewed as complementary to the
TGA EP determination method. There were a number of cases where problems or errors in the
TGA determination became evident after review of product CSFs. Use of both TGA and CSF
data to determine EPs will improve the accuracy of the inventory.
In most cases, CSF analysis allowed clear and unambiguous speciation of volatile components in
pesticide products under TGA conditions. We recommend conducting further paired
comparisons of CSFs and TGA data to refine our current 0.05 Pa vapor pressure cutoff used to
classify components as to “volatile” or “not volatile” under TGA conditions.
Randy Segawa
January 27, 2011
Page 15
5. REFERENCES
Barry, T., F. Spurlock, R. Segawa. 2007. Pesticide Volatile Organic Compound Emission
Adjustments for Field Conditions and Estimated Volatile Organic Compound Reductions-Initial
Estimates. (PDF, 184 kb). Appendix 1 (PDF, 734 kb) Appendix 2 and 3 (PDF, 376 kb).
Carter, William P.L. 1994. Development of ozone reactivity scales for volatile organic
compounds. Journal of the Air & Waste Management Association, 44:881-899.
Carter, William P.L. 2009. Development of the SAPRC-07 Chemical Mechanism and Updated
Ozone Reactivity Scales. Final Report to the California Air Resources Board, Contract No.
03-318. June 22, 2009.
Carter, W.P.L. and Malkina, I.L. 2007. Investigation of Atmospheric Ozone Impacts of Selected
Pesticides. Final Report to California Air Resource Board, Contract No. 04-334. January 10.
DPR. 1994. Estimation of Volatile Emission Potential of Liquid Pesticides by
Thermogravimetry. Environmental Monitoring Branch, Department of Pesticide Regulation.
Sacramento, California.
Guth, J.A., F.J. Reischmann, R. Allen, D. Arnold, J. Hassink, C.R. Leake, M.W. Skidmore and
G.L. Reeves. 2004. Volatilization of crop protection chemicals from crop and soil surfaces under
controlled conditions-prediction of volatile losses from physico-chemical properties.
Chemosphere, 57:871-887.
Hilal, S.H., S.W. Karickhoff and L.A. Carreira. 2003a. Prediction of Chemical Reactivity
Parameters and Physicochemical Properties of Organic Compounds from Molecular Structure
using SPARC. U.S. EPA publication 600/R-03/030. Available at:
<
Hilal, S.H., S.W. Karickhoff and L.A. Carreira. 2003b. Verification and Validation of the
SPARC Model. U.S. EPA publication 600/R-03/033. Available at:
< />>.
Krenek, M.R. and Rhode, W.H. 1988. “An Overview – Solvents for Agricultural Chemicals,”
Pesticide Formulations and Application Systems: Eighth Volume, ASTM STP 980, D.A. Hovde
and G.B. Beestmand, Eds., American Society for Testing and Materials, West Conshohocken,
PA.
Randy Segawa
January 27, 2011
Page 16
Marty, M., F. Spurlock and T. Barry. 2010. Volatile Organic Compounds from Pesticide
Application and Contribution to Tropospheric Ozone. Chapter 19, In: Hayes’ Handbook of
Pesticide Toxicology. R. Krieger, ed., Elsevier Press.
McKinney, M. 2008. Analysis of Anomalously High Emission Potential Values for Certain
Spray Oil Products . Available at:
<
Oros, Daniel R. 2009. Pilot Project Proposal: Estimating Pesticide Product Volatile Organic
Compound Emission Speciation and Reactivity Based on Product Composition. Memorandum to
Randy Segawa, Environmental Monitoring Branch, Department of Pesticide Regulation,
Sacramento, California. August 17, 2009. Available at:
<
Ross, L.J., S. Nicosia, K.L. Hefner, D.A. Gonzalez, and M.M. McChesney. 1989. Volatilization,
off-site deposition, dissipation, and leaching of DCPA in the field. DPR EHAP Report 89-02.
Available at: <
Seiber, J.N. and M.M. McChesney. 1988. Measurement and computer model simulation of the
volatilization flux of molinate and methyl parathion from a flooded rice field. DPR EHAP
Report 88-07. Available at: <
Seiber, J.N., M.M. McChesney and M. Majewski. 1991. Volatilization rate and downwind
contamination from application of dacthal herbicide to an onion field. Final Report DPR contract
7820. Available at: <
SPARC. SPARC Performs Automated Reasoning in Chemistry. Web site:
< />. September 2009 release w4.5.1522-s4.5.1522.
Taylor, A.W. and D.E. Glotfelty. 1989. Chapter 4: Evaporation from Soils and Crops. In: R.
Grover Ed. Environmental Chemistry of Herbicides, Volume 1. CRC Press, Boca Raton, Fl.
Yates, S. 2006a. Measuring herbicide volatilization from bare soil. Environ. Sci. Technol.
40:3223-3228.
Yates, S. 2006b. Simulating herbicide volatilization from bare soil affected by atmospheric
conditions and limited solubility in water. Environ. Sci. Technol. 40:6963-6968.
Department of Pesticide Regulation
Mary-Ann Warmerdam
Director
M E M O R A N D U M
Edmund G. Brown Jr.
Governor
1001 I Street • P.O. Box 4015 • Sacramento, California 95812-4015 • www.cdpr.ca.gov
A Department of the California Environmental Protection Agency
Printed on recycled paper, 100% post-consumer processed chlorine-free.
TO: Randy Segawa
Environmental Program Manager I
Environmental Monitoring Branch
FROM: Frank C. Spurlock, Ph.D. Original signed by
Research Scientist III
Environmental Monitoring Branch
916-324-4124
DATE: January 28, 2011
SUBJECT: RESPONSE TO STAKEHOLDER COMMENTS ON PROJECT REPORTS:
ESTIMATING PESTICIDE PRODUCT VOLATILE ORGANIC COMPOUND
EMISSION SPECIATION AND REACTIVITY BASED ON PRODUCT
COMPOSITION
INTRODUCTION
The Department of Pesticide Regulation (DPR) invited stakeholder comment on two documents:
ESTIMATING PESTICIDE PRODUCT VOLATILE ORGANIC COMPOUND OZONE
REACTIVITY. Part 1: Speciating VOC Emissions using Confidential Statements of Formula,
September 15, 2010 DRAFT, D. Oros and F. Spurlock
ESTIMATING PESTICIDE PRODUCT VOLATILE ORGANIC COMPOUND REACTIVITY.
Part 2: Reactivity-weighted emissions, September 15, 2010 DRAFT, D. Oros and F. Spurlock
These two reports summarize the results of a pilot DPR research project to evaluate scientific
issues, uncertainties, and potential approaches for incorporating ozone reactivity into DPR’s
inventory of volatile organic compound (VOC) emissions. The initial project proposal (Oros,
2009) stated “DPR emphasizes that this is a proposal for an investigation to identify scientific
questions and answers, as opposed to a proposal to implement new regulations at this time.”
In
previous responses to stakeholders (Spurlock and Oros, 2009), DPR stated that “DPR does not
propose to promulgate regulations or otherwise implement reactivity concepts into the VOC
inventory at this time.”
In inviting comments on part 1. and part 2 memorandum above, DPR
asked stakeholders:
• to focus their comments on the scientific/technical aspects of the documents, and
• that comments on policy issues or impacts on the state implementation plan (SIP) were not
relevant.
Comments were submitted by the U.S. Environmental Protection Agency, (U.S. EPA), Region
IX , Dow Agrosciences (DAS), the Western Plant Health Association (WPHA) and Exxon Mobil
Randy Segawa
Janaury 28, 2011
Page 2
Chemical Company (EMCO). This memorandum summarizes DPR’s responses to submitted
comments.
A. Department of Pesticide Regulation general response to all stakeholders
A1. Relevance
. Several people provided comments that were not relevant to the scientific and
technical evaluation of the two reactivity pilot project documents listed above. These included,
among others, extensive discussion of the suitability of the currently accepted thermogravimetric
analysis (TGA) method for determining pesticide product emission potential (EP), applicability
of TGA to field conditions, the concept of “atmospheric availability,” the putative need for NOx
controls in conjunction with VOC controls to reduce ozone in certain geographic areas, and the
need for development of nonfumigant emission adjustment factors to account for environmental
fate processes that may mitigate nonfumigant VOC emissions.
DPR has previously responded to
these comments in letters to the WPHA dated October 20, 2008, and May 2, 2007, and in a 2009
memorandum (Spurlock and Oros, 2009).
In this document, DPR does not respond to any
comments that are not directly relevant to the scientific/technical content of the two reactivity
pilot project documents listed above.
B. U.S. Environmental Protection Agency comments
B1. General Issue - Handling Confidential Business Information
“The Clean Air Act (CAA) contains specific requirements which give the public access to any
records, reports or information obtained by EPA except in cases where trade secrets are
involved.” The comment goes on to describe potential conflict between confidential product
composition information and CAA/SIP requirements that emissions data are public information.
DPR’s Response
This comment is outside the specific scientific/technical scope of the two documents.
B2.
Thermogravimetric Analysis
“The TGA method, along with precision and bias data, should be submitted for approval if it will
be used to determine compliance with a SIP approved rule.”
DPR’s Response
This comment on SIP requirements is outside the specific scientific/technical scope of the two
documents.
B3. Reactivity-based regulation
“EPA has only allowed in very limited cases, the use of low vapor pressure as a condition to
exclude a compound from a VOC limit. However, under a reactivity-based regulation, all VOCs
should be counted as they all contribute to ozone formation, although at different rates."
Randy Segawa
Janaury 28, 2011
Page 3
DPR’s Response
This comment is outside the specific scientific/technical scope of the two documents.
B4. Referring to the Part 1. document
Page 11 concludes there is evidence that DPR’s basic assumption that “the composition of all
products that share the same primary EPA registration number are substantially the same” may
not always be true. DPR concludes this may be problematic for estimating emissions. Can DPR
estimate how large or small this issue may be?
DPR’s Response
We are not sure whether, or how important, this putative issue might be. We anticipate the
further analyses of product CSFs, as recommended in the Part 1 and Part 2 reports, may provide
more information by allowing us to compare CSFs and TGA data of more products that share a
common EPA registration number.
B5. Referring to Document 2
“To estimate the ozone forming potential of the unspeciated nonfurnigant products, DPR
“assumes that the overall reactivity of unspeciated mass emissions is equivalent to the mean
reactivity of the speciated product emissions". It is not clear why using the "mean reactivity” of
the speciated emissions, which represent 32 and 34% of the SJV nonfumigant ozone season
emissions, is an appropriate and conservative assumption to scale up the unspeciated
nonfumigant fraction. “
DPR’s response
The Part 2 report provides an illustrative example of estimating pesticide product VOC reactivity
across the entire inventory. Given the limited scope of this pilot project, only a relatively small
number of product CSFs were analyzed to provide product speciation data. If DPR decides to
transition to a reactivity-based inventory, DPR recognizes that a larger set of products would
have to analyzed. One the other hand, there will always be at least some products for which data
will not be available so that speciation would have to be estimated. This would be analogous to
defining default emission potentials as is currently done for certain products.
Change to DPR documents in response to comment B5, new text added in italics
The conclusion of Document 2 states that the two reports “provide the outline of a scientifically
defensible method to incorporate reactivity into DPR’s current mass-based VOC inventory.”
Additional work remains, including more accurate characterization of certain component
reactivities [e.g. aromatics (Carter, 2009a; selected semi-volatile active ingredients; Table 2],
additional analysis of pesticide product CSFs and TGA data to explicitly speciate a larger
portion of the inventory, and additional analysis to refine the current vapor pressure cutoff
(0.05 Pa) used to discriminate between volatile and nonvolatile product components.
Randy Segawa
Janaury 28, 2011
Page 4
C. Western Plant Health Association comments
C1
WPHA expressed concern over maintaining confidentiality of product formulation data used to
speciate emissions.
DPR’s Response
This comment is outside the specific scientific/technical scope of the two documents.
C2. WPHA states
“We also continue to urge the DPR to include application factors for nonfumigant products as
they’ve done with fumigants. The easiest way to begin, as a first step, would be to include a
factor for soil incorporated herbicides and insecticides.”
DPR’s Response
This comment is outside the specific scientific/technical scope of the two documents.
C3. WPHA states
“WPHA is concerned with the new definition for VOCs that establishes a cutoff of 0.05 Pa. This
proposed standard is inconsistent with other VOC definitions in the industry and other regulatory
authorities.”
DPR’s response
DPR did not propose a new definition for VOCs in the two documents. The vapor pressure cutoff
was determined to identify which product components volatilize under TGA conditions. The
regression analysis indicates that 0.05 Pa is an approximate vapor pressure dividing line for
discriminating between chemicals that are volatile under TGA conditions and those that are not.
C4. WPHA states
“WPHA provides several comments and extensive discussion of the current TGA emission
potential determination procedure, concluding: “As a consequence of a VOC limit of 0.05 Pa,
products previously dismissed (<20% EP) would be brought back into the pesticide VOC
inventory.”
DPR’s response
See General Comment A1.
C5. WPHA states
“WPHA recommends the DPR evaluate whether current VOC regulations and reformulation
requirements are working.”
Randy Segawa
Janaury 28, 2011
Page 5
DPR’s Response
This comment refers to policy, so is outside the specific scientific/technical scope of the two
documents.
C6
“WPHA recommends the DPR keep TGA as the primary initial screen for estimating
emission potential, permit use of the CSF as the alternative method to estimate emissions
potential where TGA data are not available, but also include the ability for further refinements
based on atmospheric availability. There is no scientific or regulatory need to set such a low
VOC standard as the proposed 0.05 Pa value.”
DPR’s response:
See General Comment A1.
C7
“WPHA is concerned DPR would use the most conservative MIR over EBIR. Further, we
question if even the EBIR is adequate, given fluctuations in NOx levels. Is there an opportunity
to consider another method even better than the EBIR that would represent ambient NOx levels,
such as an “ambient air incremental reactivity?”
DPR’s response
DPR has not committed to using MIR, EBIR or any other particular reactivity scale at this time.
C8
“Use of reactivity factors has gained some attention in California due to successful ozone level
reductions in urban areas where VOC levels are the limiting factor. However, reductions in rural
areas where NOx is the limiting factor have not proven so successful. Application of incremental
reactivity does not fully account for ambient atmospheric conditions in rural or agricultural areas
where the available NOx level is low, or even depleted due to the underlying high VOC levels.”
DPR’s response
See General Comment A1.
C9
“WPHA would like to have a better understanding of how the DPR would use reactivity for
estimating SOFP (Specific Ozone Formation Potential). Which method would be used, which
incremental reactivity factor(s) would be applied to the San Joaquin Valley air shed (Non-
Attainment Area 5), how would reactivity factors be applied, and how would this change in
procedures impact the State Implementation Plan (SIP) for pesticides?” . . . “It is also unclear
how new data would be included in the inventory. Would the inventory be adjusted or
recalculated? Use of reactivity would significantly impact the estimated inventory baseline and
Randy Segawa
Janaury 28, 2011
Page 6
any resultant obligations to reduce baselines” . . . . . “The lack of clear direction of how reactivity
would be used still does not get to the heart of the matter, which is the reaction-limiting NOx
levels present in rural or agricultural air sheds. . . . ”
DPR’s Response:
As DPR noted to stakeholders, stakeholder comments on policy issues or impacts on the SIP
were not relevant. The WPHA comment is outside the specific scientific/technical scope of the
two documents.
C10
“The determination of unspeciated VOCs based on Equation 3, using average speciation
reactivity factors, raises some concern.”
DPR’s response
See response to comment B.5.
C11
“Incorporating reactivity would not be consistent with how “consumer products”
pesticides are evaluated.”
DPR’s Response
This comment is outside the specific scientific/technical scope of the two documents.
C12
“WPHA believes it is premature to discuss further changes to the existing inventory method if
there is no need to do so.”
DPR’s Response
This comment is outside the specific scientific/technical scope of the two documents.
D. Dow Agrosciences comments
D1
“. . .
the proposed approaches for inserting reactivity into the current mass-based VOC
emission regulations and a new more stringent definition of VOC raise some concerns” . . . “Dow
AgroSciences also reformulated other products to reduce their estimated VOC emissions potential.”
DPR’s Response
This comment is outside the specific scientific/technical scope of the two documents.
Randy Segawa
Janaury 28, 2011
Page 7
D2
“
Speciation to Predict Estimated VOC Emissions”. . . . “we do not believe speciation should be a method
initiated by DPR for existing registered products.”
DPR’s Response
DPR plans to retain TGA as the primary method for determining EPs. However DPR also plans to use
CSF analysis on a case-by-case basis to estimate EPs when TGA data are unavailable or to troubleshoot
questionable TGA-based EPs.
Change to DPR document 1, Conclusion section in response to comment, new text added in
italics
“DPR plans to retain TGA as the primary method for estimating product emission potentials. In spite of
the small bias, these data support the use of CSF analysis in both review of TGA data and for speciating
TGA emissions. Detailed CSF analysis should be viewed as complementary to the TGA EP determination
method . . . Use of both TGA and CSF data to determine EPs will improve the accuracy of the inventory.”
D3
“III. Proposed new VOC Standard’ . . . “The proposed new VOC cut-off of 0.05 Pascals appears to be a
new definition for a VOC.”
DPR’s Response
The 0.05 Pa cutoff is not a definition for a VOC. See response to comment C3.
D4
“IV. Reactivity proposal further overestimates VOC emissions”. . .
“We acknowledge the Department’s
inclusion of Equal Benefit Incremental Reactivity (EBIR) to more closely approximate rural air sheds.
However, the proposal stops short of defining when MIRs vs. EBIRs would be appropriate. This would be
critical to a registrant’s understanding to accomplish “real” reductions. We respectfully recommend the
research proposal should clearly detail what specific circumstances it proposes to employ MIRs vs.
EBIRs.”
DPR’s response
DPR has not committed to using MIR, EBIR, or any other particular reactivity scale at this time.
E. Exxon Mobil Chemical Company Comments
**** EMCO Comments on report #1 ****
E1
“VOC reductions, on any basis (mass or reactivity), will only be effective in reducing ozone in
an area that is VOC-limited or that is transitional between VOC and NOx limited. Negligible
changes to improve air quality would be expected in NOx-limited areas . . . .”
Randy Segawa
Janaury 28, 2011
Page 8
DPR’s Response
This comment is outside the specific scientific/technical scope of the two documents.
E2
“ExxonMobil believes that, as a first step, air quality modeling (such as the Comprehensive Qir
Quality Model with Extensions, Community Multi-Scale air QualityModel) should be conducted
to understand the parameters that impact air quality in California’s agricultural air sheds.”
DPR’s Response
This comment is outside the specific scientific/technical scope of the two documents.
E3
“Environmental fate, atmospheric availability and product life cycle considerations are critical to
understanding and assessing overall impacts on VOC emissions and ozone (O3) formation
potential from pesticide products.”
DPR’s response
See General Comment A1.
E4
“The creation of a CDPR VP cut-off results in another, new definition for a VOC.”
DPR’s Response
The 0.05 Pa cutoff is not a definition for a VOC. See response to comment C3.
E5.
“CDPR’s initial calculation of a vapor pressure (VP) cut-off is based on a limited
dataset, thus it is premature determine a VP cut-off of 0.05 Pa.” . . . .“ExxonMobil agrees with
CDPR that more data points are needed to determine a VP cut-off, and that multiple cut-off
values should be evaluated with appropriate statistical analyses before concluding on a defined
VP VOC cut-off.”
DPR’s Response
DPR and EMCO are in agreement that the 0.05 VP cutoff is approximate and that more data are needed.
No response is necessary.
E6
“CDPR should document their assumptions that the use of the short-term, high temperature TGA
emissions potential (EP) data can be used to extrapolate field conditions where temperatures do not
approach the 115C/80 minute maximum test TGA test regimen.”
Randy Segawa
Janaury 28, 2011
Page 9
DPR’s response
See General Comment A1.
E7
“Current approach proposed by CDPR assumes 100% EP for non-fumigants, whereas, certain liquid
formulations may have physical-chemical characteristics that retard emission rates and are recognized to
absorb/absorb to soil, further limiting potential emissions.”
DPR’s response
See General Comment A1.
E8
“CDPR should correct VP values presented in Table 2 and ensure that the values they are using are in
their calculations are relevant for the products under evaluation.”
DPR’s response
The vapor pressure values in Table 2 were changed. This has no effect on the final results.
**** EMCO Comments on report #2 ****
E9
“EMCO has concerns with three assumptions: 100% of the estimated VOC is volatilized, whereas
there are methodologies to estimate adsorption/absorption of VOC components,” . . . “100% of the
estimated VOC content reacts to form O3, thus ignoring alternate environmental fates and atmospheric
availability”. . . “a single application method adjustment factor of 1.0 is sufficient for all non-fumigant
products.”
DPR’s response
See General Comment A1.
E10
“CDPR should determine and apply the most appropriate reactivity metric for the agricultural air sheds.”
DPR’s response: DPR has not committed to using MIR, EBIR or any other particular reactivity
scale at this time.
E11
“CDPR should take into account and incorporate environmental fate and atmospheric availability
concepts into the product adjustment factors.”
DPR’s response
See General Comment A1.