Tài liệu Nonequilibrium transport and sorption of organic chemicals during aquifer remediation doc
Bạn đang xem bản rút gọn của tài liệu. Xem và tải ngay bản đầy đủ của tài liệu tại đây (1.42 MB, 20 trang )
HydrologicalSciences-Journal-des
Sciences
Hydrologiques,
42(2)
April
1997
245
Nonequilibrium
transport and sorption of organic
chemicals
during aquifer remediation
CORS
VAN DEN BRINK
IWACO,
Consultants
for
Water
&
Environment,
PO Box
8064,
9702
KB
Groningen,
The Netherlands
WILLEM
J. ZAADNOORDIJK
[WACO,
Consultants
for
Water
&
Environment,
PO Box
8520,
3009 AM
Rotterdam,
The Netherlands
Abstract Aquifer remediation operations are often behind schedule. Usually, a rather
sharp concentration decrease shortly after the start of an operation is followed by a
situation in which hardly any concentration decrease is observed. Furthermore, the
concentration increases after stopping the groundwater recovery. These phenomena
are caused by so-called tailing. An important cause of tailing is the phenomenon that
equilibrium is not reached for some of the transport and sorption processes involved.
To predict these effects of tailing, IWACO has developed a program SORWACO,
which describes the behaviour of solutes along a path line. Processes for which
equilibrium is reached quickly as well as processes for which equilibrium is reached
only slowly are taken into account. The program has been verified against break-
through curves observed in column experiments reported in the literature. The
program parameters were calibrated using the data of several experiments. The
resulting set of parameter values accurately described the transport for different flow
velocities. The fact that quite good results can be obtained without a lot of data from a
specific site makes the program a valuable tool for the design of remediation
operations. The program is especially useful when extensive input data are not
available so that detailed three-dimensional or stochastic models cannot be applied.
The use of the program is illustrated by means of a case study. The progress was
monitored and the data show good correspondence with the predictions of the
program.
Transport
et désorption différences de produits chimiques
organiques
pendant la restauration d'un aquifère
Résumé Les opérations de restauration d'aquifères interviennent souvent tardivement.
En général, la concentration élevée en éléments chimiques indésirables décroît
rapidement dès le début de l'opération, puis intervient une période pendant laquelle la
diminution de concentration est à peine observable. Parfois même, la concentration
augmente à nouveau après l'arrêt du traitement des eaux souterraines. Ce phénomène
est causé par un transport et une désorption retardés (tailing). Ce retard est lié au fait
que l'arrêt de l'opération ne signifie pas que l'équilibre est atteint pour le transport et la
désorption des éléments. Afin de prédire les effets de ce retard, IWACO a développé
le programme informatique de modélisation, SORWACO, qui décrit le comportement
des substances en solution le long d'un filet d'écoulement. Aussi bien les processus
pour lesquels l'équilibre est atteint rapidement que ceux pour lesquels il est atteint
lentement ont été pris en compte. Le programme a été vérifié par rapport aux courbes
de dégradation observées sur colonnes expérimentales et décrites dans la littérature.
Les paramètres du programme ont été calés en utilisant les données de plusieurs
expérimentations. Les valeurs des paramètres obtenues décrivent précisément le
transport pour différentes vitesses d'écoulement. Le fait que de bons résultats puissent
être obtenus sur un site spécifique même en l'absence d'un grand nombre de données
le concernant, fait que le programme est un outil fiable pour la conception des
opérations de restauration. Le programme est en particulier utile lorsque des modèles
tridimensionnels ou stochastiques détaillés ne peuvent être utilisés par manque de
données de base en quantité suffisante. Dans cet article, l'utilisation du programme est
Open for
discussion
until I
October 1997
246
Cors
van den Brink
& Willem
J.
Zaadnoordijk
illustrée par une étude de cas. L'avancement de l'opération a fait l'objet d'un suivi et
les résultats des mesures présentent une bonne correspondance avec les prédictions
faites initialement avec le programme.
INTRODUCTION
The design of an aquifer remediation operation is merely a case of practical
experience today. The contaminant is flushed out of the soil by means of a system of
injection and recovery wells. The time needed and the amount of water that has to be
flushed through the soil to reach a certain required concentration are both important.
The amount of water is expressed in terms of the so-called flush factor, which is
equal to the ratio of the volume of this water and the volume of the pores in the soil
to be flushed.
The time needed and the amount of water (flush factor) are estimated based on
experience with similar types of pollutants and soils. In this way, processes and para-
meters which determine the course of the remediation are taken into account only
indirectly. Moreover, it is not possible to gain insight in a particular situation by
determining the influence of various parameters. Some important influences are:
- equilibrium amount of sorption;
- kinetics of sorption;
- variation in flow velocities of the soil liquid caused by heterogeneities in the soil;
and
- kinetics of exchange between portions of the soil liquid phase with different flow
velocities.
IWACO has developed the program SORWACO to increase insight into the
influence of the individual processes and parameters on the course of the remediation
with the possibility of intermittent recovery. The program calculates the changes of
the pollutant concentration along its path through the soil and as a function of time.
This pathline has to be split up into a number of cells, which have fixed positions
that do not change with time. The parameters may have different values for each cell
(e.g. bulk density, porosity, and organic carbon content of the soil).
The equilibrium of the pollutant between the groundwater and the solid phase of
the soil is described by a Freundlich isotherm. This nonlinear sorption isotherm does
not vary in time.
Sorption takes place at the so-called "sorption sites" of the soil. Two classes of
sorption sites are distinguished (Boesten, 1986; Brasseau, 1992b). The sorption sites
of class 1 are continuously in equilibrium. The class 2 sorption sites are not
continuously in equilibrium with the soil solution. The rate of (de)sorption at class 2
sites is driven by the shortage (or excess) of the sorbed amount relative to the
concentration in the soil liquid phase, which in turn depends on the properties of the
solute/soil combination and the velocity of the groundwater. When such a sorption
shortage or excess exists one talks about "sorption related nonequilibrium".
The soil liquid phase is divided into a fast and a slow moving portion to account
for the variations in velocity that occur in a porous medium. The exchange of
pollutant between these portions is driven by the concentration difference and is
Nonequilibrium transport
and
sorption
of
organic chemicals
during aquifer remediation 247
further determined by the extent of the slow and fast moving portions of the liquid
phase, the respective velocities, and the diffusivity. A "transport related
nonequilibrium" exists if the concentrations are not equal and there is exchange
between the portions of the liquid phase.
The program SORWACO takes both the transport and sorption related
nonequilibrium into account. It calculates the concentration of the pollutant in each
cell at every time step. The concentration in the water flowing out of the last cell is
the concentration of the water that enters the purification or discharge system.
It is possible to calculate the impact of intermittent groundwater recovery on both
the decrease of the concentration during the recovery and the increase when the
recovery is stopped. The groundwater flow is assumed to be steady. Changes in the
flow pattern are not accounted for. When intermittent recovery is considered, it is
assumed that the flow directions remain the same so that the groundwater flow
pattern does not change. Only the size of the flow velocity is different. The
calculations describe the behaviour of one substance. Interaction with other
chemicals, like cation exchange reactions or precipitation reactions, is neglected.
The time needed to reduce the concentrations to the required values and the
flush-factor can be derived directly from the output of SORWACO. In this way the
program can be used during the design of an aquifer remediation operation. Usually
the prediction is evaluated and adjusted during the operation resulting in an improved
prediction for the following periods of the operation.
THEORY
Recent literature shows that much has been learned about the effects of diffusion,
dispersion, advection and adsorption on chemical transport in soils (van Genuchten &
Wierenga, 1976; Goltz & Roberts, 1988; Ptacek & Gillham, 1992). Numerous
models have been developed in attempts to describe the one-dimensional transport of
chemicals. These models are important because they continuously increase insight
into the basic transport mechanisms involved and, consequently, improve the
capability to predict the fate in the soils of such diverse chemicals as pesticides,
chlorinated hydrocarbons and heavy metals.
In SORWACO, the solute transport is assumed to be one-dimensionally
advective and dispersive. The conservation equation states that the change of the total
mass concentration C in the system must match the gradient of the advective and
dispersive flux /plus the decay R, (e.g. Bolt, 1982):
where t indicates time and x the ordinate along the pathline of the groundwater flow
[L].
The total amount C, the flux J, and the decay R, are given by:
C
= cB + pS
(2)
248
Cors
van den Brink
& Willem
J.
Zaadnoordijk
J = QVC<D
%
} (3)
R,=
k,c (4)
in which c denotes the concentration in the soil liquid phase, 9 the volumetric
soilwater content [L
3
L"
3
], p the bulk density of the soil [M L/
3
], S the adsorbed
concentration [M M"
1
], v the average pore water velocity [L t"
1
], D the dispersion
coefficient and k, the decay rate.
Equations (1) to (4) do not suffice for the description of contaminant transport
which includes tailing. Two phenomena will be added to arrive at a set of equations
that is capable of simulating properly transport with tailing: transport related non-
equilibrium and sorption related nonequilibrium.
Transport related nonequilibrium
Equations (1) to (4) imply that single values of the velocity and of the dispersion
coefficient describe the advective and dispersive transport of the entire soil liquid
phase. This results in the calculation of effluent curves which are characteristically
sigmoidal or symmetrical in shape. However, experimental curves often show a
much earlier breakthrough and a much longer tailing. This extreme tailing does not
occur only in unsaturated soils (van Genuchten & Wieringa, 1976; Boesten, 1986)
but also in saturated soils (Goltz & Roberts, 1988; Ptacek & Gillham, 1992).
One approach by means of which this extreme tailing can be accounted for is the
introduction of regions within the soil liquid phase that have different flow velocities.
Coats & Smith (1964) used a mobile and an immobile region. Leistra (1977) used a
region with a low velocity instead of an immobile region. Stagnitti et al. (1993) used
a larger number of regions each having a different velocity. Advective solute
transport is more important in the regions with higher velocity, while the solute flux
in the slower regions is mainly controlled by diffusion through those regions. The
physical structure of the soil is responsible for the differences in groundwater
velocity. Slow moving portions will occur, for instance, within loamy layers in a
sandy aquifer.
Dividing the liquid phase into a fast and slow moving portion, the conservation
equation (1) can be written as:
dC
f
dj
f
"àT
=
&•-*'•'-•'/-
(5a)
dt dx
-Ru+Jf^,
(5b)
where the subscripts / and s refer to fast moving and slow moving liquid regions
respectively, and J
Hs
is the exchange between the fast moving and slow moving
liquid phase:
Nonequilibrium transport and sorption of
organic chemicals
during aquifer
remediation
249
Jf^„=k
s
j(c
f
-C
s
) (6)
The mass transfer coefficient, k
sf
, in equation (6) determines the rate of exchange
between the two liquid regions. This rate is proportional to the difference in
concentration between the fast and slow moving portions of the soil liquid phase.
In the derivation of equations (5) and (6) no restrictions have been made on the
adsorption in both regions. Thus, the adsorption around the larger pores (fast moving
portion) can be different from that of the micropores (slow moving region) in
SORWACO, as is the case in reality.
Sorption related nonequilibrium
The equations presented so far do not describe the relationship between the adsorbed
concentration S and the solute concentration c. In the literature both equilibrium
(Bolt, 1982) and nonequilibrium equations (Boesten, 1986; Brusseau, 1992a,b) are
available for this purpose. Nonlinear equilibrium isotherms do not provide a
satisfactory explanation of the asymmetrical and nonsigmoidal curves of concentra-
tion vs time that are observed during groundwater remediations of organic chemicals.
Further improvement can be realized by a two-site adsorption mechanism (Boesten,
1986;
van den Brink, 1987). Such a mechanism accounts for the fact that the various
constituents of the solid phase (e.g. soil minerals, organic matter, aluminium and
iron oxides) are likely to react differently with a dissolved chemical.
In the two-site sorption model, the sorption sites are divided into two fractions.
Adsorption on one fraction (class 1 sites) is assumed to be instantaneous, while
adsorption on the other fraction (class 2 sites) is thought to be rate limited, so that
equilibrium is not reached. This is called sorption related nonequilibrium. The total
adsorption, S, is equal to the sum of the amount sorbed by the class 1 sites S
x
and the
amount sorbed by the class 2 sites S
2
:
S
=
S,+S
2
(7)
At equilibrium, the amount sorbed by both types of sites is described by the
Freundlich isotherm:
Si,equilibrium = F\KpC " = S] (8)
^equilibrium = Fl Kf C (9)
where F
l
and F
2
refer to the ratio between the class 1 and class 2 sorption sites. For
field application there is usually no information on the values of F, and F
2
. A value
of 0.7 is then used for F,. This value is based on measurements on adsorption
kinetics carried out by Boesten (1986). The parameter K
F
denotes the Freundlich
sorption coefficient [L
3/n
M"
1/n
] and n the Freundlich exponent. It is assumed that K
F
is the same for both the class 1 and class 2 sites because sufficient information on the
sorption is not available for field sites (Brusseau, 1992b). It may be concluded from
the experimental work of Boesten (1986) that the total amount of sorption sites
250
Cors
van den Brink
& Willem
J.
Zaadnoordijk
exceeds the amount measured in short term sorption experiments. The practical
consequence of these results is that the sum of the parameters F
x
and F
2
may
exceed 1. This phenomenon is of great importance for remediation operations in
which time-dependent desorption is one of the factors that cause tailing.
The sorbed concentration at the class 1 sites, S,, can be calculated from
equation (7). The amount at the class 2 sites is not directly related to the
concentration in the soil liquid phase, but the rate of change is (Boesten, 1986; van
den Brink, 1987):
^
1
=
k
d2
(F
2
K
F
c
l/
"-S
2
) (10)
ot
where k
d2
is a first-order rate coefficient and
F
2
K
F
c
v
"
the equilibrium amount sorbed
at the class 2 sites corresponding to the current soil liquid concentration c
(equation (8)).
This approach, in which the sorption and transport related nonequilibrium are
described explicitly, is using almost the same theoretical framework as the two-
domain approach of Brusseau (1992b). A difference is the capability of SORWACO
to describe the sorption by a nonlinear sorption isotherm. In addition, the soil liquid
is divided into two regions with different flow velocities, instead of a mobile and an
immobile region. However, the main difference consists of concepts which facilitate
practical use:
- SORWACO describes the transport along a pathline in three-dimensional
groundwater flow (and not uniform flow);
- SORWACO uses the concentrations in the soil liquid phase as input, and
calculates the total mass which is usually not measured; and
- parameter values from the literature work well with SORWACO (except for
organic carbon content for which some measurements are usually available).
In practical cases, the first goal of a field investigation is to determine the extent
of the contamination. In an early stage of the investigation, not much effort is given
to the collection of data that are needed to predict the duration of the aquifer
remediation. In a later stage, when it has been decided to carry out a remediation,
additional data can be collected to establish better input data for SORWACO.
Moreover, as results of the remediation become available, they can be used to further
improve the SORWACO model.
IMPLEMENTATION IN THE PROGRAM SORWACO
Equations have been given in the previous sections for the fast and slow moving
region and the class 1 and class 2 sites separately. The way they are implemented in
the program SORWACO is illustrated in Fig. 1. The two soil liquid regions are
indicated by boxes as well as the solid phase. The sorptions by the class 1 and class 2
sites have been indicated by the "equilibrium sorption" and the "nonequilibrium
sorption" arrows respectively.
The volumetric flux, q, is related to the velocity and can be written as:
Nonequilibrium transport and sorption of organic chemicals during aquifer remediation 251
f
flux
out
fast moving
portion
groundwater
physical
exchange
flux
in
equilibrium sorption
slow moving
portion
groundwater
t
Fig. 1 Setup of SORWACO.
non-equilibrium
sorption
equilibrium
sorption
q = Qv = 0yV/ + 0.vV,
(11)
where the subscripts/and s refer to the fast and slow moving regions respectively.
The total amount C can be split into parts associated with the slow and fast
moving portions of the soil liquid phase:
C = C
x
+ C
f
(12)
The amount in the slow moving soil liquid phase is equal to (equations (2) and (7)):
C, =
e,c.,
+
p(l-/)(S
u
+5
2
,,) (13)
where S
s
is the adsorbed concentration related to the slow moving region of the soil
(expressed per unit mass of soil assigned to this region) and / is the mass fraction of
the solid phase assigned to the fast moving region.
Since only class 1 sites are associated with the fast moving soil liquid phase, the
total amount in this phase is given by:
C,=Q
f
c
f
+
fpS
if
(14)
where S
f
is the adsorbed concentrations related to the fast moving region of the soil
(expressed per unit mass of soil assigned to this region).
Initially, the solid phase is in equilibrium with the liquid phase:
C =fi r
^.( initial ".vS-
l+
p^(F
1+
F
2
)(l-/)(c
v
,
iml
(15)
252
Cors
van den Brink
& Willem
J.
Zaadnoordijk
C/initial - 9/ C/initial + P K
F
F
y
/(C/initial) (16)
The equations (2), (3), (4), (5a), (5b), (6), (11), (13) and (14) describe the system
operation together with the initial conditions of equations (15) and (16) and boundary
conditions. The concentration in the water flowing into the model on one side is
equal to a specified value of the background concentration. On the other side, the
water leaves the model with the concentration calculated for the final cell.
The equations are converted into an iterative finite difference algorithm. The
iterations are necessary since the amount sorbed by the class 1 sites depends
nonlinearly on the soil liquid concentration (equation (8)). Therefore this amount is
calculated by applying equations (8) and either (13) or (14) alternatively at the
beginning of each time step. At the end of each time step the values of the total
amounts, C
s
and C
f
, are calculated by means of equations (5a) and (5b).
COMPARISON WITH COLUMN EXPERIMENTS
Use of the program SORWACO was evaluated by comparing the laboratory results
of column experiments from the literature with the breakthrough curves calculated by
means of SORWACO. The impact of variations in pore water velocity on the
nonequilibrium sorption and transport of organic chemicals was investigated by
Brasseau et al . (1991) and Brusseau (1992a). In those studies, miscible displacement
experiments were carried out with different organic chemicals and aquifer media
having low organic carbon contents (0.02-0.39%). Four column experiments were
evaluated. The experiments analysed, with respect to the type of sorbent, chemical,
and (nonequilibrium) parameters, are listed in Table 1. The values of the parameters
F
l
and F
2
have been taken from Brusseau (1992a) initially and verified during the
calibration. The dispersion coefficient D has been assumed to be equal to zero.
The parameters for the Lula medium were calibrated using the breakthrough
curve for the low pore water velocity (5 cm h
1
) only. Next the breakthrough curve
for the high velocity (45 cm h') was predicted and matched the measured values well
(Fig. 2). The calibration was carried out with a least-squares criterion. The root
mean square (RMS) of the residuals was equal to 0.021 for the calibrated low
Table 1 Type of sorbent, chemical and (nonequilibrium) parameters used in the column experiments
(Brusseau, 1992a).
Sorbent*
Eustis
Eustis
Lula
Lula
Chemical"
TCE
TCE
NAP
NAP
V
(cm h"
1
)
0.4
86
4
45
K
F
""
(ml g
1
)
0.27
0.27
0.21
0.21
(h
1
)
0.003
0.003
0.01
0.01
(h
1
)
0.70
0.70
0.07
0.07
/
0.5
0.5
0.7
0.7
*",
0.5
0.5
0.7
0.7
F
2
0.5
0.5
0.3
0.3
V
A
l.i
l.i
1.2
1.2
Lula: OC = 0.02%; sand = 91.0%; silt = 5.6%; clay = 3.4%; p = 1.52 g cm
3
; 0 = 0.32;
Eustis: OC = 0.39%; sand =
95.5%;
silt = 3.2%; clay = 1.3%; p = 1.70 g cm'
3
; 6 = 0.41.
NAP = naphthalene; TCE = trichloroethene;
Freundlich exponent n = 1.
Nonequilibrium transport and sorption of
organic chemicals
during aquifer remediation 253
o
O
0.8-
0.6-
0.4-
0.2-
0-
J*5
È
m
-4
f
J
i _
r
iH|Ljl
•t^fB==l
^=
=*F «" a»
4 5 f
Flux
Factor
10
Brusseau
[1992]
+ v=5
cm/hr
•
v=45
SORWACO
— v=5
cm/hr
v=45
Fig. 2 Measured (Brasseau, 1992) and calculated (SORWACO) breakthrough curves
for Lula medium.
0.6
o
œ 0.4
0.2
-
-
1
•
/
/
7
/ i
it
If
r
^i-
»______
B8
Brusseau
[1992]
+
v=0.4
cm/hr
4 5 6 7
Flush
Factor
SORWACO
v=0.4
cm/hr
—
8 9 10
—-
v=86
Fig. 3 Measured (Brusseau, 1992) and calculated (SORWACO) breakthrough curves
for Eustis medium.
velocity breakthrough curve. The RMS of the residuals for the predicted values of the
high velocity experiment was 0.043.
For the Eustis medium, the parameters could not all be calibrated using only the
low velocity experiment. However, the combined calibration of both the low and the
high velocity experiment showed that they could be described with one single set of
SORWACO parameters. The RMS of the residuals was 0.039 for the low and 0.016
for the high velocity experiment respectively. The breakthrough curves are given in
Fig. 3.
254
Cors
van den Brink
& Willem
J.
Zaadnoordijk
The calibration resulted in higher values for k
dl
than for k
st
This implies that the
asymmetry of the breakthrough curves is mostly due to transport related non-
equilibrium at low pore water velocities and to sorption related nonequilibrium at
high velocities.
The leftward shift with higher velocity also indicates nonequilibrium (Brusseau,
1992a). As could be expected from the differences in flow velocity, the leftward shift
is greater for the Eustis medium than for Lula medium since the ratios of the high
and low velocities in both experiments are equal to 215 and 9 respectively. The
analysis of the column experiments shows that the operation of SORWACO is
applicable for the description of the effects of nonequilibrium, especially during the
later parts of a groundwater remediation operation. Referring to the practical use of
SORWACO, it is important that the parameter values are independent of the pore
water velocities, since the pore water velocity may vary along the pathline, and the
recovery may be intermittent.
DESCRIPTION OF A CASE STUDY
Introduction
SORWACO was used to predict and evaluate the course of an aquifer remediation
operation at the Sappemeer gas production site (Veltkamp & Mathijssen, 1991).
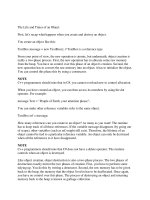
Fig. 4 Sappemeer gas production site in the northern part of The Netherlands.
Nonequilibrium transport and sorption of organic chemicals during aquifer remediation 255
Sappemeer is a town in the northern part of The Netherlands as shown in Fig. 4.
Natural gas has been produced and treated at the Sappemeer site since 1966 with a
design production capacity of 15 million Nm
3
day'
1
. Due to accidental spills, the soil
and groundwater at the location have been contaminated with mineral oil and volatile
aromatic hydrocarbons (BTEX). After an intensive site investigation a soil-aquifer
remediation started in October 1990. The contaminated soil above the groundwater
table has been removed together with the oil floating on top of it and thus further
leaching of contaminants into the saturated zone has been prevented. A combination
of techniques is being used in this operation to restore soil and groundwater quality
quickly and efficiently.
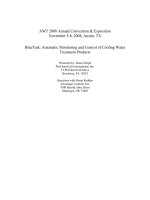
An overview of the subsoil is presented in Fig. 5. The upper 14 m consist of fine
sand. The groundwater table is at about 1.5 m below the surface. Underneath the fine
sand is a layer of fine silty sand mixed with clay with a thickness of about 15 m.
Below that is a layer of fine and coarse sand with a thickness of 120 m.
surface 1.5m ab
fine sand
silty sand
and clay
-30 m
fine and
coarse sand
Fig. 5 Overview of the subsoil
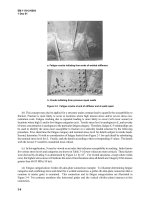
The extent and degree of soil and groundwater contamination have been
investigated in several phases of drilling, sampling and analysing. From 1985 to
1990 a total of 100 boreholes were made with a hand auger ranging in depth from 2
to 5 m. In addition 10 soil borings were made with the cable tool percussion method,
ranging in depth from 12 to 50 m. A total of 117 soil samples and 360 groundwater
samples obtained from these borings were analysed. The concentration of benzene
was much higher than the concentration of the other contaminants that were not
removed together with the upper layer of the subsoil (mainly BTEX). Benzene has a
relatively high mobility and a low allowed concentration 0.2 u.g l"
1
(recently
increased to 1 ug l"
1
) in groundwater. Benzene is the only contaminant that has
migrated away from the area of the gas production site. Thus it remains the most
critical contaminant during the remediation and was selected as the contaminant to be
modelled.
-^7 surface level
" ~~ Tj groundwater table
at -1.8m
-14 m
-150 m below surface
256
Cors
van den Brink
&
Willem
J.
Zaadnoordijk
legend
•
monitoring well
Concentration benzene in ground-
water
at
12-ttm
-
soi surface
> 5000 jug/l
//A
500
-
5000 AJg/l
'
5-500
;ug/(
Fig. 6 Horizontal extent of benzene contamination in groundwater.
The horizontal extent of the benzene plume in the groundwater is presented in
Fig. 6. Most of the benzene is present between 12 and 14 m below the soil surface
on top of the silty sand and clay layer (Fig. 5). About 3500 m
3
of soil in the
unsaturated zone and the upper part of the phreatic aquifer have been contaminated
with approximately 400 kg of volatile organic hydrocarbons and 4000 kg of mineral
oil.
Approximately 1000 kg of volatile aromatic hydrocarbons have leached into the
groundwater, resulting in contamination of 400 000 m
3
of groundwater. The plume
of contaminated groundwater reaches a depth of at least 50 m and is 250 m in length.
Application
The design of the remediation consists of 10 recovery wells (Fig. 7). The
groundwater flow pattern during the remediation was calculated with the program
AQ-AS (RIVM, 1991). Based on the groundwater flow pattern and the spreading of
benzene, the contaminant to be modelled, a representative pathline to the recovery
wells was selected, which is indicated in Fig. 7.
Nonequilibrium transport and sorption of organic chemicals during aquifer remediation 257
A/
C ho r
ocler ist ic paihline
Fig. 7 Location of the recovery wells used for the remediation.
Both the travel time of the groundwater and the concentration of benzene along
the pathline was used as input for SORWACO. The distance travelled and the travel
time determined the average velocity of the groundwater flow. The flow was divided
into a slow (40%) and a fast moving portion (60%), with velocities of 0.022 and 1.7
times the average velocity respectively. The mass transfer coefficient between the
slow moving and the fast moving liquid phases is mainly influenced by the diffusion
rate and distance. This is strongly dependent on the geological formation. From
Goltz & Roberts (1988) it could be derived that an estimate for this first-order mass
transfer coefficient, could be written as:
where D
0
is the liquid diffusion coefficient, X the tortuosity, b the characteristic length
of the soil matrix, and
Q
s
the volumetric soil water content of the slow moving region.
For these parameters the following values were used respectively: 8.8 x 10° m
2
day
4
(Myrand et al, 1992), 2 (Koorevaar et al ., 1983) and 0.12, so that k,
f
=
0.0175
1
day
1
.
258
Cors
van den Brink
& Willem
J.
Zaadnoordijk
The amount of benzene sorbed at equilibrium is determined by the sorption
coefficient K
F
and the Freundlich coefficient n. Initially it was assumed that the
sorption isotherm was linear (i.e. n = 1), which turned out to be an acceptable
assumption during the calibration. The sorption coefficient is equal to the product of
the organic carbon content (M
oc
) and the partitioning coefficient K
oc
. The organic
carbon content of the aquifer was analysed during the field and laboratory research.
The average mass fraction
(M
oc
)
was 0.07%. The most crucial parameter determining
the behaviour of the solute is the partition coefficient K
oc
(m
3
kg
4
). This coefficient
describes the affinity of solutes to organic carbon. The value of K
oc
was 87.1
1
kg
4
(
10
logK
oc
= 1.94, Montgomery & Welkom, 1990). This resulted in K
F
= 61 x 10"
6
m
3
kg
4
.
During the calibration, the sorption rate coefficient k
d2
was found to be equal to
0.0033 1 day'
1
(IWACO, 1991). This corresponded to a half-life time of 210 days
(= log2/k
d2
). This fell nicely in the range of 70-500 days for chlorinated hydro-
carbons given by Ball & Roberts (1991a, b).
In 1991, the development in time of the concentrations in the extracted ground-
water was predicted (IWACO, 1991). The final stage of the concentration
development was mainly influenced by the parameter describing sorption related
nonequilibrium
(k
d2
)-
The developments in time of the measured and predicted
concentrations are shown in Fig. 8. Values calculated with only equilibrium
processes are also given. The calculated concentrations are compared with the
concentrations measured in wells 1 and 2 (Fig. 7). The measured concentrations
agreed well with the values calculated with the nonequilibrium model. The
concentration-time curve cannot be described by an equilibrium model. Especially,
the duration of the operation and the concentrations in the recovered groundwater
were grossly underestimated by the equilibrium model.
da
I
„ 0.01 '
3
0 0.001
S
"c
S 0.0001
c
o
o
1
1E-05
C
0)
n
1
E-06| K+—
1E-07^
- 1 1 , ,
0 200 400 600 800 1000 1200
time (days)
| Measured in wells
| • well
1
-+- well 2
Fig. 8 Concentration development of the measured and predicted concentrations.
SORWACO
-**— calibrated —t— equilibrium
Nonequilibrhim
transport
and sorption of
organic chemicals
during aquifer
remediation
259
After the calibration, predictions were made using the same parameter values in
the SORWACO model. The predictions showed that the benzene concentration would
be reduced to approximately 10 u.g l"
1
after four years of recovery, and to about 1 u.g
l"
1
after six and a half years (Fig. 8). After approximately 100 days the curve of
concentration vs time consisted of two linear sections. The change of the slope
between the sections is determined by the value of the nonequilibrium coefficients
(k
d2
and k
s/
). The slope of the first linear sections is related to the mass transfer
between the fast moving and slow moving liquid regions. The change of the slope of
the second linear section, after about 400 days, is caused by the value of the first
order coefficient of the sorption related nonequilibrium
(k
dl
).
Thus the concentration
development during the remediation was strongly influenced by the nonequilibrium
process, the one which has the longest half-life time, in this case the sorption related
nonequilibrium
(k
d2
).
Based on the concentration development during the remediation and a
quantitative insight into the effects of nonequilibrium, a well motivated decision can
be made with respect to after-care and the remaining risks at the end of the aquifer
remediation operation. This can be seen from Fig. 9 which shows the current
recovery scheme continued for five years resulting in a benzene concentration of ca.
3.5 u.g l"
1
in the extracted groundwater. After this first period there are three
scenarios:
- continuation of current recovery;
10 month periods of recovery are alternated with a two month period without
recovery; and
- two month periods of recovery are alternated with a 10 month period without
recovery.
0.00013
S
1
E-05E
o 1E-06=
ç 1E-07
1E-08
6 7
time (years)
continuous
recovery
-« 10month recov. i 2month recov.
2month none 10monthnone
Fig. 9 Concentration development for various scenarios of recovery.
260
Cors
van
den
Brink
&
Willem
J.
Zaadnoordijk
0
t
ei-a
,2
"
mm
^
C3
CS
>i
>
o
O
0>
a
o
ni
•a
move
Is
U
a
oui
o
is
T)
c
cd
>,
w
<D
>
O
rec
ush
»H
o
a
ctor
<2
•a
<IJ
>
OUI
PH
nn
g
«3
c
v-«
<5
\£5
^H
a
<o
o
Con
^ ^
BO
3
3
E
§1
o
O
t-
«
—i
^
O
ON
00 C4
NO NO NO
00CNt 00ONONONON
mt~~^OONONONONONONON
^OCONONONONONONONON
ONONONONONONONONONON
•-Ht-t-T-ioooooo
OHHMNHOKOOCO
O ON
^|- 00
ON ON
ON
OOC^t-^ONONONONON
(nr^^ooNONONONONONON
^-OOONONONONONONONON
ONONONONONONONONONON
^f m ~H o O O O
o-*—<
<N c-) m CN ci m m
—<(Nifi->j-in>dr-ododo6
r-
NO
t- » r~
O
ON
Tf 00
ON
ON ON
00(Nt^ONONONONON
mï^NOONONONONONONON
^TOOONONONONONONONON
ONONONONONONONONONON
•sf c<~>
T* o O O O
*-<cNmTi-iONCt ooON^
Ê-
•B
"S
S
1
'"
S
•a
in
Nonequilibrium
transport
and sorption of
organic chemicals
during aquifer
remediation
261
These scenarios have been carried out for three years. The calculation has been ex-
tended a further two years. Fig. 9 shows that the differences in recovery scheme not
only influence the expected concentration at the end of the recovery, but also the
concentration two years after the recovery has been stopped. The relationship
between the flush factors and the resulting concentrations is shown in Table 2.
Table 2 shows that over 99% of the benzene has already been removed in the initial
five year period of continuous recovery due to the high mobility of benzene in this
aquifer with a rather low organic matter content. However, to meet the groundwater
standard additional effort is necessary. Three scenarios have been simulated for the
further decrease of the concentration during the following three years. Table 3 gives
a comparison of the removed fractions and the flush factors for the three scenarios
during this period.
Table 3 Removed fraction and flush factor for the three scenarios during three years.
Continuous Alternating 10 months recovery Alternating 2 months recovery
recovery and 2 months rest and 10 months rest
Fraction .00021 .00021 .00017
removed
Flush 3.1 2.6 0.5
factor
An evaluation of the removed fraction of the total benzene during the
remediation operation and per unit volume is shown in Fig. 10. The concentration
decrease during the remediation operation was maximal in the case of a continuous
recovery. However, the removed total fraction of benzene per unit volume
(expressed as flush-factor) shows a significant increase. This phenomenon has been
illustrated in more detail by the evaluation of Harvey et al . (1994). The changes of
the concentration after the remediation has ended differ for the three scenarios
(compare Table 2). This is illustrated by Table 4.
Table 4 Concentration increase during the first two years after the remediation for the three scenarios.
Concentration increase
Absolute
im r
1
)
Relative
Continuous
0.30
158%
recovery Alternating 10 months
recovery and 2 months
rest
0.32
145%
Alternating 2 months
recovery and 10 months
rest
0.69
25%
CONCLUSION
The program SORWACO has been set up for the planning and evaluation of aquifer
remediation operations. The course of such a remediation operation is strongly
influenced by nonequilibrium processes. The program can handle a nonuniform flow
262
Cors
van den Brink
& Willem
J.
Zaadnoordijk
0.9999
0.9998-
0.9997-
0.9996
E
0)
a.
c
o
0.9998
g 0.9997
m
0.9996
Flush Factor
-
-
J
f
M*
JT
Ad
//' »'•'•
* 1
,1:7::,^
/
,.]
1400 1800 2200 2600
Time (days since start of operation)
3000
continuous
recovery
10month recov.
2month none
2month recov.
10month none
Fig. 10 Removed fraction of benzene for alternative recovery scenarios: (a) as function of flush
factor; and (b) as function of remediation time.
velocity of the soil liquid phase as this occurs towards the recovery wells during a
remediation. Both sorption and transport related nonequilibrium processes are imple-
mented.
Evaluation of column experiments has shown that the program is able to predict
the breakthrough curve well, after the nonequilibrium parameters have been fitted
using the results of a situation with quite different flow velocities. It was concluded
that the implementation of the nonequilibrium processes in the program is very useful
for the planning and evaluation of an aquifer remediation operation.
In the case study described, the prediction of the course of the remediation
operation (in 1991) has been sufficiently accurate for the planning of the duration of
the operation as well as for the scale of the purification plant. It has been indicated
Nonequilibrium transport and sorption of organic chemicals during aquifer remediation 263
that after the rather sharp concentration decrease over the first 400 days, the
concentration decrease would be less than that evaluated with an equilibrium
approach because of the (sorption-related) nonequilibrium during the final course of
the remediation operation.
The program SORWACO gives quantitative insight into the influence of inter-
mittent recovery on the remediation and on the concentration development afterward.
This insight can be used to optimise the recovery scheme. The optimal strategy
depends on the constraints of the particular remediation. The concentrations in the
recovered groundwater, the discharge, the remediation time or the removal efficiency
and the remaining concentration may be factors in the optimization.
Acknowledgements This paper is based partly on research sponsored by the Dutch
Oil Company, Nederlandse Aardolie Maatschappij. Thanks are due to anonymous
reviewers for their valuable suggestions for improvement of the manuscript.
REFERENCES
Ball, W. P. & Roberts, P. V. (1991a) Long-term sorption of halogenated organic chemicals by aquifer material. 1.
Equilibrium.
Environ.
Sci.
Technol.
25, 1223-1237.
Ball, W. P. & Roberts, P. V. (1991b) Long-term sorption of halogenated organic chemicals by aquifer material. 2.
Intraparticle diffusion.
Environ.
Sci.
Technol.
25, 1237-1249.
Boesten, J. J. T. I. (1986) Behaviour of herbicides in soil: simulation and experimental assessment. PhD Thesis, Institute
for Pesticides Research, Wageningen, The Netherlands.
Bolt, G. H. (1982) Soil
Chemistry
B:
Physico-Chemical
Models,
Elsevier, Amsterdam, The Netherlands.
Brusseau, M. L. (1992a) Nonequilibrium transport of organic chemicals: The impact of pore-water velocity. /. Contain.
Hydrol. 9, 353-368.
Brusseau, M. L. (1992b) Transport of rate-limited sorbing solutes in heterogeneous porous media: application of a one-
dimensional multifactor nonideality model to field data.
Wat.
Resour.
Res. 9, 2485-2497.
Brusseau, M. L., Jessup, R. E. & Rao, P. S. C. (1991) Nonequilibrium sorption of organic chemicals: Elucidation of
rate-limiting processes.
Environ.
Sci.
Technol.
25, 134-142.
Coats,
K. H. & Smith, B. D. (1964) Dead-end pore volume and dispersion in porous media. J. Soc. Petrol. Engng 4,
73-81.
Goltz, M. N. & Roberts, P. V. (1988) Simulations of physical solute transport models: Application to a large-scale field
experiment. J.
Contam.
Hydrol.
3(1),
37-63.
IWACO (1991) Initial estimates of concentrations at Sappemeer site. Draft report for NAM. IWÀCO, Groningen, The
Netherlands.
Koorevaar, P., Menelik, G. & Dirksen, C. (1983)
Elements
of
Soil
Physics.
Elsevier, Amsterdam, The Netherlands.
Lagas, P., Snelting, H. & van den Berg, R. (1990) Verspreiding van stoffen bij bodemverontreiniging (Spreading of
contaminant in the soil, in Dutch). Report no.
725201002,
National Institute
of
Public Health
and
Environmental
Protection
(RIVM),
Bilthoven,
The
Netherlands.
Leistra, M. (1977) A model for the transport of pesticides in soil with diffusion controlled rates of adsorption and
desorption. Agric.
Environ.
3, 325-335.
Montgomery, J. H. & Welkom, L. M. (1990)
Groundwater Chemicals
Desk
Reference.
Lewis, Chelsea, Michigan,
USA.
Myrand, D., Gilham, R. W., Sudicky, E. A., O'Hannesin, S. F. & Johnson, R. L. (1992) Diffusion of volatile organic
compounds in natural clay deposits: Laboratory test. /.
Contam.
Hydrol.
10, 159-177.
Ptacek, C. J. & Gilham, R. W. (1992) Laboratory and field measurements of nonequilibrium transport in the Borden
aquifer, Ontario, Canada. /.
Contam.
Hydrol. 10(2), 119-158.
Stagnitti, F., Parlange, J. Y., Steenhuis, T. S., Nijssen, B. & Lockington, D. (1993) Modelling the migration of water
soluble contaminants through preferred flow paths in the soil. In: Proc.
Groundwater Quality Management
Conf.
(Tallinn Estonia, September 1993), ed. by K. Kovar & J. Soveri. IAHS Publ. no. 220.
RIVM (1991) AQ-AS
Computer Program Package
for
Groundwater Pathlines
and
Isochrones,
Analytical Solutions.
AQUIfer SOFTware
Systems.
National Institute of Public Health and Environmental Protection (RIVM), Bilthoven,
The Netherlands.
van den Brink, C. (1987) Simulation of the leaching of atrazin to groundwater (in Dutch). MSc Thesis, Agricultural
264 Cors van den Brink & Willem J. Zaadnoordijk
University Wageningen, The Netherlands.
van Genuchten, M. Th. (1981) Nonequilibrium transport parameters from miscible displacement experiments. Report
no.
116,
US Dept
of
Agriculture,
Science &
Education,
US Salinity
Laboratory,
Riverside,
California,
USA.
van Genuchten, M. Th. & Wieringa (1976) Mass transfer studies in sorbing porous media, I, analytical solutions. Soil
Sci.
Soc.
Am. J. 40(4), 473-480.
Veltkamp, A. B. & Mathijssen, J. J. M. (1991) Clean-up of contaminated soil and groundwater: A "location specific"
clean-up operation at the Sappemeer gas production site. SPE 23377, 499-504.
Received 17 October 1994; accepted 6 November 1996