Tài liệu Results From the 2003 National Assessment of Adult Literacy doc
Bạn đang xem bản rút gọn của tài liệu. Xem và tải ngay bản đầy đủ của tài liệu tại đây (1.19 MB, 76 trang )
The Health Literacy of
America’s Adults
Results From the 2003
National Assessment
of Adult Literacy
U.S. Department of Education
NCES 2006–483
The Health Literacy of
America’s Adults
Results From the 2003
National Assessment
of Adult Literacy
SSeepptteemmbbeerr 22000066
Mark Kutner
Elizabeth Greenberg
Ying Jin
Christine Paulsen
American Institutes
for Research
Sheida White
Project Officer
National Center for
Education Statistics
U.S. Department of Education
NCES 2006–483
UU SS DDeeppaarrttmmeenntt ooff EEdduuccaattiioonn
Margaret Spellings
Secretary
IInnssttiittuuttee ooff EEdduuccaattiioonn SScciieenncceess
Grover J. Whitehurst
Director
NNaattiioonnaall CCeenntteerr ffoorr EEdduuccaattiioonn SSttaattiissttiiccss
Mark Schneider
Commissioner
The National Center for Education Statistics (NCES) is the primary federal entity for collecting, analyzing, and reporting data
related to education in the United States and other nations. It fulfills a congressional mandate to collect, collate, analyze, and
report full and complete statistics on the condition of education in the United States; conduct and publish reports and spe-
cialized analyses of the meaning and significance of such statistics; assist state and local education agencies in improving
their statistical systems; and review and report on education activities in foreign countries.
NCES activities are designed to address high-priority education data needs; provide consistent, reliable, complete, and accu-
rate indicators of education status and trends; and report timely, useful, and high-quality data to the U.S. Department of
Education, the Congress, the states, other education policymakers, practitioners, data users, and the general public. Unless
specifically noted, all information contained herein is in the public domain.
We strive to make our products available in a variety of formats and in language that is appropriate to a variety of audiences.
You, as our customer, are the best judge of our success in communicating information effectively. If you have any comments
or suggestions about this or any other NCES product or report, we would like to hear from you. Please direct your comments
to
National Center for Education Statistics
Institute of Education Sciences
U.S. Department of Education
1990 K Street NW
Washington, DC 20006–5651
September 2006
The NCES World Wide Web Home Page address is .
The NCES World Wide Web Electronic Catalog is />SSuuggggeesstteedd CCiittaattiioonn
Kutner, M., Greenberg, E., Jin,Y., and Paulsen, C. (2006). The Health Literacy of America’s Adults: Results From the 2003 National
Assessment of Adult Literacy (NCES 2006–483). U.S. Department of Education. Washington, DC: National Center for Education
Statistics.
FFoorr oorrddeerriinngg iinnffoorrmmaattiioonn oonn tthhiiss rreeppoorrtt,, wwrriittee ttoo
U.S. Department of Education
ED Pubs
P.O. Box 1398
Jessup, MD 20794–1398
or call toll free 1–877–4ED–Pubs or order online at .
CCoonntteenntt CCoonnttaacctt
Sheida White
(202) 502-7473
Executive Summary
T
he 2003 National Assessment of Adult
Literacy (NAAL) assessed the English liter-
acy of adults in the United States. Included
in the assessment were items designed to measure
the health literacy of America’s adults. The assess-
ment was administered to more than 19,000 adults
(ages 16 and older) in households or prisons. Unlike
indirect measures of literacy, which rely on self-
reports and other subjective evaluations, the assess-
ment measured literacy directly through tasks com-
pleted by adults.
The health literacy scale and health literacy tasks
were guided by the definition of health literacy used
by the Institute of Medicine and Healthy People
2010 (a set of national disease prevention and health
promotion objectives led by the U.S. Department of
Health and Human Services).This definition states
that health literacy is:
The degree to which individuals have the
capacity to obtain, process, and understand
basic health information and services needed to
make appropriate health decisions. (HHS 2000
and Institute of Medicine 2004)
These health literacy tasks represent a range of liter-
acy activities that adults are likely to face in their
daily lives. Health literacy is important for all adults.
Adults may read an article in a magazine or a pam-
phlet in their doctor’s office about preventive health
practices; they may need to fill a prescription, select
iii
Literacy Levels
Demographic Characteristics
and Health Literacy
Overall Health, Health
Insurance Coverage, and
Sources of Information About
Health Issues
and buy an over-the-counter medication, or under-
stand health insurance forms. Parents must manage
their children’s health care, including getting them
immunized, taking them for physicals, and having
their illnesses treated. Adult children are often faced
with the responsibility of managing their own par-
ents’ health care. Older adults must make decisions
about Medicare supplementary insurance and pre-
scription drug benefits. Adults without medical
insurance may need to determine whether they, their
children, or their parents qualify for any public pro-
grams. Adults living in older houses and apartments
may need to make decisions about the dangers of
lead paint or asbestos. All these activities require, or
are facilitated by, the ability to read and understand
written and printed information.
The health tasks for the 2003 assessment were devel-
oped to fit into the NAAL’s prose, document, or
quantitative scales but were distinguished from the
other tasks on those scales by their health content.
■
The prose literacy scale measured the knowl-
edge and skills needed to search, comprehend,
and use information from texts that were
organized in sentences or paragraphs.
■
The document literacy scale measured the
knowledge and skills needed to search, compre-
hend, and use information from noncontinuous
texts in various formats.
■
The quantitative scale measured the knowledge
and skills needed to identify and perform com-
putations using numbers embedded in printed
materials.
The NAAL health tasks included on the assessment
were distributed across three domains of health and
health care information and services: clinical, preven-
tion, and navigation of the health system.
This report describes how health literacy varies
across the population and where adults with different
levels of health literacy obtain information about
health issues.The analyses in this report examine dif-
ferences related to literacy that are based on self-
reported background characteristics among groups
in 2003. This report discusses only findings that are
statistically significant at the .05 level.
Literacy Levels
The National Research Council’s Board on Testing
and Assessment (BOTA) Committee on Performance
Levels for Adult Literacy recommended a set of per-
formance levels for the prose, document, and quanti-
tative scales.The Committee on Performance Levels
for Adult Literacy recommended that new literacy
levels be established for the 2003 assessment instead of
using the same reporting levels used for the 1992
National Adult Literacy Survey (Hauser et al. 2005).
Differences between the 1992 and 2003 levels are dis-
cussed by the Committee. Drawing on the commit-
tee’s recommendations, the U.S. Department of
Education decided to report the assessment results by
using four literacy levels for each scale: Below Basic,
Basic, Intermediate, and Proficient.
The health literacy tasks were analyzed together and
were used to create a health literacy scale. Each
health literacy task was also classified as a prose, doc-
ument, or quantitative task and was included on one
of those scales.
The BOTA Committee did not recommend per-
formance levels for the health scale. Because every
health literacy task was included on the prose, docu-
ment, or quantitative scale in addition to the health
scale, it was mapped to a performance level (Below
Basic, Basic, Intermediate, or Proficient) on one of those
scales.Tasks were mapped to each scale at the point on
the scale where an adult would have a 67 percent
iv
The Health Literacy of America’s Adults
probability of doing the task correctly. Cut-points for
the performance levels on the health scale were set so
that each task was classified into the same category on
the health scale as on the other scale (prose, document,
or quantitative) with which the task was associated.
Demographic Characteristics and Health
Literacy
■
The majority of adults (53 percent) had
Intermediate health literacy. An additional
12 percent of adults had Proficient health litera-
cy.Among the remaining adults, 22 percent had
Basic health literacy, and 14 percent had Below
Basic health literacy.
■
Women had higher average health literacy than
men; 16 percent of men had Below Basic health
literacy compared with 12 percent of women.
■
White and Asian/Pacific Islander adults had
higher average health literacy than Black,
Hispanic, American Indian/Alaska Native, and
Multiracial adults. Hispanic adults had lower
average health literacy than adults in any other
racial/ethnic group.
■
Adults who spoke only English before starting
school had higher average health literacy than
adults who spoke other languages alone or
other languages and English.
■
Adults who were ages 65 and older had lower
average health literacy than adults in younger
age groups. The percentage of adults in the 65
and older age group who had Intermediate and
Proficient health literacy was lower than the com-
parable percentage of adults in other age groups.
■
Starting with adults who had graduated from
high school or obtained a GED, average health
literacy increased with each higher level of edu-
cational attainment. Some 49 percent of adults
who had never attended or did not complete
high school had Below Basic health literacy,
compared with 15 percent of adults who ended
their education with a high school diploma and
3 percent of adults with a bachelor’s degree.
■
Adults living below the poverty level had lower
average health literacy than adults living above
the poverty threshold.
Overall Health, Health Insurance Coverage,
and Sources of Information About Health
Issues
■
At every increasing level of self-reported over-
all health, adults had higher average health liter-
acy than adults in the next lower level.
■
Adults who received health insurance coverage
through their employer or a family member’s
employer or through the military or who pri-
vately purchased health insurance had higher
average health literacy than adults who
received Medicare or Medicaid and adults who
had no health insurance coverage. Among
adults who received Medicare or Medicaid,
27 percent and 30 percent, respectively, had
Below Basic health literacy.
■
A lower percentage of adults with Below Basic
health literacy than adults with Basic,
Intermediate, or Proficient health literacy got
information about health issues from any writ-
ten sources, including newspapers, magazines,
books or brochures, and the Internet. A higher
percentage of adults with Below Basic and Basic
health literacy than adults with Intermediate and
Proficient health literacy received a lot of infor-
mation about health issues from radio and tele-
vision. With each increasing level of health lit-
eracy, a higher percentage of adults got infor-
mation about health issues from family mem-
bers, friends, or coworkers.
v
Executive Summary
T
he National Assessment of Adult Literacy
(NAAL) is a complex project whose suc-
cessful completion is due to the work of
countless individuals from many organizations. We,
at the American Institutes for Research (AIR),
especially want to thank the staff at the National
Center for Education Statistics (NCES) who have
supported the project. Sheida White, the NAAL
project officer, has provided substantive guidance
and direction to all aspects of the assessment. Her
intellectual contributions are reflected throughout
the assessment, analyses, and report. Andrew
Kolstad, the project’s senior technical advisor and
project officer of the 1992 National Adult Literacy
Survey, provided both technical guidance and an
institutional memory throughout the project and
helped us reflect on all statistical and technical
issues. Steven Gorman also played a key role in
guiding all aspects of the assessment, especially those
related to the statistical aspects of the assessment.
Peggy Carr, NCES Associate Commissioner for
Assessment, provided the project and team members
with ongoing support, recommendations, and
encouragement.We are very grateful for her leader-
ship.William Tirre and Arnold Goldstein of NCES
played invaluable roles in reviewing the report and
guiding it through the review process. Their
efforts are very much appreciated. We also thank
Marilyn Seastrom, NCES Chief Statistician,
and members of the NCES/Education Statistics
vii
Services Institute(ESSI) Technical Review Team,
Kevin Bromer, LaTisha Jones, Alison Slade, Aparna
Sundaram, and Jed Tank, who reviewed the report and
made many suggestions that have improved the final
product. Other government reviewers who provided
thoughtful comments are Tom Snyder and John Wirt,
from NCES, and Cheryl Keenan, Director, Division of
Adult Education and Literacy in the Office of
Vocational and Adult Education (OVAE), and Ricardo
Hernandez of OVAE. We also want to thank Jaleh
Soroui of the ESSI for her ongoing substantive contri-
butions to the NAAL.Young Chun, Linda Shafer, and
Alan Vanneman of National Assessment of Educational
Progress (NAEP)-ESSI reviewed the report and
provided important comments and suggestions.
Cynthia Baur, Office of Disease Prevention and
Health Promotion, Office of Public Health and
Science, Office of the Secretary of the Department
of Health and Human Services, played a pivotal role
in conceptualizing, planning, designing, and report-
ing on the health literacy component of NAAL.The
NAAL health literacy component is based on her
intellectual contributions and perseverance. Ron
Pugsley, former Director of the Division of Adult
Education and Literacy in the Office of Vocational
and Adult Education, played a key role in the early
planning stages of the health literacy report. Dan
Sherman from AIR also provided invaluable guid-
ance to the health literacy analyses and report.
Our colleagues at Westat, Inc., planned, developed,
and implemented the complex sampling and weight-
ing necessary for the successful completion of the
assessment. Westat also planned and carried out all
phases of the data collection, and was responsible for
training and managing a group of 400 field data col-
lection staff.This study could not have been success-
ful without the outstanding work of the Westat proj-
ect director, Martha Berlin, and the Westat team,
including Michelle Amsbary, Leyla Mohadjer, and
Jacquie Hogan.
Many staff at AIR made substantial contributions to
the health literacy report, often under tight timelines.
Stéphane Baldi and Justin Baer, senior members of
the AIR NAAL team, provided invaluable substan-
tive and technical contributions throughout the
duration of the project. Bridget Boyle and Yung-
chen Hsu conducted analyses for the authors when-
ever requested. Rachel Greenberg and Elizabeth
Moore provided ongoing research and technical sup-
port in developing the assessment, preparing the data
and text, and shepherding the report through the
revision and review process.
We are especially appreciative of the skills and con-
tributions by Holly Baker, who edited the report
through multiple revisions, and by Heather Block,
who designed and redesigned the report. We are
grateful for their dedication and in awe of their abil-
ity to work under often seemingly impossible time
constraints. Also, Janan Musa provided the AIR team
with invaluable guidance and administrative and
logistical support throughout the project.
We also want to acknowledge the essential contribu-
tions of three other individuals. Archie Lapointe was
an active member of the AIR team during the early
stages of the NAAL, and the project greatly benefit-
ed from his experience and wisdom.Another former
member of the AIR team, Eugene Johnson, who
directed the assessment’s psychometrics and prelimi-
nary analysis activities, played an essential role in the
project. We also want to acknowledge the contribu-
tions of Richard Venezky, who provided invaluable
guidance, support, and friendship, and whose memo-
ry we cherish.
Thousands of adults participated in the assessment.
Their willingness to spend time answering the back-
ground questions and assessment items was essential
to ensuring that meaningful data about the literacy of
America’s adults could be obtained.This study would
not have been possible without their participation.
viii
The Health Literacy of America’s Adults
Executive Summary . . . . . . . . . . . . . . . . . . . . . . . . . . . . . . . . . . . . . . . . . . . . . . . . . iii
Literacy Levels . . . . . . . . . . . . . . . . . . . . . . . . . . . . . . . . . . . . . . . . . . . . . . . . . . . . . . . . . . . . . . . . iv
Demographic Characteristics and Health Literacy . . . . . . . . . . . . . . . . . . . . . . . . . . . . . . . . . . . v
Overall Health,Health Insurance Coverage,and Sources of Information About
Health Issues . . . . . . . . . . . . . . . . . . . . . . . . . . . . . . . . . . . . . . . . . . . . . . . . . . . . . . . . . . . . . . . . . . v
Acknowledgments . . . . . . . . . . . . . . . . . . . . . . . . . . . . . . . . . . . . . . . . . . . . . . . . . vii
List of Tables . . . . . . . . . . . . . . . . . . . . . . . . . . . . . . . . . . . . . . . . . . . . . . . . . . . . . . . xi
List of Figures . . . . . . . . . . . . . . . . . . . . . . . . . . . . . . . . . . . . . . . . . . . . . . . . . . . . . xiv
Chapter 1: Introduction . . . . . . . . . . . . . . . . . . . . . . . . . . . . . . . . . . . . . . . . . . . . . . 1
Defining and Measuring Literacy . . . . . . . . . . . . . . . . . . . . . . . . . . . . . . . . . . . . . . . . . . . . . . . . . 2
Interpreting Literacy Results. . . . . . . . . . . . . . . . . . . . . . . . . . . . . . . . . . . . . . . . . . . . . . . . . . . . . 4
Conducting the Survey. . . . . . . . . . . . . . . . . . . . . . . . . . . . . . . . . . . . . . . . . . . . . . . . . . . . . . . . . . 7
Interpretation of Results . . . . . . . . . . . . . . . . . . . . . . . . . . . . . . . . . . . . . . . . . . . . . . . . . . . . . . . . 8
Cautions in Interpretation . . . . . . . . . . . . . . . . . . . . . . . . . . . . . . . . . . . . . . . . . . . . . . . . . . . . . . . 8
Organization of the Report . . . . . . . . . . . . . . . . . . . . . . . . . . . . . . . . . . . . . . . . . . . . . . . . . . . . . . 8
Chapter 2: Demographic Characteristics and Health Literacy. . . . . . . . . . . . . . . 9
Total Population . . . . . . . . . . . . . . . . . . . . . . . . . . . . . . . . . . . . . . . . . . . . . . . . . . . . . . . . . . . . . . 10
Gender . . . . . . . . . . . . . . . . . . . . . . . . . . . . . . . . . . . . . . . . . . . . . . . . . . . . . . . . . . . . . . . . . . . . . . 10
Race and Ethnicity . . . . . . . . . . . . . . . . . . . . . . . . . . . . . . . . . . . . . . . . . . . . . . . . . . . . . . . . . . . . 11
Language Spoken Before Starting School . . . . . . . . . . . . . . . . . . . . . . . . . . . . . . . . . . . . . . . . . 12
Age . . . . . . . . . . . . . . . . . . . . . . . . . . . . . . . . . . . . . . . . . . . . . . . . . . . . . . . . . . . . . . . . . . . . . . . . . 12
Highest Level of Educational Attainment . . . . . . . . . . . . . . . . . . . . . . . . . . . . . . . . . . . . . . . . . 13
Poverty Threshold . . . . . . . . . . . . . . . . . . . . . . . . . . . . . . . . . . . . . . . . . . . . . . . . . . . . . . . . . . . . . 14
Summary. . . . . . . . . . . . . . . . . . . . . . . . . . . . . . . . . . . . . . . . . . . . . . . . . . . . . . . . . . . . . . . . . . . . 14
Chapter 3: Overall Health, Health Insurance Coverage, and Sources of
Information About Health Issues . . . . . . . . . . . . . . . . . . . . . . . . . . . . . . . . . . . . . 15
Self-Assessment of Overall Health . . . . . . . . . . . . . . . . . . . . . . . . . . . . . . . . . . . . . . . . . . . . . . . 16
Health Insurance. . . . . . . . . . . . . . . . . . . . . . . . . . . . . . . . . . . . . . . . . . . . . . . . . . . . . . . . . . . . . . 17
ix
CONTENTS
Sources of Information About Health Issues . . . . . . . . . . . . . . . . . . . . . . . . . . . . . . . . . . . . . . . . . . . . . . . . . . . . . . . . . . . . . . . . . . . . . . . . . .18
Summary . . . . . . . . . . . . . . . . . . . . . . . . . . . . . . . . . . . . . . . . . . . . . . . . . . . . . . . . . . . . . . . . . . . . . . . . . . . . . . . . . . . . . . . . . . . . . . . . . . . . . . . .20
Appendix A: Sample Health Literacy Assessment Question . . . . . . . . . . . . . . . . . . . . . . . . . . . . . . . . . . . . . . . . . . . . .23
Appendix B: Definitions of All Subpopulations and Background Variables Reported . . . . . . . . . . . . . . . . . . . . . . . .27
Appendix C: Technical Notes . . . . . . . . . . . . . . . . . . . . . . . . . . . . . . . . . . . . . . . . . . . . . . . . . . . . . . . . . . . . . . . . . . . . . . .31
Appendix D: Standard Errors for Tables and Figures . . . . . . . . . . . . . . . . . . . . . . . . . . . . . . . . . . . . . . . . . . . . . . . . . . .39
Appendix E: Additional Analyses . . . . . . . . . . . . . . . . . . . . . . . . . . . . . . . . . . . . . . . . . . . . . . . . . . . . . . . . . . . . . . . . . . .47
References . . . . . . . . . . . . . . . . . . . . . . . . . . . . . . . . . . . . . . . . . . . . . . . . . . . . . . . . . . . . . . . . . . . . . . . . . . . . . . . . . . . . . .59
x
The Health Literacy of America’s Adults
List of Tables
Table Page
1-1. Overview of the literacy levels . . . . . . . . . . . . . . . . . . . . . . . . . . . . . . . . . . . . . . . . . . . . . . . . . . . . . . . . . . . . . . . . . . . . . . . . . . . . . . . .5
2-1. Average health literacy scores of adults, by language spoken before starting school:2003 . . . . . . . . . . . . . . . . . . . . . . . . . . . .12
2-2. Average health literacy scores of adults, by poverty threshold:2003 . . . . . . . . . . . . . . . . . . . . . . . . . . . . . . . . . . . . . . . . . . . . . . .14
C-1. Weighted and unweighted household response rate, by survey component:2003 . . . . . . . . . . . . . . . . . . . . . . . . . . . . . . . . . . . 33
C-2. Weighted and unweighted prison response rate, by survey component:2003. . . . . . . . . . . . . . . . . . . . . . . . . . . . . . . . . . . . . . . 34
D2-1. Estimates and standard errors for Figure 2-1. Percentage of adults in each health literacy level:2003 . . . . . . . . . . . . . . . . . . 40
D2-2. Estimates and standard errors for Figure 2-2. Average health literacy scores of adults, by gender:2003 . . . . . . . . . . . . . . . . .40
D2-3. Estimates and standard errors for Figure 2-3. Percentage of adults in each health literacy level, by gender:2003 . . . . . . . . .40
D2-4. Estimates and standard errors for Figure 2-4. Average health literacy scores of adults, by race/ethnicity: 2003 . . . . . . . . . . .40
D2-5. Estimates and standard errors for Figure 2-5. Percentage of adults in each health literacy level,by race/ethnicity: 2003 . . .41
D2-6. Estimates and standard errors for Table 2-1.Average health literacy scores of adults, by language spoken before
starting school:2003 . . . . . . . . . . . . . . . . . . . . . . . . . . . . . . . . . . . . . . . . . . . . . . . . . . . . . . . . . . . . . . . . . . . . . . . . . . . . . . . . . . . . . . .41
D2-7. Estimates and standard errors for Figure 2-6. Average health literacy scores of adults, by age: 2003 . . . . . . . . . . . . . . . . . . . .41
D2-8. Estimates and standard errors for Figure 2-7. Percentage of adults in each health literacy level, by age: 2003 . . . . . . . . . . . .42
D2-9. Estimates and standard errors for Figure 2-8. Average health literacy scores of adults, by highest educational
attainment:2003 . . . . . . . . . . . . . . . . . . . . . . . . . . . . . . . . . . . . . . . . . . . . . . . . . . . . . . . . . . . . . . . . . . . . . . . . . . . . . . . . . . . . . . . . . .42
D2-10. Estimates and standard errors for Table 2-2.Average health literacy scores of adults, by poverty threshold: 2003 . . . . . . . . .43
D2-11. Estimates and standard errors for Figure 2-9.Percentage of adults in each health literacy level,by highest educational
attainment:2003 . . . . . . . . . . . . . . . . . . . . . . . . . . . . . . . . . . . . . . . . . . . . . . . . . . . . . . . . . . . . . . . . . . . . . . . . . . . . . . . . . . . . . . . . . .43
D3-1. Estimates and standard errors for Figure 3-1. Average health literacy scores of adults, by self-assessment of overall
health:2003 . . . . . . . . . . . . . . . . . . . . . . . . . . . . . . . . . . . . . . . . . . . . . . . . . . . . . . . . . . . . . . . . . . . . . . . . . . . . . . . . . . . . . . . . . . . . . .44
D3-2. Estimates and standard errors for Figure 3-2. Percentage of adults in each health literacy level, by self-assessment
of overall health:2003 . . . . . . . . . . . . . . . . . . . . . . . . . . . . . . . . . . . . . . . . . . . . . . . . . . . . . . . . . . . . . . . . . . . . . . . . . . . . . . . . . . . . .44
D3-3. Estimates and standard errors for Figure 3-3. Average health literacy scores of adults, by type of health insurance
coverage: 2003 . . . . . . . . . . . . . . . . . . . . . . . . . . . . . . . . . . . . . . . . . . . . . . . . . . . . . . . . . . . . . . . . . . . . . . . . . . . . . . . . . . . . . . . . . . . .44
D3-4. Estimates and standard errors for Figure 3-4. Percentage of adults in each health literacy level, by type of health
insurance coverage: 2003 . . . . . . . . . . . . . . . . . . . . . . . . . . . . . . . . . . . . . . . . . . . . . . . . . . . . . . . . . . . . . . . . . . . . . . . . . . . . . . . . . . .45
D3-5. Estimates and standard errors for Figure 3-5. Percentage of adults who got information about health issues from
printed and written media: newspapers,magazines,books or brochures,and the Internet,by health literacy level: 2003 . .45
D3-6. Estimates and standard errors for Figure 3-6. Percentage of adults who got information about health issues from
nonprint media: radio and television, by health literacy level:2003 . . . . . . . . . . . . . . . . . . . . . . . . . . . . . . . . . . . . . . . . . . . . . . .46
D3-7. Estimates and standard errors for Figure 3-7. Percentage of adults who got information about health issues from
personal contacts: family,friends,or coworkers; or health care professionals,by health literacy level: 2003 . . . . . . . . . . . . . .46
E-1. Average health literacy scores of adults, by occupational group:2003 . . . . . . . . . . . . . . . . . . . . . . . . . . . . . . . . . . . . . . . . . . . . .48
E-2. Average health literacy scores of adults, by self-assessment of overall health and gender: 2003 . . . . . . . . . . . . . . . . . . . . . . .48
xi
Contents
xii
The Health Literacy of America’s Adults
E-3. Average health literacy scores of adults, by self-assessment of overall health and race/ethnicity:2003 . . . . . . . . . . . . . . . . .49
E-4. Average health literacy scores of adults, by self-assessment of overall health and age:2003 . . . . . . . . . . . . . . . . . . . . . . . . . .49
E-5. Average health literacy scores of adults,by self-assessment of overall health and highest educational attainment:
2003 . . . . . . . . . . . . . . . . . . . . . . . . . . . . . . . . . . . . . . . . . . . . . . . . . . . . . . . . . . . . . . . . . . . . . . . . . . . . . . . . . . . . . . . . . . . . . . . . . . . . .49
E-6. Average health literacy scores of adults, by type of health insurance coverage and gender:2003 . . . . . . . . . . . . . . . . . . . . . .50
E-7. Average health literacy scores of adults, by type of health insurance coverage and race/ethnicity: 2003 . . . . . . . . . . . . . . . .50
E-8. Average health literacy scores of adults, by type of health insurance coverage and age: 2003 . . . . . . . . . . . . . . . . . . . . . . . . .50
E-9. Average health literacy scores of adults, by type of health insurance coverage and highest educational attainment:
2003 . . . . . . . . . . . . . . . . . . . . . . . . . . . . . . . . . . . . . . . . . . . . . . . . . . . . . . . . . . . . . . . . . . . . . . . . . . . . . . . . . . . . . . . . . . . . . . . . . . . . .51
E-10. Average health literacy scores of adults who got information about health issues from newspapers,magazines,
and books or brochures,by gender: 2003 . . . . . . . . . . . . . . . . . . . . . . . . . . . . . . . . . . . . . . . . . . . . . . . . . . . . . . . . . . . . . . . . . . . . . .51
E-11. Average health literacy scores of adults who got information about health issues from the Internet, by gender: 2003 . . . .52
E-12. Average health literacy scores of adults who got information about health issues from newspapers,magazines,
and books or brochures,by race/ethnicity:2003 . . . . . . . . . . . . . . . . . . . . . . . . . . . . . . . . . . . . . . . . . . . . . . . . . . . . . . . . . . . . . . . .52
E-13. Average health literacy scores of adults who got information about health issues from the Internet, by race/ethnicity:
2003 . . . . . . . . . . . . . . . . . . . . . . . . . . . . . . . . . . . . . . . . . . . . . . . . . . . . . . . . . . . . . . . . . . . . . . . . . . . . . . . . . . . . . . . . . . . . . . . . . . . . .53
E-14. Average health literacy scores of adults who got information about health issues from newspapers,magazines,
and books or brochures,by age:2003 . . . . . . . . . . . . . . . . . . . . . . . . . . . . . . . . . . . . . . . . . . . . . . . . . . . . . . . . . . . . . . . . . . . . . . . . .53
E-15. Average health literacy scores of adults who got information about health issues from the Internet, by age:2003 . . . . . . .54
E-16. Average health literacy scores of adults who got information about health issues from newspapers,magazines,
and books or brochures,by highest educational attainment:2003 . . . . . . . . . . . . . . . . . . . . . . . . . . . . . . . . . . . . . . . . . . . . . . . .54
E-17. Average health literacy scores of adults who got information about health issues from the Internet, by highest
educational attainment:2003 . . . . . . . . . . . . . . . . . . . . . . . . . . . . . . . . . . . . . . . . . . . . . . . . . . . . . . . . . . . . . . . . . . . . . . . . . . . . . . .54
E-18. Average health literacy scores of adults who got information about health issues from radio and television,
by gender: 2003 . . . . . . . . . . . . . . . . . . . . . . . . . . . . . . . . . . . . . . . . . . . . . . . . . . . . . . . . . . . . . . . . . . . . . . . . . . . . . . . . . . . . . . . . . . .55
E-19. Average health literacy scores of adults who got information about health issues from radio and television,
by race/ethnicity: 2003 . . . . . . . . . . . . . . . . . . . . . . . . . . . . . . . . . . . . . . . . . . . . . . . . . . . . . . . . . . . . . . . . . . . . . . . . . . . . . . . . . . . . .55
E-20. Average health literacy scores of adults who got information about health issues from radio and television,
by age: 2003 . . . . . . . . . . . . . . . . . . . . . . . . . . . . . . . . . . . . . . . . . . . . . . . . . . . . . . . . . . . . . . . . . . . . . . . . . . . . . . . . . . . . . . . . . . . . . .55
E-21. Average health literacy scores of adults who got information about health issues from radio and television,
by highest educational attainment:2003 . . . . . . . . . . . . . . . . . . . . . . . . . . . . . . . . . . . . . . . . . . . . . . . . . . . . . . . . . . . . . . . . . . . . .56
E-22. Average health literacy scores of adults who got information about health issues from family,friends, or coworkers,
by gender: 2003 . . . . . . . . . . . . . . . . . . . . . . . . . . . . . . . . . . . . . . . . . . . . . . . . . . . . . . . . . . . . . . . . . . . . . . . . . . . . . . . . . . . . . . . . . . .56
E-23. Average health literacy scores of adults who got information about health issues from health care professionals,
by gender: 2003 . . . . . . . . . . . . . . . . . . . . . . . . . . . . . . . . . . . . . . . . . . . . . . . . . . . . . . . . . . . . . . . . . . . . . . . . . . . . . . . . . . . . . . . . . . .56
E-24. Average health literacy scores of adults who got information about health issues from family,friends, or coworkers,
by race/ethnicity: 2003 . . . . . . . . . . . . . . . . . . . . . . . . . . . . . . . . . . . . . . . . . . . . . . . . . . . . . . . . . . . . . . . . . . . . . . . . . . . . . . . . . . . . .57
E-25. Average health literacy scores of adults who got information about health issues from health care professionals,
by race/ethnicity: 2003 . . . . . . . . . . . . . . . . . . . . . . . . . . . . . . . . . . . . . . . . . . . . . . . . . . . . . . . . . . . . . . . . . . . . . . . . . . . . . . . . . . . . .57
E-26. Average health literacy scores of adults who got information about health issues from family,friends, or coworkers,
by age: 2003 . . . . . . . . . . . . . . . . . . . . . . . . . . . . . . . . . . . . . . . . . . . . . . . . . . . . . . . . . . . . . . . . . . . . . . . . . . . . . . . . . . . . . . . . . . . . . .57
E-27. Average health literacy scores of adults who got information about health issues from health care professionals,
by age: 2003 . . . . . . . . . . . . . . . . . . . . . . . . . . . . . . . . . . . . . . . . . . . . . . . . . . . . . . . . . . . . . . . . . . . . . . . . . . . . . . . . . . . . . . . . . . . . . .58
E-28. Average health literacy scores of adults who got information about health issues from family,friends, or coworkers,
by highest educational attainment:2003 . . . . . . . . . . . . . . . . . . . . . . . . . . . . . . . . . . . . . . . . . . . . . . . . . . . . . . . . . . . . . . . . . . . . .58
E-29. Average health literacy scores of adults who got information about health issues from health care professionals,
by highest educational attainment:2003 . . . . . . . . . . . . . . . . . . . . . . . . . . . . . . . . . . . . . . . . . . . . . . . . . . . . . . . . . . . . . . . . . . . . .58
xiii
Contents
List of Figures
Figure Page
1-1. Difficulty of selected health literacy tasks:2003 . . . . . . . . . . . . . . . . . . . . . . . . . . . . . . . . . . . . . . . . . . . . . . . . . . . . . . . . . . . . . . . . .6
2-1. Percentage of adults in each health literacy level: 2003 . . . . . . . . . . . . . . . . . . . . . . . . . . . . . . . . . . . . . . . . . . . . . . . . . . . . . . . . . .10
2-2. Average health literacy scores of adults, by gender:2003 . . . . . . . . . . . . . . . . . . . . . . . . . . . . . . . . . . . . . . . . . . . . . . . . . . . . . . . .10
2-3. Percentage of adults in each health literacy level, by gender:2003 . . . . . . . . . . . . . . . . . . . . . . . . . . . . . . . . . . . . . . . . . . . . . . . .10
2-4. Average health literacy scores of adults, by race/ethnicity: 2003 . . . . . . . . . . . . . . . . . . . . . . . . . . . . . . . . . . . . . . . . . . . . . . . . . .11
2-5. Percentage of adults in each health literacy level, by race/ethnicity: 2003 . . . . . . . . . . . . . . . . . . . . . . . . . . . . . . . . . . . . . . . . . .11
2-6. Average health literacy scores of adults, by age: 2003 . . . . . . . . . . . . . . . . . . . . . . . . . . . . . . . . . . . . . . . . . . . . . . . . . . . . . . . . . . .12
2-7. Percentage of adults in each health literacy level, by age:2003 . . . . . . . . . . . . . . . . . . . . . . . . . . . . . . . . . . . . . . . . . . . . . . . . . . .12
2-8. Average health literacy scores of adults, by highest educational attainment:2003 . . . . . . . . . . . . . . . . . . . . . . . . . . . . . . . . . . .13
2-9. Percentage of adults in each health literacy level, by highest educational attainment:2003 . . . . . . . . . . . . . . . . . . . . . . . . . .14
3-1. Average health literacy scores of adults, by self-assessment of overall health:2003 . . . . . . . . . . . . . . . . . . . . . . . . . . . . . . . . . .16
3-2. Percentage of adults in each health literacy level, by self-assessment of overall health:2003 . . . . . . . . . . . . . . . . . . . . . . . . .16
3-3. Average health literacy scores of adults, by type of health insurance coverage:2003 . . . . . . . . . . . . . . . . . . . . . . . . . . . . . . . . .17
3-4. Percentage of adults in each health literacy level, by type of health insurance coverage:2003 . . . . . . . . . . . . . . . . . . . . . . . . .18
3-5. Percentage of adults who got information about health issues from printed and written media:newspapers,
magazines,books or brochures, and the Internet, by health literacy level: 2003 . . . . . . . . . . . . . . . . . . . . . . . . . . . . . . . . . . . . .19
3-6. Percentage of adults who got information about health issues from nonprint media: radio and television,by health
literacy level: 2003 . . . . . . . . . . . . . . . . . . . . . . . . . . . . . . . . . . . . . . . . . . . . . . . . . . . . . . . . . . . . . . . . . . . . . . . . . . . . . . . . . . . . . . . . . . .20
3-7. Percentage of adults who got information about health issues from personal contacts: family,friends, or coworkers;
or health care professionals,by health literacy level:2003 . . . . . . . . . . . . . . . . . . . . . . . . . . . . . . . . . . . . . . . . . . . . . . . . . . . . . . .21
xiv
The Health Literacy of America’s Adults
Introduction
U
nderstanding the health literacy of America’s
adults is important because so many aspects
of finding health care and health informa-
tion, and maintaining health, depend on understand-
ing written information. Many reports have suggested
that low health literacy is associated with poor com-
munication between patients and health care
providers and with poor health outcomes, including
increased hospitalization rates, less frequent screening
for diseases such as cancer, and disproportionately high
rates of disease and mortality (Baker et al. 1998;
Berkman et al. 2004; Gordon et al. 2002; Lindau et al.
2001; Rudd et al. 1999; Williams et al. 2002). Low
health literacy may also be associated with increased
use of emergency rooms for primary care (Baker et
al. 2004). These findings have implications for the
costs of caring for patients with low health literacy.
As the Committee on Health Literacy of the
Institute of Medicine wrote:
Health literacy is of concern to everyone
involved in health promotion and protection,
disease prevention and early screening, health
care maintenance, and policy making. Health lit-
eracy skills are needed for dialogue and discus-
sion, reading health information, interpreting
charts, making decisions about participating in
research studies, using medical tools for personal
or family health care—such as a peak flow meter
or thermometer—calculating timing or dosage
of medicine, or voting on health or environment
issues. (Institute of Medicine 2004, p. 31)
1
Defining and Measuring
Literacy
Interpreting Literacy Results
Conducting the Survey
Interpretation of Results
Cautions in Interpretation
Organization of the Report
1
CHAPTER ONE
Health literacy is a new component of the 2003
National Assessment of Adult Literacy (NAAL).
NAAL assessed the English literacy of adults (ages 16
and older) in the United States. The assessment was
administered to more than 19,000 adults (ages 16 and
older) in households or prisons.
This report presents the initial findings on health lit-
eracy from the assessment. Analyses presented in this
report, including those in appendix E, are intended
to provide a summary of the relationship between
health literacy and background characteristics of
adults, preventive health practices, and sources of
health information used by adults.
Defining and Measuring Literacy
Defining Literacy
Unlike indirect measures of literacy—which rely on
self-reports and other subjective evaluations of liter-
acy and education—the 2003 adult literacy assess-
ment measured literacy directly by tasks representing
a range of literacy activities that adults are likely to
face in their daily lives.
The literacy tasks in the assessment were drawn from
actual texts and documents, which were either used
in their original format or reproduced in the assess-
ment booklets. Each question appeared before the
materials needed to answer it, thus encouraging
respondents to read with purpose.
Respondents could correctly answer many assess-
ment questions by skimming the text or document
for the information necessary to perform a given lit-
eracy task. None of the tasks were multiple choice
tasks with a list of responses provided. Instead,
respondents had to determine and write their
answers to the questions.
The 2003 assessment used the same definition of lit-
eracy as the 1992 National Adult Literacy Survey:
Using printed and written information to func-
tion in society, to achieve one’s goals, and to
develop one’s knowledge and potential.
This definition acknowledges that literacy goes
beyond simply being able to sound out or recognize
words and understand text. A central feature of the
definition is that literacy is related to achieving an
objective and that adults often read for a purpose.
Measuring Literacy
Three literacy scales—prose literacy, document liter-
acy, and quantitative literacy—were used in the 2003
assessment:
■
Prose literacy. The knowledge and skills needed
to perform prose tasks (i.e., to search, compre-
hend, and use information from continuous
texts). Prose examples include editorials, news
stories, brochures, and instructional materials.
Prose texts can be further broken down as
expository, narrative, procedural, or persuasive.
■
Document literacy. The knowledge and skills
needed to perform document tasks (i.e., to
search, comprehend, and use information from
noncontinuous texts in various formats).
Document examples include job applications,
payroll forms, transportation schedules, maps,
tables, and drug and food labels.
■
Quantitative literacy. The knowledge and skills
required to perform quantitative tasks (i.e., to
identify and perform computations, either alone
or sequentially, using numbers embedded in
printed materials). Examples include balancing a
checkbook, figuring out a tip, completing an
order form, and determining the amount of
interest on a loan from an advertisement.
2
The Health Literacy of America’s Adults
In addition, the assessment included a health literacy
scale that consisted of 12 prose, 12 document, and 4
quantitative NAAL items.
1
The health literacy items
reflect the definition of health literacy as defined by
the Institute of Medicine and Healthy People 2010
(a set of national disease prevention and health pro-
motion objectives led by the U.S. Department of
Health and Human Services):
The degree to which individuals have the
capacity to obtain, process, and understand basic
health information and services needed to
make appropriate health decisions. (HHS 2000
and Institute of Medicine 2004)
Tasks used to measure health literacy were organized
around three domains of health and health care
information and services: clinical, prevention, and nav-
igation of the health care system.The stimulus materials
and the 28 health literacy tasks were designed to
elicit respondents’ skills for locating and understand-
ing health-related information and services and to
represent the three general literacy scales—prose,
document, and quantitative—developed to report
NAAL results.
The materials were selected to be representative of
real-world health-related information, including
insurance information, medicine directions, and pre-
ventive care information. The Office of Disease
Prevention and Health Promotion (ODPHP) within
the U.S. Department of Health and Human Services
suggested materials and questions based on input
from other HHS agencies and stakeholders and
experts, and on information from federal health
materials and other health-related assessments.
Of the 28 health literacy tasks, 3 represented the clin-
ical domain, 14 represented the prevention domain,
and 11 items represented the navigation of the health
care system domain. The domains are defined in the
following way:
■
The clinical domain encompasses those activities
associated with the health care provider-patient
interaction, clinical encounters, diagnosis and
treatment of illness, and medication. Tasks from
the clinical domain are filling out a patient
information form for an office visit, understand-
ing dosing instructions for medication, and fol-
lowing a health care provider’s recommendation
for a diagnostic test.
■
The prevention domain encompasses those activ-
ities associated with maintaining and improving
health, preventing disease, intervening early in
emerging health problems, and engaging in self-
care and self-management of illness. Examples
are following guidelines for age-appropriate
preventive health services, identifying signs and
symptoms of health problems that should be
addressed with a health professional, and under-
standing how eating and exercise habits decrease
risks for developing serious illness.
■
The navigation of the health care system domain
encompasses those activities related to under-
standing how the health care system works and
individual rights and responsibilities. Examples
are understanding what a health insurance plan
will and will not pay for, determining eligibili-
ty for public insurance or assistance programs,
and being able to give informed consent for a
health care service. (HHS, 2003, p. 37)
The NAAL health literacy scale did not include tasks
that did not fit the definitions of prose, document, or
quantitative literacy even if they were consistent with
the definition of health literacy used by Healthy
People 2010. For example, none of the NAAL health
tasks required knowledge of specialized health termi-
3
Chapter 1: Introduction
1
The NAAL health literacy scale was constructed to have a mean
of 245 and a standard deviation of 55.
nology. The assessment also did not measure the abil-
ity to obtain information from nonprint sources,
although questions about the use of all sources of
health information—both written and oral—were
included on the background questionnaire and are
included in this report.
Background Questionnaire
The 2003 National Assessment of Adult Literacy
household background questionnaire was used to
collect data about various demographic and back-
ground characteristics of adults. The questionnaire
also included a section of questions specifically relat-
ed to health status, preventive health practices, health
insurance coverage, and sources of information about
health issues. A summary of the questions that were
used in analyses in this report is presented in appen-
dix B on page 27.
A separate background questionnaire was developed
for adults in prison. Questions about health status
and sources of information about health issues were
included on the prison background questionnaire.
The background questionnaire for prison inmates
did not include questions about health insurance or
about Internet use.
Interpreting Literacy Results
In addition to reporting average literacy scores, anoth-
er way to report results is by grouping adults with sim-
ilar scores into a relatively small number of categories,
often referred to as performance levels. Performance
levels are used to identify and characterize the relative
strengths and weaknesses of adults falling within vari-
ous ranges of literacy ability. Describing the adult pop-
ulation according to such levels allows analysts, policy-
makers, and others to examine and discuss the typical
performance and capabilities of specified groups with-
in the adult population.
2
The National Research Council’s Board on Testing
and Assessment (BOTA) Committee on Performance
Levels for Adult Literacy recommended a new set of
performance levels for the prose, document, and
quantitative scales for the NAAL, instead of using the
same reporting levels used for the 1992 National
Adult Literacy Survey.
3
Drawing on the committee’s recommendations, the
U.S. Department of Education decided to report
NAAL results for the prose, document, and quantita-
tive scales by using four literacy levels for each scale:
Below Basic, Basic, Intermediate, and Proficient.Table 1-1
summarizes the knowledge, skills, and capabilities that
adults needed to demonstrate to be classified into one
of the four levels on the prose, document, and quan-
titative scales. The items used for the health literacy
scale were also classified as prose, document, and
quantitative items.
The BOTA Committee on Performance Levels for
Adult Literacy was not asked to recommend per-
formance levels for the health scale, because every
health literacy task was included on the prose, docu-
ment, or quantitative scale. NCES mapped each
health task to the health literacy scale based on their
level of difficulty as prose, document, and quantita-
tive items (see figure 1-1). Each health task was
mapped to the prose, document, or quantitative scale
(depending upon which scale the task fell into) at the
point on the scale (i.e., the scale score) where an
adult with that scale score would have a 67 percent
probability of doing the task correctly. The 67 per-
cent probability convention was used by the BOTA
Committee for the prose, document, and quantitative
scales. That point on the scale was classified as to
whether it fell into the Below Basic, Basic, Intermediate,
or Proficient level. Cut-points for the health scale were
established so that each task was classified into the
The Health Literacy of America’s Adults
4
2
For more information on NAAL performance levels see White
and Dillow (2005).
3
For a description of the process followed by the BOTA
Committee on Performance Levels see Hauser et al. (2005) and
White and Dillow (2005).
Chapter 1: Introduction
same level on the health scale as on the respective
prose, document, or quantitative scale.
A health literacy task that was mapped to the
Proficient level on the prose scale was also mapped to
the Proficient level on the health scale. For example, as
shown in figure 1-1, a task that requires a respondent
to “evaluate information to determine which legal
document is applicable to a specific health care situ-
ation” maps to 325 on the health scale, which is at
the Proficient level. The same task maps to 361 on the
prose scale, which is also at the Proficient level.
Similarly, as shown in figure 1-1, a task that requires a
respondent to “determine a healthy weight range for a
person of a specified height, based on a graph that
relates height and weight to body mass index (BMI)”
mapped to 290 on the health scale. This task was also
included on the document scale, where it mapped to
320, or the Intermediate level. The cut-points for the
5
Table 1-1. Overview of the literacy levels
Level and definition Key abilities associated with level
Below Basic indicates no more than the
most simple and concrete literacy skills.
Score ranges for Below Basic:
Prose: 0–209
Document: 0–204
Quantitative: 0–234
Basic indicates skills necessary to perform
simple and everyday literacy activities.
Score ranges for Basic:
Prose: 210–264
Document: 205–249
Quantitative: 235–289
Intermediate indicates skills necessary to
perform moderately challenging literacy
activities.
Score ranges for Intermediate:
Prose: 265–339
Document: 250–334
Quantitative: 290–349
Proficient indicates skills necessary to per-
form more complex and challenging literacy
activities.
Score ranges for Proficient:
Prose: 340–500
Document: 335–500
Quantitative: 350–500
Adults at the Below Basic level range from being nonliterate in English to having
the abilities listed below:
■ locating easily identifiable information in short, commonplace prose texts
■ locating easily identifiable information and following written instructions in
simple documents (e.g., charts or forms)
■ locating numbers and using them to perform simple quantitative operations
(primarily addition) when the mathematical information is very concrete and
familiar
■ reading and understanding information in short, commonplace prose texts
■ reading and understanding information in simple documents
■ locating easily identifiable quantitative information and using it to solve sim-
ple, one-step problems when the arithmetic operation is specified or easily
inferred
■ reading and understanding moderately dense, less commonplace prose texts
as well as summarizing, making simple inferences, determining cause and
effect, and recognizing the author’s purpose
■ locating information in dense, complex documents and making simple infer-
ences about the information
■ locating less familiar quantitative information and using it to solve problems
when the arithmetic operation is not specified or easily inferred
■ reading lengthy, complex, abstract prose texts as well as synthesizing infor-
mation and making complex inferences
■ integrating, synthesizing, and analyzing multiple pieces of information located
in complex documents
■ locating more abstract quantitative information and using it to solve multi-
step problems when the arithmetic operations are not easily inferred and the
problems are more complex
NOTE:Although the literacy levels share common names with the National Assessment of Educational Progress (NAEP) levels, they do not correspond to the NAEP levels.
SOURCE:Hauser, R.M,Edley,C.F.Jr., Koenig,J.A., and Elliott, S.W.(Eds.). (2005).Measuring Literacy: Performance Levels for Adults, Interim Report.Washington, DC: National Academies Press;White, S.and Dillow, S.
(2005).Key Concepts and Features of the 2003 National Assessment of Adult Literacy (NCES 2006-471). U.S. Department of Education.Washington,DC: National Center for Education Statistics.
6
The Health Literacy of America’s Adults
health scale were set so that the task would also map to
the Intermediate level on the health scale.
As shown in figure 1-1, health tasks that mapped to the
Below Basic level required locating straightforward pieces
of information in short simple texts or documents.
Health tasks that mapped to the Basic level generally
required finding information in texts and documents
that were somewhat longer than those in the Below
Basic level, and the information to be found was usual-
ly more complex. For example, a task that mapped to
the Basic level required giving two reasons a person with
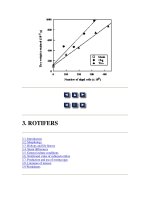
Figure 1-1. Difficulty of selected health literacy tasks: 2003
Proficient
310–500
Intermediate
226–309
Basic
185–225
Below Basic
0–184
Health literacy scale
0
150
200
100
250
300
400
350
500
253 Determine what time a person can take a prescription medication, based on information on the prescription drug label that relates the
timing of medication to eating.
266 Find the age range during which children should receive a particular vaccine, using a chart that shows all the childhood vaccines and the
ages children should receive them.
290 Determine a healthy weight range for a person of a specified height, based on a graph that relates height and weight to body mass
index (BMI).
382 Calculate an employee’s share of health insurance costs for a year, using a table that shows how the employee’s monthly cost varies
depending on income and family size.
366 Find the information required to define a medical term by searching through a complex document.
325 Evaluate information to determine which legal document is applicable to a specific health care situation.
145 Identify what it is permissible to drink before a medical test, based on a set of short instructions.
101 Circle the date of a medical appointment on a hospital appointment slip.
169 Identify how often a person should have a specified medical test, based on information in a clearly written pamphlet.
228 Identify three substances that may interact with an over-the-counter drug to cause a side effect, using information on the
over-the-counter drug label.
201 Explain why it is difficult for people to know if they have a specific chronic medical condition, based on information in a one-page article
about the medical condition.
202 Give two reasons a person with no symptoms of a specific disease should be tested for the disease, based on information in a clearly
written pamphlet.
NOTE:The position of a question on the scale represents the average scale score attained by adults who had a 67 percent probability of successfully answering the question.Only selected questions are presented.
Scale score ranges for performance levels are referenced on the figure.
SOURCE:U.S. Department of Education,Institute of Education Sciences,National Center for Education Statistics,2003 National Assessment of Adult Literacy.
7
Chapter 1: Introduction
no symptoms of a specific disease should be tested for
the disease by using information in a pamphlet, while a
task that mapped to the Below Basic level required find-
ing one piece of information–the date–on a medical
appointment slip that was shorter and simpler than the
text in the Basic task.
Health tasks that mapped to the Intermediate level went
beyond simply searching texts and documents to find
information. Most health tasks that mapped to the
Intermediate level required adults to interpret or apply
information that was presented in complex graphs,
tables, or other health-related texts or documents.
Health tasks that mapped to the Proficient level required
drawing abstract inferences, comparing or contrasting
multiple pieces of information within complex texts or
documents, or applying abstract or complicated infor-
mation from texts or documents.
Conducting the Survey
4
The 2003 National Assessment of Adult Literacy
included two samples: (1) adults ages 16 and older liv-
ing in households and (2) prison inmates ages 16 and
older in federal and state prisons.The assessment was
administered to approximately 19,000 adults: 18,000
adults living in households and 1,200 prison inmates.
Each sample was weighted to represent its share of the
total population of the United States, and the samples
were combined for reporting. Household data collec-
tion was conducted from March 2003 through
February 2004; prison data collection was conducted
from March through July 2004. For the household
sample, the screener response rate was 81 percent and
the background questionnaire response rate was 77
percent.The final household sample response rate was
62 percent.
4
For the prison sample, 97 percent of pris-
ons that were selected for the study agreed to partic-
ipate and the background questionnaire response rate
for prison inmates was 91 percent. The final prison
sample response rate was 88 percent.
Household interviews were conducted in respon-
dents’ homes; prison interviews usually took place in
a classroom or library in the prison.Whenever possi-
ble, interviewers administered the background ques-
tionnaire and assessment in a private setting.
Assessments were administered one-on-one using a
computer-assisted personal interviewing (CAPI)
system programmed into laptop computers.
Respondents were encouraged to use whatever aids
they normally used when reading and when per-
forming quantitative tasks, including eyeglasses, mag-
nifying glasses, rulers, and calculators.
Three percent of adults were unable to participate in
the assessment because they could not communicate
in either English or Spanish or because they had a
mental disability that prevented them from being
tested. Literacy scores for these adults could not be
estimated, and they are not included in the results
presented in this report, or in other NAAL reports.
An additional 3 percent of adults were routed to
an alternative assessment (the Adult Literacy
Supplemental Assessment,or ALSA) based upon their
performance on the seven easy screening tasks at the
beginning of the literacy assessment. Because they
could be placed on the NAAL scale based on their
responses to the seven screening tasks,ALSA partici-
pants were classified into the Below Basic level on
each NAAL literacy scale. Results for the adults who
were placed in the ALSA are included in the results
presented in this report.
Additional information on ALSA, sampling,
response rates, and data collection procedures is in
appendix C.
4
Nonresponse bias analyses are discussed on page 34 of the report.
All percentages in this section are weighted. For the unweighted
percentages, see tables C-1 and C-2 in appendix C.
Interpretation of Results
The statistics presented in this report are estimates of
performance based on a sample of respondents,
rather than the values that could be calculated if
every person in the nation answered every question
on the assessment. Estimates of performance of the
population and groups within the population were
calculated by using sampling weights to account for
the fact that the probabilities of selection were not
identical for all respondents. Information about the
uncertainty of each statistic that takes into account
the complex sample design was estimated by using
Taylor series procedures to estimate standard errors.
The analyses in this report examine differences related
to literacy based on self-reported background charac-
teristics among groups in 2003, by using standard t
tests to determine statistical significance. Statistical sig-
nificance is reported at p < .05. Differences between
averages or percentages that are statistically significant
are discussed by using comparative terms such as
higher or lower. Differences that are not statistically
significant either are not discussed or are referred to
as “not statistically significant.” Failure to find a sta-
tistically significant difference should not be inter-
preted as meaning that the estimates are the same;
rather, failure to find a difference may also be due to
measurement error or sampling.
Detailed tables with estimates and standard errors for
all tables and figures in this report are in appendices
D and E. Appendix C includes more information
about the weights used for the sample and the pro-
cedures used to estimate standard errors and statisti-
cal significance.
Cautions in Interpretation
The purpose of this report is to examine the rela-
tionship between health literacy and various self-
reported background factors. This report is purely
descriptive in nature. Readers are cautioned not to
draw causal inferences based solely on the results pre-
sented here. It is important to note that many of the
variables examined in this report are related to one
another, and complex interactions and relationships
have not been explored here.
Organization of the Report
Chapter 2 of this report examines how health litera-
cy varied across groups with different demographic
characteristics, as well as the relationship between
health literacy and highest level of educational attain-
ment and poverty status.
Chapter 3 explores the relationship between literacy
and overall health. The analyses in the chapter also
examine the literacy of adults who have different
types of health insurance or no health insurance.The
chapter concludes with an examination of the rela-
tionship between literacy and sources of printed and
nonprinted information used by adults.
8
The Health Literacy of America’s Adults
Demographic Characteristics and
Health Literacy
D
ata from the 2003 National Assessment of
Adult Literacy (NAAL) allow examina-
tions of the relationships between demo-
graphic characteristics and literacy. Analyses from
the assessment showed differences in prose, docu-
ment, and quantitative literacy for adults with dif-
ferent demographic characteristics. For example,
women had higher prose and document literacy
than men, while women’s average quantitative liter-
acy was lower than men’s.The average prose, docu-
ment, and quantitative literacy of White adults was
higher than the average literacy of adults of other
races or ethnicities.Adults 65 years of age and older
had the lowest average prose, document, and quan-
titative scores among all age groups (Kutner et al.
2005).
The relationships between health literacy and
demographic characteristics of adults are examined
in this chapter.Also examined are the relationships
between health literacy and highest level of educa-
tional attainment and poverty. All the analyses in
this chapter are based on the combined household
and prison samples.
9
Total Population
Gender
Race and Ethnicity
Language Spoken Before
Starting School
Age
Highest Level of Educational
Attainment
Poverty Threshold
Summary
2
CHAPTER TWO