Tài liệu Báo cáo khoa học: Applications and trends in systems biology in biochemistry docx
Bạn đang xem bản rút gọn của tài liệu. Xem và tải ngay bản đầy đủ của tài liệu tại đây (1.13 MB, 91 trang )
REVIEW ARTICLE
Applications and trends in systems biology in
biochemistry
Katrin Hubner, Sven Sahle and Ursula Kummer
ă
Department of Modeling of Biological Processes, COS Heidelberg/BioQuant, University of Heidelberg, Germany
Keywords
metabolism; modeling; quantitative
experiments; signaling; simulation; systems
biology
Correspondence
U. Kummer, Department of Modeling of
Biological Processes, COS Heidelberg/
BioQuant, University of Heidelberg, Im
Neuenheimer Feld 267, 69120 Heidelberg,
Germany
Fax: +49 6221 5451483
E-mail: ursula.kummer@bioquant.
uni-heidelberg.de
(Received 10 January 2011, revised 31 May
2011, accepted 15 June 2011)
Systems biology has received an ever increasing interest during the last
decade. A large amount of third-party funding is spent on this topic, which
involves quantitative experimentation integrated with computational
modeling. Industrial companies are also starting to use this approach more
and more often, especially in pharmaceutical research and biotechnology.
This leads to the question of whether such interest is wisely invested and
whether there are success stories to be told for basic science and/or technology/biomedicine. In this review, we focus on the application of systems
biology approaches that have been employed to shed light on both
biochemical functions and previously unknown mechanisms. We point out
which computational and experimental methods are employed most
frequently and which trends in systems biology research can be observed.
Finally, we discuss some problems that we have encountered in publications in the field.
doi:10.1111/j.1742-4658.2011.08217.x
Introduction
One of the fastest growing fields in the life sciences is
systems biology. PubMed lists more than 3000 articles
which, in one way or the other, use this term in their
title or abstract during the last decade (precisely, the
last 11 years, including the year 2000) compared to a
mere three articles in the preceding century. Obviously,
this is partially a result of the fact that the term ‘systems biology’ had not been used during that time.
However, as we will see in the present review, also
with respect to research that would now be called systems biology, there is clearly significantly less to report
before the year 2000. Interestingly, looking closely at
the more than 3000 articles using the term ‘systems
biology’, it becomes apparent that approximately half
of them describe methodological work either on the
computational or the experimental side, and more than
one-third are classified as reviews. However, only a
handful of the latter represent reviews that actually
review a set of articles. Most of the articles classified
as reviews could rather be classified as news and views.
Another large portion of articles uses the term ‘systems
biology’ in a different sense than we would understand
it (e.g. stating that they are investigating a biological
system and it is therefore systems biology). This latter
point necessitates the definition of the term ‘systems
biology’ as we (the authors) understand it, as outlined
below.
Systems biology combines quantitative experimental
data from complex molecular networks (e.g. biochemistry, cell biology in the living cell) with computational
modeling. Here, computational modeling does not
refer to statistical models or models of data mining
but rather to a mathematical or ’virtual’ representation
of the living system of interest in the computer, where
Abbreviations
FBA, flux balance analysis; ODE, ordinary differential equation; PDE, partial differential equation..
FEBS Journal 278 (2011) 2767–2857 ª 2011 The Authors Journal compilation ª 2011 FEBS
2767
Systems biology in biochemical research
K. Hubner et al.
ă
there is also a correspondence between parts of the
biological system and parts of the model. This
representation allows a computational analysis using
systems theoretical approaches.
This definition is probably shared by many scientists
in the field [1,2]. The actual term ‘systems biology’ was
´
coined in 1968 by Mesarovic [3]. Soon afterward, the
first conceptional developments on the theoretical side
layed the foundation of the field, such as metabolic
control analysis [4,5] and biochemical systems theory
[6]. In the 1980s, the development of extreme currents
and elementary modes [7,8] and stochastic frameworks
[9] followed. These conceptional approaches were then
implemented in specialized software tools, as will be
seen below.
However, to identify articles encompassing applications of systems biology approaches that fit this definition, we note that, on the one hand, it is completely
insufficient to search for articles that explicitely state the
term ‘systems biology’. On the other hand, it is extremely difficult to define good keywords for a search in
PubMed because the term ‘model’, as well as similar
terms, are used in many different contexts and it is very
cumbersome to find relevant work in the multitude of
articles that are available with obvious keywords.
Therefore, we first defined the scope of the articles
that we would like to review. These have to fit the
above definition in the sense that they represent example cases of applying systems biology approaches combining experimental investigation and computational
modeling (subsequent to the year 2000). In addition,
fitting our own expertise and the scope of the FEBS
Journal, we restrict ourselves to typical intracellular
biochemical systems. These include signaling systems
and metabolic pathways. Here, models have to
describe explicit biochemical mechanisms of systems
and have to relate to quantitative experimental measurements of systems behaviour appearing in the same
article or in previous publications. Correspondingly,
purely experimental findings have to directly relate to
previous computational models.
We do not focus on cell biological, biomechanical or
higher level descriptions of multicellular systems in the
present review. Finally, the systems biology of the cell
cycle and of circadian rhythms have been properly
reviewed recently [10,11] and therefore we do not
include them here. With this scope in mind, we optimized a keyword search for PubMed with the following
limits: year AND [in silico OR biology OR biochem*
OR bioinformatic* OR biological OR intracellular OR
biophysic* AND (modeling OR modeling OR ‘mathematical model’ OR ‘mathematical models’ OR ‘kinetic
model’ OR ‘kinetic models’ OR ‘differential equation
2768
model’ OR ‘multiscale model’ OR ‘dynamic model’ OR
‘quantitative model’ OR ‘computational model’ OR ‘petri
net model’ OR ‘agent based model’ OR ‘stochastic
model’ OR ‘flux balance’ OR ‘dynamical model’ OR
‘homeostatic model’ OR (model AND simulation*)]
NOT ‘protein structure’ NOT ‘animal model’ NOT
review[publication type] AND (metabolism OR metabolic OR signal* OR ‘cell cycle’ OR oscillation*) NOT
pharmacokinetic* NOT pharmacodynamic* NOT electrophysiolog* NOT ‘molecular modeling’ NOT ‘molecular modeling’ NOT ‘homology modeling’ NOT
‘homology modeling’ NOT ‘MD simulation’ NOT
‘molecular dynamics’).
This search resulted in approximately 17 000 articles
of which we read the titles and abstracts and, in cases
of doubt, the article as such to select the relevant ones,
resulting in the approximately 400 articles that we
review. Even though we try to be as complete as possible, it is obvious that we employed heuristics with the
above strategy and also certainly and unintentionally
missed one or more articles. However, checking
against, for example, the BioModels database [12],
which contains a curated collection of biological models, and against older reviews that review the field partially and from a different viewpoint [13–16], we
estimate that we cover at least a representative
80–90% of those articles in the field that fit the above
requirements. Thus, we offer a good picture of the
field with respect to the last decade.
Similar to the highly informative review about mathematical modeling of metabolism by Gombert and
Nielson [17], all articles are summarized extensively in
tabular form to allow a quick overview of the published material. Table 1 provides information on the
studied system, major findings, and employed computational and experimental approaches, as well as the
reference itself. Figure 1 provides a tree-like view on
how the articles are ordered to ease navigation within
Table 1 itself. The ordering is by systems because
many scientists will be interested in a specific system,
even across species boundaries. The large number of
articles reviewed prohibits a detailed referencing in the
text when discussing general trends. For recapitulating
these trends, we would make reference to Table 1.
General developments
There is a clear increase in publications that employ
systems biology approaches to tackle open biochemical
questions. Because we focused on original work, rather
than on any articles just mentioning systems biology,
this fact is not blurred by the vastly increasing number
of news and views, articles and minireviews, and so
FEBS Journal 278 (2011) 2767–2857 ª 2011 The Authors Journal compilation ª 2011 FEBS
K. Hubner et al.
ă
Systems biology in biochemical research
me
Fig. 1. Systematic tree for the navigation of Table 1. Articles are ordered according to the system studied and systems are annotated with
gene ontology (GO) numbers.
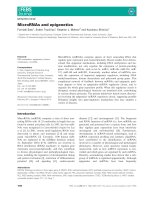
on. The number of articles appearing annually within
the last few years is approximately four-fold greater
than in the year 2000 (Fig. 2). Before 2000, there are
60
Articles
# publications
50
40
30
20
10
0
10
20
09
20
08
20
07
20
06
20
05
20
04
20
03
20
02
20
01
20
00
20
Year
Fig. 2. Number of publications describing systems biology applications in biochemistry per year.
only few articles that actually would fall into the above
category, as quickly checked by the same query. Of
course, many valuable modeling articles had been published before 2000, although very few of these worked
directly with quantitative biological data. One of the
exceptions is the field of calcium signaling, where computational modeling very quickly formed the basis for
deciphering the mechanism behind calcium oscillations
[18].
In addition to the general trend to use systems biology approaches more frequently, there is also an
increasing trend in the articles to actually validate the
developed models with experimental data. This is definitely a positive development because the actual validation of the computational models aids in an
assessment of their reliability.
The number of journals publishing systems biology
work is also increasing, although there are only a few
journals that often appear in our data. The most
FEBS Journal 278 (2011) 2767–2857 ª 2011 The Authors Journal compilation ª 2011 FEBS
2769
Systems biology in biochemical research
K. Hubner et al.
ă
35
Journals
30
# publications
25
20
15
10
5
0
g
in
try
e
er
is
on
m
ne
gi
he
oS
lc
en
PL
ic
ca
ol
gi
g
lo
ab
io
rin
et
fb
ee
M
in
lo
ng
na
l
oe
ur
na
bi
Jo
ur
d
gy
jo
an
lo
y
io
BS
og
lb
y
FE
ol
na
og
hn
tio
ol
ec
ta
bi
ot
pu
al
Bi
m
ic
y
et
co
or
og
oS
ol
he
bi
ft
PL
s
lo
em
na
st
ur
y
sy
Jo
og
ar
ol
ul
bi
ec
s
ol
em
M
l
st
na
ur
jo
C
sy
al
ic
ys
ph
BM
o
Bi
common ones covering the whole period (Fig. 3) are
Biophysical Journal, Journal of Theoretical Biology, Biotechnology and Bioengineering, FEBS Journal (formerly
European Journal of Biochemistry), Journal of Biological
Chemistry and Metabolic Engineering. Within the last
few years, more specialized journals have established
themselves. Here, the most frequently appearing ones
are BMC Systems Biology, Molecular Systems Biology
and PLoS Computational Biology. There is a clear trend
from the more engineering-oriented journals to the basic
research-oriented ones over the years.
Often, systems biology articles are quite long, which
is a result of the fact that they have to describe both
experimental and computational methodology, as well
as the results from both. Similar to many other fields,
this has led to a rather annoying trend, namely putting
extensive material into a supplement. This results in
articles that are almost uncomprehensible without
reading the supplementary material as well. Very often,
the actual model that is the basis for the results, and
thus is an absolutely crucial part of the work, ends up
in the supplementary information. Even though it is
often possible to download this material along with
the original article, it does not make the reading of a
scientific work any easier by pushing central information into an additional file. The least that journals
should consider is an automated packaging of both
files into one pdf for download. Fortunately, this has
already been implemented for least a few journals (e.g.
Nature, Journal of Biological Chemistry). One additional issue arising with this policy is the fact that
2770
Fig. 3. Number of publications describing
systems biology applications in biochemistry
in the years 2000–2010 in the 10 most
often used journals.
references cited in the supplementary material do not
count for citation indices and the computation of
h-indices, etc. The latter was confirmed by us by
testing different examples from several journals. Placing formulations of models as well as crucial methodology, both on the experimental and computational
sides, into the supplementary material then implies a
strong and systematic disadvantage for the careers of
young scientists working in these fields.
Systems studied
The organisms studied with systems biology
approaches in the last decade are by a large extend
eukaryotic and only to a lesser extent prokaryotic
(Fig. 4). Among the first, classical scientific model
organisms such as Saccharomyces cerevisiae, Mus musculus, Rattus norvegicus and, for obvious reasons,
Homo sapiensare dominant. However, studies also
include the parasite Trypanosoma brucei [19,20] or the
biotechnologically relevant Aspergillus niger [21–24].
Again, the prokaryotic key players are typical model
organisms, such as Eschericia coli, although biotechnologically relevant organisms, such as Lactococcus lactis
and Corynebacterium glutamicum, are often investigated. Prokaryotic organisms of medical relevance,
such as Mycobacterium tuberculosis [25,26] and Heliobacter pylori [27,28] appear twice, with many others
only appearing once.
The biochemical networks that are studied in these
prokaryotic organisms have been mostly of metabolic
FEBS Journal 278 (2011) 2767–2857 ª 2011 The Authors Journal compilation ª 2011 FEBS
K. Hubner et al.
ă
90
Systems biology in biochemical research
ulated kinase, mitogen-activated protein kinase and
janus kinase-signal transducer and activator of transcription signaling (Fig. 5).
There is a clear trend towards eukaryotic and signaling systems over the years, which coincides with
the above observation that basic medical science has
discovered systems biology later than the engineering
field, in which metabolic engineering has been one of
the forerunners. Signaling pathways are either studied
in isolation or, with increasing numbers, in an integrative way, encompassing several pathways and their
cross-talk. Unexpectedly, only few articles feature a
combination of signaling and metabolic networks.
However, these are also increasing slowly.
Thus, the overall picture depicts more specific metabolic systems studied in the beginning of the decade,
often published in biotechnology/engineering journals.
Later, signaling systems became slighty prevalent,
reflecting systems of medical relevance in eukaryotic
cells. Finally, with the whole genome-based metabolic
models becoming more approachable from approximately 2005 onwards, metabolism has been catching
up again (Fig. 6).
Organisms
80
# publications
70
60
50
40
30
20
10
0
na
ia
al
th
A. r
ge
ni
A. is
ev um
la
ic
X. am
ut
gl
C. s
i
ct cus
la
i
L. veg
or
.n
R
li
co lus
E.
cu
us e
. m isia
M
v
re
ce s
S. ien
ap
.s
H
Fig. 4. Number of publications describing systems biology applied
to the study of specific organisms in biochemistry in the years
2000–2010.
nature, reflecting their importance in biotechnology.
Here, apart from the central energy metabolism including glycolysis (Fig. 5), pathways of biotechnological
importance such as lysine synthesis [29] in Corynebacterium glutamicum, sucrose synthesis [30–32] in sugar
cane, xanthan biosynthesis in Xanthomonas campestris
[33] and citrate metabolism in fruit [34] have been
studied.
By contrast, most studies on eukaryotic (e.g. mammalian and especially human) cells focus on signaling
systems, which reflects the importance of these systems
in the context of cancer research. Dominant examples
are calcium, nuclear factor jB, extracellular signal-reg-
Experimental approaches
Here, we focus on the experimental approaches used in
conjecture with computational modeling, in the core of
a systems biology approach.
Experimental data in systems biology are obviously
either time-series data (if used for dynamic models) or
single time point data (if used for static models). How-
70
Metabolism
Signaling
60
# publications
50
40
30
20
10
0
s
si
to
op
Ap
T
TA
-S
K)
R
(E
K
JA
K
κB
F-
te
ra
id
ac
m
N
AP
M
B/
o
y
iu
c
al
I-κ
C
in
Am
g
er
d
hy
e
al
sc
FEBS Journal 278 (2011) 2767–2857 ª 2011 The Authors Journal compilation ª 2011 FEBS
En
bo
ar
C
l
ra
e-
om
t
en
C
en
G
Fig. 5. Number of publications describing
systems biology applied to specific biochemical systems in the years 2000–2010.
2771
Systems biology in biochemical research
K. Hubner et al.
ă
60
50
Metabolism
Genome-scale metabolism
Signaling
Metabolism + signaling
# publications
40
30
20
10
0
10
20 9
0
20 8
0
20
07
20 6
0
20
05
20 4
0
20 3
0
20 2
0
20 1
0
20 0
0
20
10
20 9
0
20
08
20 7
0
20 6
0
20
05
20 4
0
20 3
0
20 2
0
20 1
0
20 0
0
20
Prokaryotes
Eukaryotes
ever, in some cases, dynamic models are also build
using steady-state profiles. This is true for data used as
a basis for modeling, as well as for data used for
model validation.
The compounds commonly measured in time-series
analysis are metabolites (hereon, we refer to all chemical species other than macromolecules as metabolites),
proteins and, to a lesser extent (in the light of the present reviewed systems), RNA and DNA. In addition,
enzymatic activities and cellular properties such as
growth and death rates are measured in a time-dependent manner.
Only a very few metabolites are measured in vivo
(e.g. using imaging technologies). Examples that frequently are measured using in vivo methods are calcium (in the more than 30 publications studying
calcium signaling) and NADPH [35]. In only a few
cases, NMR is also employed for in vivo studies [36–
39]. However, most often, metabolites are extracted
from cells and measured in vitro. This puts limits on
the time resolution of the experimental results, which
does not allow fast dynamics to be followed. In many
cases, the temporal dynamics of the system of studied
is rich over a relatively short time-scale (e.g. calcium,
p53, NF-jB, nuclear factor jB), which was only discovered after in vivo methods became available for
these compounds. Together with the relatively high
level of noise in many of the in vitro measurements,
this highlights the need for a strong effort to develop
new methods for detecting metabolites in vivo, such as
the development of nanosensors [40], with the expecta2772
Fig. 6. Number of publications per year
describing signaling, metabolic systems,
whole-genome metabolic models or mixed
systems in prokaryotic and eukaryotic
organisms, respectively.
tion that many as yet unknown behaviours will be
discovered subsequently.
The in vitro characterization of metabolites after preparing cell extracts is mostly carried out using HPLC
or assay kits and, in a few cases, with GC-MS.
The dominant technology to measure protein concentrations is immunoblotting. Approximately 70% of
all manuscripts featuring protein concentrations (e.g.
in the context of signaling) use this method, which
again requires cells to be killed and their contents
extracted. Therefore, it is quite unexpected that live
cell imaging methods for proteins (e.g. using green
fluorescent protein-tagged antibodies) are also still only
rarely used in systems biology studies.
Obviously, live cell imaging on the one hand is also
hampered by several problems (e.g. the need to follow
many cells to be able to judge cell–cell variation, signal
to noise ratios with proteins or metabolites of low concentrations and the autofluorescence of some cell
types). On the other hand, in vitro measurements are
limited by the above mentioned facts, such as low time
resolution and experimental errors and, in addition,
these methods are often so laborous and expensive
that they are only performed in up to three replicas
with computed standard deviations that have dubious
statistical meaning. Often, replicas are purely technical
and not biological replicas.
Enzyme activities are usually measured with
standard kits. If these are measured in cell extracts or
in vitro under physiological conditions, they are a
valuable source for the modeling. However, studies
FEBS Journal 278 (2011) 2767–2857 ª 2011 The Authors Journal compilation ª 2011 FEBS
K. Hubner et al.
ă
Systems biology in biochemical research
frequently refer to kinetic parameters measured in test
tubes using isolated enzymes under highly unphysiological conditions as the basis for an initial parameter
guess, although these often have been shown to be far
away from actual in vivo parameters [41].
Computational approaches
Studying the computational approaches used in the
systems biology of cellular biochemistry, it is highly
obvious that the formalism of ordinary differential
equations (ODE) is the dominating approach (Fig. 7).
This does not necessarily mean that the scientist
actually set up ODEs by him/herself because several
software tools used in systems biology allow a processbased modeling (e.g. the entry of a reaction scheme)
and translate this reaction scheme into ODEs. However, temporal or dynamic models are mainly simulated and analyzed in this mathematical framework.
All other approaches do not yet play a significant role.
Nevertheless, stochastic approaches are specifically
used in the context of signaling networks because these
networks often feature low copy numbers of molecules,
which poses problems for the ODE framework. Static
or stoichiometric models are mainly analyzed using
flux balance analysis (FBA), which has become the second most abundant computational approach in recent
years.
Unexpectedly, few models describe spatial as well as
temporal developments of biochemical systems. This
might be the result of a variety of factors: First, corresponding experimental data are still sacrve. Second,
250
Modeling methodology
# publications
200
150
100
50
0
t
ne
rid
yb
H
ri
t
Pe
c
gi
et
ic
st
ha
oc
Lo
St
om
i
ch
oi
E
PD
St
E
D
O
ric
Fig. 7. Number of publications describing systems biology applied
to biochemistry in the years 2000–2010 using a specific computational modeling approach.
computational methods (e.g. for the parametrization of
the models) are much less developed than for ODE
based models. Furthermore, there are fewer userfriendly software tools that allow spatial modeling
and, thus, more programming is required for this type
of modeling. This is also reflected by the fact that no
increase in the usage of spatial models has been
observed over the last 10 years. Unless more userfriendly tools become available, we consider that there
will be no clear trend in this direction. For the few
spatial models available, the dominating computational
approach is the use of partial differential equations
(PDEs).
The computational tasks applied on the temporal or
dynamic models are mostly simulations, the fitting of
model parameters to experimental data and the
computation of sensitivities to detect dependencies in
the model. Here, parameter estimation is rarely and only
recently linked to a discussion of parameter
identifiability, which appears to enter the field only now.
This certainly should have more impact in the future.
Very often, the exact methodology by which these
computations are carried out is not documented in the
articles. We find it utterly unexpected that, overall, it
is only a minority of articles that properly describe
(in a reproducible way) the computational research
performed in the study. Thus, very often, neither the
exact numerical algorithm used to simulate a specific
behaviour, nor the software with which the computation was performed, are given and referenced. This has
somewhat improved over the course of the decade,
although it appears that there is a lack of awareness of
the fact that a documentation of the computational
approaches is scientifically as important as the documentation of the experimental data, which are never
missing. This problem is increased by the trend (as
noted above) of some journals to put crucial (e.g.
methodological) information, and sometimes even the
whole description of the computational model, into the
supplementary material. Once again, this renders articles incomprehensible without reading the supplement
and puts those scientists who are working on new
methods and tools into the unfortunate situation that
their work might only be cited in the supplement,
which does not appear in the science citation index.
Accordingly, it is very hard to review the trends within
the algorithms and tools. It is, however, clear that the
commercial software matlab (MathWorks, Natick,
MA, USA; www.mathworks.com) is the dominating
software (Fig. 8). Additional commercial software
packages that are widely used are mathematica (Wolfram Research, Champaign, IL, USA; www.wolfram.com) and, for the set-up and analysis of whole-genome
FEBS Journal 278 (2011) 2767–2857 ª 2011 The Authors Journal compilation ª 2011 FEBS
2773
Systems biology in biochemical research
K. Hubner et al.
ă
120
Software
# publications
100
80
60
40
20
0
ey
el a
rk onn
Be ad
m A
BR
O
C
Ph
m
b
la
n
w
O
i
as
a
ic
ep
G
at
m
he
at
M
T
U
PA
XP I
S
PA
O
C
O
D
N
y
en
LI
Si
G
N
at
M
Fig. 8. Number of publications describing systems biology applied
to biochemistry in the years 2000–2010 employing the ten most
commonly used software tools.
models, lindo (Lindo Systems Inc., Chicago, IL,
USA; www.lindo.com) and simpheny (genomatica,
San Diego, CA, USA; www.genomatica.com). In addition, free and specialized software, such as xppaut
[42], copasi [43] and gepasi [44], as well as the semiacademic software berkeley madonna [45], are being
used more and more often.
The above observation about poorly documented
computational methodology unfortunately also applies
to models themselves. Thus, often important parameters (e.g. initial values) are missing and sometimes
incomplete equations are given. Here, it should be
mentioned that a very few journals (e.g. FEBS Journal)
actually employ curation of models submitted for publication via usage of JWS Online [46], which helps to
avoid these problems.
Two trends within the last few years are positive
and interesting. First, slowly, more and more models
receive proper validation within the study. This means
that the model is not only used to reproduce data
(often after parameter fitting), but also is actually used
for independent predictions of observable behaviour,
which is then experimentally verified and thus the
model is validated. The second trend is the re-use of
models. Thus, more and more studies rely on previous
modeling work, either by extending or modifying existing models, or by merging existing models with each
other or with new models. This trend is supported by
and necessitates the development of software standards
for the exchange (sbml [47], cellml [48]) and documentation of models (miriam [49], as well as central
data resources for the storage of computational
models, such as the well curated BioModels database
2774
[12], JWS Online [46], the CellML repository [50] or,
for whole-genome scale models, the BIGG database
[51]). These approaches will hopefully help to overcome problems of insufficient documentation, at least
on the model side. On the side of computational methods, there is currently a similar community effort that
creates a standard for minimal information called
MIASE [52].
Finally, we would like to mention that by and large
our results agree with an analysis of currently used
computational standards, approaches and tools that
was based on questionaires distributed to computational scientists in the field and published in 2007 [53].
However, because of the differring nature of data generation, there are also a few significant differences (e.g.
approaches) that are rarely mentioned in published
research (as in the present review) and are more often
named in the questionaires. As an example, probabilistic approaches occur at least in 20% of the questionaire responses, although they are significantly less
prevalent in the publications reviewed here. A similar
situation applies to some software tools that are more
dominant in the questionaire-based survey and are
scarcely noted in the actual publications.
Discussion
The last decade has seen a strong increase in research
carrying the label systems biology, which combines
computational and quantitative experimental investigations at a systems level. On the one hand, we were surprised by the fact that only a small fraction of the
publications found using the keyword ’systems biology’
actually reflect applications of systems biology
approaches to biological systems resulting in new biological insights. However, on the other hand, and by
restricting ourselves to purely biochemical applications,
we identified almost 400 publications that represent
successful applications of systems biology, and the
numbers are clearly on the rise. The success of these
applications is obviously often visible as a scientific success and only rarely as a success that results directly in
biotechnological or pharmaceutical developments.
However, this is of course true for most scientific disciplines. Stating that these are successful applications
does not imply that all of the cited articles are very
strong cases; many are and some are not.
However, our aim is to give a comprehensive and
representative overview of systems biology research, its
trends and the commonly used computational, as well
as experimental, methodologies. Therefore, we decided
not to focus on just a few articles but, rather, to try to
gather a complete as possible set of publications.
FEBS Journal 278 (2011) 2767–2857 ª 2011 The Authors Journal compilation ª 2011 FEBS
K. Hubner et al.
ă
When compiling this review, we came across a number of unexpected problems, some of which we have
already noted above. Missing documentation of computational research is a clear and abundant problem
that makes systems biology research less tractable than
it should be. In our opinion, this must change. In addition, terminologies in such an interdisciplinary field
have to be chosen with care. To exemplify this point,
in many publications, the term ‘experiment’ is used for
a computational experiment (e.g. a simulation). This is
quite normal in theoretical or mathematical literature.
However, in the context of systems biology, this is confusing because it is sometimes not so easy to judge, if the
word experiment’, without reference to computations
(e.g. not using the more explicit term ‘computational
experiment’), actually refers to wet-laboratory or drylaboratory experiments. Therefore, articles should
either clearly emply the term ‘computational experiments’ when refering to these or use the more commonly used terminology (e.g. ‘simulations’). Another
confusing term is ‘prediction’ because some articles use
this word to indicate that their model fits experimental
data (after parameter fitting), whereas, usually, the
term is needed to state that the model actually predicts
experimental behaviour to which it has not been fitted
in the first place. It is sometimes almost impossible to
tell the difference, if it is not clearly indicated which
data have been used for fitting and which have been
used for model validation.
We would like to pick up a question raised at the
beginning of this review: does systems biology represent an approach that offers anything beyond the
existing purely experimental approaches? Reading the
approximately 400 articles featured in this review, we
would answer with a clear ’yes’. This does not mean
that all studies published have gained many new
insights from the integration of computational modeling with quantitative experimentation, although the
majority clearly do. In many studies, computational
modeling is used to understand complex mechanisms
that are difficult to dissect by pure experimental means
and to generate likely hypotheses that push forward
our comprehension of the complicated interactions and
their functionality in quite an efficient way. There are
many examples for this and we only want to highlight
a few of them. One of the prominent examples is the
field of calcium signal transduction where our current
understanding of the mechanism behind the often
observed calcium oscillations would not have been
possible without computational modeling, with this
having already started way before the onset of systems
biology, as reviewed here. However, important new
insights have been generated in the past decade. Thus,
Systems biology in biochemical research
the impact of calcium dynamics on CaMKII has been
studied in detail (see entry 210 in Table 1). Other
downstream effects have been investigated, including
apoptosis (see entry 229 in Table 1). In addition, the
stochasticity of single calcium channels and its impact
on the overall dynamics have been investigated in
many studies (see entry 314 in Table 1).
Further signal transduction systems that exhibit
complex behaviour have been explained quite well with
the aid of validated computational modeling. We are
only able to mention a few examples and, once again,
have to refer to the material in Table 1. A beautiful
study explains the response of yeast to osmotic shock
(see entry 382 in Table 1). The control of MAPK signaling has also been predicted and experimentally confirmed (see entry 334 in Table 1). Recently, receptor
properties that are crucial for the information processing within erythropoietin signaling are also identified
(see entry 259 in Table 1).
On the metabolic side, exciting examples of integrated
systems biology approaches are the identification of key
players in the branched amino acid metabolism in Arabidopsis thaliana (see entry 3 in Table 1), understanding
the metabolism of tobacco grown on media containing
different cytokines (see entry 176 in Table 1) and the
investigation of substrate channeling in the urea cycle
(see entry 191 in Table 1).
However, and apart from this more basic scientific
benefit, namely the increased understanding of
complex mechanisms, there are also very applied
examples of research benefitting from systems biology.
Thus, systems biology has been used for the prediction
of drug targets (e.g. see entries 84, 104 and 197 in
Table 1) and for biotechnological engineering (e.g. see
entries 14, 16, 36 and 392 in Table 1). Obviously, most
of these have not entered industrial production yet
(more time is needed for that) but it is clear that systems biology has become a tool for enabling the discoverery of new potential applications, similar to
molecular modeling and bioinformatics in the past.
Finally, we want to stress once more that we have
restricted ourselves to biochemical systems and
excluded systems of cell cycle and circadian rhythms
because these have been reviewed recently [10,11].
Therefore, the actual number of successful systems
biology studies will be several times the amount
reviewed here.
Acknowledgements
We would like to acknowledge the Klaus Tschira
Foundation and the BMBF (Virtual Liver Network
and SysMO) for funding.
FEBS Journal 278 (2011) 2767–2857 ª 2011 The Authors Journal compilation ª 2011 FEBS
2775
Systems biology in biochemical research
K. Hubner et al.
ă
References
1 Kitano H (2002) Systems biology: a brief overview.
Science 295, 1662–1664.
2 Noble D (2003) The future: putting Humpty-Dumpty
together again. Biochem Soc Trans 31, 156–158.
´
3 Mesarovic M (1968) Systems Theory and Biology.
Springer, New York, NY, pp. 59–87.
4 Heinrich R & Rapoport TA (1973) Linear theory of
enzymatic chains; its application for the analysis of the
crossover theorem and of the glycolysis of human erythrocytes. Acta Biol Med Ger 31, 479–494.
5 Kacser H & Burns JA (1973) The control of flux.
Symp Soc Exp Biol 27, 65–104.
6 Savageau MA (1969) Biochemical systems analysis. I.
Some mathematical properties of the rate law for the
component enzymatic reactions. J Theor Biol 25,
365–369.
7 Clarke B (1981) Complete set of steady states for the
general stoichiometric dynamical system. J Chem Phys
75, 4970–4979.
8 Schuster S (1994) On elementary fluxmodes in biochemical reaction systems at steady state. Journal of
Biological Systems 2, 165–182.
9 Gillespie D (1977) Exact stochastic simulation of
coupled chemical reactions. The Journal of Physical
Chemistry 81, 2340–2361.
10 Csikasz-Nagy A (2009) Computational systems
biology of the cell cycle. Brief Bioinformatics 10, 424–
434.
11 Hubbard KE, Robertson FC, Dalchau N & Webb AA
(2009) Systems analyses of circadian networks. Mol
Biosyst 5, 1502–1511.
12 Le Novere N, Bornstein B, Broicher A, Courtot M,
Donizelli M, Dharuri H, Li L, Sauro H, Schilstra M,
Shapiro B, Snoep JL & Hucka M (2006) BioModels
Database: a free, centralized database of curated,
published, quantitative kinetic models of biochemical
and cellular systems. Nucleic Acids Res 34, D689–
D691.
13 Wishart DS (2007) Current progress in computational
metabolomics. Brief Bioinformatics 8, 279–293.
14 Otero JM & Nielsen J (2010) Industrial systems biology. Biotechnol Bioeng 105, 439–460.
15 Kholodenko BN (2006) Cell-signalling dynamics
in time and space. Nat Rev Mol Cell Biol 7, 165–
176.
16 Klipp E & Liebermeister W (2006) Mathematical modeling of intracellular signaling pathways. BMC Neurosci 7 (Suppl 1), S10.
17 Gombert AK & Nielsen J (2000) Mathematical
modelling of metabolism. Curr Opin Biotechnol 11,
180–186.
18 Schuster S, Marhl M & Hofer T (2002) Modelling of
simple and complex calcium oscillations. From single-
2776
19
20
21
22
23
24
25
26
27
28
29
30
31
cell responses to intercellular signalling. Eur J Biochem
269, 1333–1355.
´
Helfert S, Estevez AM, Bakker B, Michels P &
Clayton C (2001) Roles of triosephosphate isomerase
and aerobic metabolism in Trypanosoma brucei.
Biochem J 357, 117–125.
Albert MA, Haanstra JR, Hannaert V, Roy JV,
Opperdoes FR, Bakker BM & Michels PAM (2005)
Experimental and in silico analyses of glycolytic flux
control in bloodstream form Trypanosoma brucei.
J Biol Chem 280, 28306–28315.
David H, Akesson M & Nielsen J (2003) Reconstruction of the central carbon metabolism of Aspergillus niger. Eur J Biochem 270, 4243–4253.
Prathumpai W, Gabelgaard JB, Wanchanthuek P, de
Vondervoort PJI, de Groot MJL, McIntyre M & Nielsen J (2003) Metabolic control analysis of xylose
catabolism in Aspergillus. Biotechnol Prog 19, 1136–
1141.
de Groot MJL, Prathumpai W, Visser J & Ruijter
GJG (2005) Metabolic control analysis of Aspergillus niger L-arabinose catabolism. Biotechnol Prog 21,
1610–1616.
Andersen MR, Nielsen ML & Nielsen J (2008) Metabolic model integration of the bibliome, genome,
metabolome and reactome of Aspergillus niger. Mol
Syst Biol 4, 178.
Singh VK & Ghosh I (2006) Kinetic modeling of
tricarboxylic acid cycle and glyoxylate bypass in
Mycobacterium tuberculosis, and its application to
assessment of drug targets. Theor Biol Med Model 3,
27.
Fang X, Wallqvist A & Reifman J (2009) A systems
biology framework for modeling metabolic enzyme
inhibition of Mycobacterium tuberculosis. BMC Syst
Biol 3, 92.
Schilling CH, Covert MW, Famili I, Church GM,
Edwards JS & Palsson BO (2002) Genome-scale metabolic model of Helicobacter pylori 26695. J Bacteriol
184, 45824593.
Franke R, Muller M, Wundrack N, Gilles ED, Klamt
ă
S, Kahne T & Naumann M (2008) Host-pathogen sysă
tems biology: logical modelling of hepatocyte growth
factor and Helicobacter pylori induced c-Met signal
transduction. BMC Syst Biol 2, 4.
Hua Q, Yang C & Shimizu K (2000) Metabolic control analysis for lysine synthesis using Corynebacterium glutamicum and experimental verification. J Biosci
Bioeng 90, 184–192.
Rohwer JM & Botha FC (2001) Analysis of sucrose
accumulation in the sugar cane culm on the basis of in
vitro kinetic data. Biochem J 358, 437445.
Schafer WE, Rohwer JM & Botha FC (2004) A kinetic
ă
study of sugarcane sucrose synthase. Eur J Biochem
271, 3971–3977.
FEBS Journal 278 (2011) 2767–2857 ª 2011 The Authors Journal compilation ª 2011 FEBS
K. Hubner et al.
ă
32 Uys L, Botha FC, Hofmeyr JHS & Rohwer JM
(2007) Kinetic model of sucrose accumulation in
maturing sugarcane culm tissue. Phytochemistry 68,
2375–2392.
33 Letisse F, Chevallereau P, Simon JL & Lindley N
(2002) The influence of metabolic network structures
and energy requirements on xanthan gum yields.
J Biotechnol 99, 307–317.
´
34 Lobit P, Genard M, Wu BH, Soing P & Habib R
(2003) Modelling citrate metabolism in fruits:
responses to growth and temperature. J Exp Bot 54,
2489–2501.
35 Brasen JC, Barington T & Olsen LF (2010) On the
mechanism of oscillations in neutrophils. Biophys
Chem 148, 82–92.
36 Roman BB, Meyer RA & Wiseman RW (2002)
Phosphocreatine kinetics at the onset of
contractions in skeletal muscle of MM creatine kinase
knockout mice. Am J Physiol Cell Physiol 283,
C1776–C1783.
37 Martini S, Ricci M, Bonechi C, Trabalzini L, Santucci
A & Rossi C (2004) In vivo 13C-NMR and modelling
study of metabolic yield response to ethanol stress in a
wild-type strain of Saccharomyces cerevisiae. FEBS
Lett 564, 63–68.
38 Beard DA (2006) Modeling of oxygen transport and
cellular energetics explains observations on in vivo
cardiac energy metabolism. PLoS Comput Biol 2,
e107.
39 Andersen AZ, Carvalho AL, Neves AR, Santos H,
Kummer U & Olsen LF (2009) The metabolic pH
response in Lactococcus lactis: an integrative experimental and modelling approach. Comput Biol Chem
33, 71–83.
40 Ozalp VC, Pedersen TR, Nielsen LJ & Olsen LF
(2010) Time-resolved measurements of intracellular
ATP in the yeast Saccharomyces cerevisiae using a
new type of nanobiosensor. J Biol Chem 285, 37579–
37588.
41 Teusink B, Passarge J, Reijenga CA, Esgalhado E, van
der Weijden CC, Schepper M, Walsh MC, Bakker
BM, van Dam K, Westerhoff HV & Snoep JL (2000)
Can yeast glycolysis be understood in terms of in vitro
kinetics of the constituent enzymes? Testing biochemistry. Eur J Biochem 267, 5313–5329.
42 Ermentrout G (2002) Simulating, Analyzing, and
Animating Dynamical Systems: A Guide to XPPAUT
for Researchers and Students. SIAM, Philadelphia, PA.
43 Hoops S, Sahle S, Gauges R, Lee C, Pahle J, Simus
N, Singhal M, Xu L, Mendes P & Kummer U (2006)
COPASI - a COmplex PAthway SImulator. Bioinformatics 22, 3067–3074.
Systems biology in biochemical research
44 Mendes P (1993) GEPASI: a software package for
modelling the dynamics, steady states and control of
biochemical and other systems. Comput Appl Biosci 9,
563–571.
45 Macey R & Oster G,
46 van Gend C, Conradie R, du Preez FB & Snoep JL
(2007) Data and model integration using JWS Online.
In Silico Biol (Gedrukt) 7, 27–35.
47 Hucka M, Finney A, Sauro HM, Bolouri H, Doyle
JC, Kitano H, Arkin AP, Bornstein BJ, Bray D,
Cornish-Bowden A, Cuellar AA, Dronov S, Gilles
ED, Ginkel M, Gor V, Goryanin II, Hedley WJ,
Hodgman TC, Hofmeyr JH, Hunter PJ, Juty NS,
Kasberger JL, Kremling A, Kummer U, Le Novere
N, Loew LM, Lucio D, Mendes P, Minch E, Mjolsness ED, Nakayama Y, Nelson MR, Nielsen PF,
Sakurada T, Schaff JC, Shapiro BE, Shimizu TS,
Spence HD, Stelling J, Takahashi K, Tomita M,
Wagner J & Wang J (2003) The systems biology
markup language (SBML): a medium for representation and exchange of biochemical network models.
Bioinformatics 19, 524–531.
48 Lloyd CM, Halstead MDB & Nielsen PF (2004)
CellML: its future, present and past. Prog Biophys
Mol Biol 85, 433–450.
49 Le Novere N, Finney A, Hucka M, Bhalla US,
Campagne F, Collado-Vides J, Crampin EJ, Halstead
M, Klipp E, Mendes P, Nielsen P, Sauro H, Shapiro
B, Snoep JL, Spence HD & Wanner BL (2005) Minimum information requested in the annotation of
biochemical models (MIRIAM). Nat Biotechnol 23,
1509–1515.
50 Lloyd CM, Lawson JR, Hunter PJ & Nielsen PF
(2008) The CellML Model Repository. Bioinformatics
24, 2122–2123.
51 Schellenberger J, Park JO, Conrad TM & Palsson B
(2010) BiGG: a Biochemical Genetic and Genomic
knowledgebase of large scale metabolic reconstructions. BMC Bioinformatics 11, 213.
52 Waltemath D, Adams R, Beard DA, Bergmann FT,
Bhalla US, Britten R, Chelliah V, Cooling MT,
Cooper J, Crampin EJ, Garny A, Hoops S, Hucka M,
Hunter P, Klipp E, Laibe C, Miller AK, Moraru I,
Nickerson D, Nielsen P, Nikolski M, Sahle S, Sauro
HM, Schmidt H, Snoep JL, Tolle D, Wolkenhauer O
`
& Novere NL (2011) Minimum information about a
simulation experiment (miase). PLoS Comput Biol 7,
e1001122.
53 Klipp E, Liebermeister W, Helbig A, Kowald A &
Schaber J (2007) Systems biology standards –
the community speaks. Nat Biotechnol 25, 390–
391.
FEBS Journal 278 (2011) 2767–2857 ª 2011 The Authors Journal compilation ª 2011 FEBS
2777
2778
2
Amino acid,
arginine
synthesis
Metabolism
1 Amino acid,
arginine
catabolism
to NO and
polyamines
Entry System
Escherichia
coli
NG, aorta
endothelial
cells
Organism,
cells
Model
The outcome of combinations of
perturbations on cellular arginine
concentration was predicted
accurately, establishing the model
as a powerful tool for the design
of arginine-overproducing strains
ODE
Low affinity transporter and arginase ODE
share the control of the fluxes
through the pathways involving
arginine as a precurser of nitric
oxide and polyamines
Major findings
sim
ss, sim,
MCA
Analysis
XPPAUT
PERL
Own in
Software
Refers to single time
point of metabolites
and enzyme activities
measured by assays
Experiment
Single time point of
fluxes and metabolites
measured by HPLC
and assay kits
NG
Access
NG
Caldara M, Dupont G,
Leroy F, Goldbeter A,
Vuyst LD & Cunin R
(2008) J Biol Chem
283, 6347–6358.
Montanez R,
˜
´
Rodrıguez-Caso
´
´
C, Sanchez-Jimenez
F & Medina MA
(2008)
Amino Acids
34, 223–229.
References
Table 1. All articles describing systems biology approaches in biochemistry are summarized, as ordered by: (a) system studied; (b) organism and (c) publication year, accompanied by reference details and major findings, as well as the computational approaches, the accessibility of the model and the experimental approaches employed. ‘Model’ indicates the principal modeling approach (stoich being the abbreviation for stoichiometric model). ‘Analysis’ represents the model analysis employed [ss, steady-state; sim, simulation; fit, parameter estimation; opt,
optimization; sens, sensitivities (including metabolic control analysis; MCA); bif, bifurcation analysis; stab, stability; rob, robustness; pident, parameter identifiability; mident, model identification; infer, parameter inference; mred, model reduction; osc, oscillations; SNA, stoichiometric network analysis; FDA, flux distribution analysis]. Only publically available databases are
cited for accessibility because local websites are often not online after a short time (which was also observed during the current review). Here, BM gives the ID in the BioModels database. JWS or CellML indicate the availability in JWS Online or the CellML repository, respectively. NG, not given (or, in the case of accessibility, not available). Only computational methods for the actual modeling and experimental methods that are used as basis or for the validation of the computational models are listed. Single time points of metabolites or proteins,
etc., indicate that single measurements either at steady-state or at a different specific state (e.g. exponential growth of cells) are taken. C5a, complement 5a; CaMKII, calmodulin-dependent protein kinase II; CaN, calcineurin; DHPR, dihydropyridine receptor; EGF, epidermal growth factor; EMSA, electromobility shift assay; Epo, erythropoietin; ER, endoplasmic reticulum;
ERK, extracellular signal-regulated kinase; FBP, fructose 1,6-bisphosphate; FRET, fluorescence resonance energy transfer; GPCR, G protein-coupled receptor; GSH, glutathione; HRG,
heregulin; IFN, interferon; IKK, I-jB kinase; IL, interleukin; IP3, inositol 1,4,5-triphosphate; IRS, insulin receptor substrate; JAK-STAT, janus kinase-signal transducer and activator of transcription, mitogen-activated protein kinase; LPS, lipopolysaccharide; MAPK, mitogen-activated protein kinase; MCF, macrophare chemotactic factor; MCIP, modulatory calcineurin-interacting protein; MDCK, Madin Darby canine kidney; MEF, mouse embryonic fibroblast; MEK, MAP kinase/ERK kinase; NFAT, nuclear factor of activated T-cells; NF-jB, nuclear factor jB; NGF,
nerve growth factor; PDGF, platelet-derived growth factor; PDGFR, platelet-derived growth factor receptor; PEP, phosphoenolpyruvate; PFK, phosphofructokinase; PFL, pyruvate formatelyase; Pi, inorganic phosphate; PI3K, phosphatidylinositol 3-kinase; PIP, phosphatidylinositol 4,5-bisphosphate; PKA, protein kinase A; PKC, protein kinase C; PLC, phospholipase C; PP2A,
type 2A phosphatase; PPP, pentose phosphate pathway; PTS, photransferase system; ROS, reactive oxygen species; RyR, ryanodine receptor; SERCA, SERCA, sarcoplasmic reticulum
Ca2+ ATPase; TCA, tricarboxylic acid; TGF, transforming growth factor; TNF, tumor necrosis factor; TRAIL, TNF-related apoptosis-inducing ligand; XAIP, X-linked inhibitor of apoptosis protein.
Systems biology in biochemical research
K. Hubner et al.
ă
FEBS Journal 278 (2011) 27672857 ª 2011 The Authors Journal compilation ª 2011 FEBS
Organism,
cells
FEBS Journal 278 (2011) 2767–2857 ª 2011 The Authors Journal compilation ª 2011 FEBS
8 Amino acid,
threonine
synthesis
7 Amino acid,
methionine
and threonine
synthesis
Escherichia
coli
Flux control is distributed in
the first three enzymes
Homo sapiens,
Metabolic consequences of
HepG2
pathological changes associated with
(hepatoma cells) key pathway enzymes are studied.
Loss of allosteric regulation of
cystathionine b-synthase by
adenosylmethionine leads to
an increase in homocysteine
concentration
Mammalian,
The behavior of a constructed model
hepatocytes
in response to genetic abnormalities
and dietary deficiencies is similar to
the changes seen in a wide variety
of experimental studies
Arabidopsis
Under near physiological conditions,
thaliana
S-adenosylmethionine, but not AMP,
modulates the partition of a
steady-state flux of
phosphohomoserine
5 Amino acid,
methionine
6 Amino acid,
methionine
Corynebacterium
glutamicum
A crucial result is the identification of
allosteric interactions whose
function is not to couple demand
and supply but to maintain a high
independence between fluxes in
competing pathways. Another result
is the identification of the threonine
concentration as the most sensitive
variable in the system, suggesting a
regulatory role for threonine at a
higher level of integration
Targets for optimization of lysine
production (aspartokinase, lysine
permease, extracellular lysine
concentration) were predicted
and tested successfully
Major findings
4 Amino acid,
lysine
biosynthesis
3 Amino acid,
Arabidopsis
aspartate-derived thaliana
synthesis of
Lys, Met,
Thr, Ile
Entry System
Table 1. (Continued).
ODE
sim,
sens
sim,
sens, fit
sim
ODE
ODE
ss
ss, sim,
MCA
ss, sim,
MCA, fit
Analysis
ODE
ODE
ODE
Model
SCAMP
GRAPH
KALEIDA-
NG
NG
MATLAB
COPASI
Software
Experiment
NG
BM 66,
JWS,
CellML
BM 68,
JWS,
CellML
CellML
Time series and single time
points of metabolites and
fluxes measured by
spectrophotometry; refers
to single time points
of fluxes
Single time point of
metabolites measured
by HPLC and assay
kits; enzyme activities
measured by assay kits
Refers to single time
points of metabolites
Time series of metabolites
measured by HPLC and
enzyme assays; biomass
and cell number
measured by
spectrophotometry
Single time point of fluxes
and metabolites measured
by HPLC and radio labeling
BM
212
NG
Single time point of
proteins measured by
ELISA; enzyme kinetics
measured by assays;
refers to single time
points of metabolites
Access
Chassagnole C, Fell
DA, Ras B, Kudla B
ă
& Mazat JP (2001)
Biochem J 356,
433–444.
Prudova A,
Martinov MV,
Vitvitsky VM,
Ataullakhanov FI &
Banerjee R (2005)
Biochim Biophys
Acta 1741,
331–338.
Reed MC, Nijhout
HF, Sparks R &
Ulrich CM (2004)
J Theor Biol 226,
33–43.
Curien G, Ravanel S
& Dumas R (2003)
Eur J Biochem 270,
4615–4627.
Hua Q, Yang C &
Shimizu K (2000)
J Biosci Bioeng 90,
184–192.
Curien G, Bastien O,
Robert-Genthon M,
Cornish-Bowden A,
Cardenas ML &
Dumas R (2009)
Mol Syst Biol
5, 271.
References
K. Hubner et al.
ă
Systems biology in biochemical research
2779
2780
13 Carbohydrate,
formaldehyde
12 Carbohydrate,
ethanol
production
Petunia hybrida
11 Aromatic
compound,
benzene
Including the second law of
thermodynamics as a criterion in the
model development is essential to
establish a realistic model
An integrated optimization of the
whole network leads to a significant
increase in tryptophan production
rate for all systems under study
Major findings
Phenylacetaldehyde synthase activity
is the primary controlling factor for
the phenylacetaldehyde branch of
the benzenoid network. By contrast,
control of flux through the
b-oxidative and non-b-oxidative
pathways is highly distributed
Saccharomyces
A model developed succeeded in
cerevisiae
describing and interpreting the
effects of ethanol stress. In
particular, the ratio between the
kinetic constants associated with
ethanol production and glucose
consumption gave the estimation of
the metabolic yield of the processes
in perfect agreement with
experimental results
Methylobacterium Results demonstrate the role of
extorquens
redundancy in formaldehyde
metabolism and uncover a new
paradigm for coping with toxic,
high-flux metabolic intermediates:
a dynamic, interconnected
metabolic loop
Corynebacterium
glutamicum
Escherichia
coli
Organism,
cells
10 Amino acid,
valine/leucine
biosynthesis
9 Amino acid,
tryptophan
synthesis
Entry System
Table 1. (Continued).
ss, fit
sim
ODE
ODE
sim, fit,
sens
sim, fit,
stab, sens
sim,
opt
Analysis
ODE
ODE
ODE
Model
MATLAB
NG
MATLAB
MMT2
NG
Software
Single time point of fluxes
measured by radiolabeling
NG
Time series of
metabolites
measured by
GC-MS
NG
Time series of metabolites
measured by NMR
Time series of
metabolites measured
by HPLC-MS/MS
NG
NG
Refers to enzyme
kinetic measurements
Experiment
NG
Access
Marx CJ, Dien SJV
& Lidstrom ME
(2005) PLoS
Biol 3, e16.
Martini S, Ricci M,
Bonechi C,
Trabalzini L,
Santucci A &
Rossi C (2004)
FEBS Lett 564,
63–68.
Schmid JW, Mauch
K, Reuss M, Gilles
ED & Kremling A
(2004)
Metab Eng 6,
364–377.
Magnus JB,
Hollwedel D,
Oldiges M &
Takors R (2006)
Biotechnol Prog
22, 1071–1083.
´
Colon AM, Sengupta
N, Rhodes D,
Dudareva N &
Morgan J (2010)
Plant J 62, 64–76.
References
Systems biology in biochemical research
K. Hubner et al.
ă
FEBS Journal 278 (2011) 27672857 ê 2011 The Authors Journal compilation ª 2011 FEBS
Saccharomyces
cerevisiae
Entamoeba
histolytica
Lactococcus
lactis
Lactococcus
lactis
Mus musculus,
brain
15 Carbohydrate,
glycolysis
16 Carbohydrate,
glycolysis
17 Carbohydrate,
glycolysis
18 Carbohydrate,
glycolysis
Organism,
cells
14 Carbohydrate,
glycerol
synthesis
Entry System
Table 1. (Continued).
FEBS Journal 278 (2011) 2767–2857 ª 2011 The Authors Journal compilation ª 2011 FEBS
Results suggest relations between
the changes in morphology,
glycolytic flux, ATP production
and ATP levels
Feedforward activation of pyruvate
kinase by fructose 1,6-bisphosphate
allows the organism to enter a
holding pattern during periods of
glucose starvation
Modeling Pi explicitly and regulation
of pyruvate kinase (by Pi and FBP),
PFK (by PEP) and GAPDH (by
NADH) are critical to describe
observations (rapid increase in PEP,
Pi and gradual decrease in FBP)
during glucose run-out experiments
The developed model indicates that
the best strategy to increase flux
through the pathway is not to
increase enzyme activity, substrate
concentration or coenzyme
concentration alone but, instead,
to increase all of these parameters
in conjunction with each other
The model also indicated that, in
order to diminish the amoebal
glycolytic flux by 50%, it was
required to decrease hexokinase or
3-phosphoglycerate mutase by 24%
and 55%, respectively, or by 18%
for both enzymes
Major findings
ODE
ODE
ODE
ODE
ODE
Model
ss, sim
sim, sens,
fit, mident
ss, sim
sim,
MCA
ss, sim,
sens
Analysis
MATHEMATICA
MATLAB
GEPASI
NG
GEPASI
Software
Refers to time series of
metabolites measured
by 13C- and 31P-NMR
Refers to time series of
metabolites measured
by 13C-NMR
JWS,
CellML
Time series of metabolite
and enzyme activities
measured by
spectrophotometry;
single time point of
proteins measured by
immunoblotting
NG
Single time points of enzyme
activities measured by assay
kits; single time points of
metabolites measured by
assay kits and HPLC
JWS
JWS
Saavedra E,
´
´
Marın-Hernandez
A, Encalada R,
Olivos A,
Mendoza´
Hernandez G &
´
Moreno-Sanchez R
(2007) FEBS J
274, 4922–4940.
Hoefnagel MHN,
Starrenburg MJC,
Martens DE,
Hugenholtz J,
Kleerebezem M,
van Swam II,
Bongers R,
Westerhoff HV &
Snoep JL (2002)
Microbiology 148,
1003–1013.
Voit EO, Almeida J,
Marino S, Lall R,
Goel G, Neves AR
& Santos H (2006)
Syst Biol (Stevenage)
153, 286–298.
´
´
Olah J, Klivenyi P,
´
´
Gardian G, Vecsei
L, Orosz F,
Kovacs GG,
Westerhoff HV &
´
Ovadi J (2008)
FEBS J 275,
4740–4755.
Time series of metabolites
Cronwright GR,
measured by assays; fluxes Rohwer JM &
Prior BA (2002)
measured by assay kits;
enzyme activities measured Appl Environ
by assays
Microbiol 68,
4448–4456.
BM 76,
JWS,
CellML
References
Experiment
Access
K. Hubner et al.
ă
Systems biology in biochemical research
2781
2782
Organism,
cells
20 Carbohydrate,
glycolysis
Saccharomyces
cerevisiae
Saccharomyces
cerevisiae
19 Carbohydrate,
glycolysis
Saccharomyces
cerevisiae
Saccharomyces
cerevisiae
21 Carbohydrate,
glycolysis
NG, pancreatic
b-cells
Entry System
Table 1. (Continued).
22 Carbohydrate,
glycolysis
23 Carbohydrate,
glycolysis
The model reproduces several
experimental findings about
synchronization of oscillations across
cells, although coupling via
acetaldehyde does not explain the
measurements sufficiently
A constructed model agrees with
almost all experimentally known
stationary concentrations and
metabolic fluxes, with the frequency
of oscillation and with the majority
of other experimentally known
kinetic and dynamical variables
The period of oscillation in glycolysis
depends on the PFK activity. The
ratio of glucokinase and aldolase
and/or GAPD activities are adequate
as characteristics of the glucose
responsiveness
It is shown that, in essence, the
common acetaldehyde concentration
can be modeled as a small
perturbation on the ’pacemaker’,
whose effect on the period of the
oscillations of cells in the same
suspension is indeed such that
a synchronization develops
It is demonstrated that a model of
yeast glycolysis can be constructed
from in vitro data. The model is
tested successfully and the
remaining deviations from
experimental data are discussed
Major findings
ODE
ODE
ODE
ODE
ODE
Model
sim, fit, osc
sim, bif, osc
ss, sim
sim, osc
sim, bif,
osc
Analysis
Own software
AUTO
SCAMP
NG
NG
Software
Experiment
Time series of metabolites
measured by
spectrophotometry
BM 61, JWS, Time series of
CellML
metabolites measured
by spectrophotometry;
refers to single time
points of metabolites
BM 206,
Refers to single time
JWS, CellML point of metabolites
measured by assays
BM 64,
Single time point of
JWS, CellML metabolites measured
by enzyme assays,
HPLC, MS and
others; enzyme kinetics
measured by assays
BM 254,
JWS
BM
Refers to time series
225 + 236,
of metabolites
JWS, CellML
Access
Hynne F, Danø S &
Sørensen PG (2001)
Biophys Chem 94,
121–163.
Teusink B, Passarge
J, Reijenga CA,
Esgalhado E, van
der Weijden CC,
Schepper M,
Walsh MC, Bakker
BM, van Dam K,
Westerhoff HV &
Snoep JL (2000)
Eur J Biochem
267, 5313–5329.
Wolf J & Heinrich R
(2000) Biochem J
345, 321–334.
Bier M, Bakker BM
& Westerhoff HV
(2000) Biophys J
78, 1087 –1093.
Westermark PO &
Lansner A (2003)
Biophys J 85,
126–139.
References
Systems biology in biochemical research
K. Hubner et al.
ă
FEBS Journal 278 (2011) 27672857 ê 2011 The Authors Journal compilation ª 2011 FEBS
FEBS Journal 278 (2011) 2767–2857 ª 2011 The Authors Journal compilation ª 2011 FEBS
Saccharomyces
cerevisiae
Trypanosoma
brucei
Trypanosoma
brucei
25 Carbohydrate,
glycolysis
26 Carbohydrate,
glycolysis
27 Carbohydrate,
glycolysis
De-repressed yeast glycolysis shows
three major flux-control modes. In
two of them, hexose transport
dominates the flux control. A third
regime is under control of PFK but
may not be physiologically
accessible
Extension of a original model with
regulation of pyruvate
decarboxylase, a reversible
alcohol dehydrogenase, and drainage
of pyruvate. Using the method of
time rescaling in the extended
model, the description of the
transient closed-system experiments
is significantly improved
Triosephosphate isomerase is
probably essential for bloodstream
trypanosome survival but not for the
insect-dwelling procyclics, which
preferentially use amino acids
Major findings
An analysis of the control of glycolytic
flux in bloodstream form T. brucei
shows that hexokinase, PFK and
pyruvate kinase are in excess, albeit
less than predicted. Depletion of
PFK and enolase had an effect on
the activity of some other
glycolytic enzymes
28 Carbohydrate,
Rattus norvegicus, The data suggest that either
glycolysis,
hepatocytes
glycolysis is a net consumer of ATP,
gluconeogenesis
or glycolysis and gluconeogenesis
are compartmentalized to a greater
extent than is generally supposed
29 Carbohydrate,
Bos taurus,
The interaction of glycolysis and PPPs
glycolysis, PPP
brain extracts
is studied. The model correctly
reproduces the measured behavior
for small variations in hexokinase
activity but not for large changes
Saccharomyces
cerevisiae
Organism,
cells
24 Carbohydrate,
glycolysis
Entry System
Table 1. (Continued).
ss, sim,
MCA
sim
sim, fit
ss, sim,
fit, sens
Analysis
sim
sim, fit
ODE
ODE
ODE
ODE
Model
stochastic
ODE
GEPASI
PASCAL
Own in
JARNAC
NG
CVODE
GEPASI
Software
NG
NG
BM
211
BM 71,
JWS
NG
´
Time series of proteins
Helfert S, Estevez
measured by
AM, Bakker B,
immunoblotting;
Michels P &
RNA measured
Clayton C (2001)
by northern
Biochem J
blotting and metabolites
357, 117–125.
(not specified)
Time series of proteins
Albert MA,
measured by
Haanstra JR,
immunoblotting;
Hannaert V, Roy
enzyme activities measured JV, Opperdoes
FR, Bakker BM &
by assay kits; fluxes
measured by enzymatic
Michels PAM
assay and polarography
(2005) J Biol Chem
280, 28306–28315.
Time series of metabolites
Jones ME, Berry
measured by ion-change
MN & Phillips JW
chromatography; fluxes
(2002) J Theor Biol
measured by radiolabeling
217, 509–523.
assays
´
Time series of fluxes
Orosz F, Wagner G,
measured by
Ortega F, Cascante M
´
spectrophotometry
& Ovadi J (2003)
Biochem Biophys
Res Commun 309,
792–797.
Pritchard L & Kell
Refers to time series
DB (2002) Eur J
of metabolites measured
Biochem 269,
by spectroscopy,
assays, HPLC and MS;
3894–3904.
refers to single time point
of enzyme kinetics
measured by assays
Time series of
Hald BO & Sørensen
metabolites measured
PG (2010)
by fluorescent spectroscopy Biophys J
99, 3191–3199.
BM 172
References
Experiment
Access
K. Hubner et al.
ă
Systems biology in biochemical research
2783
2784
Penicillium
chrysogenum
Escherichia coli
31 Carbohydrate,
glycolysis, PPP
C3 plants
Plants
32 Carbohydrate,
glycolysis, PPP
Brassica napus
Organism,
cells
30 Carbohydrate,
glycolysis, PPP
Entry System
Table 1. (Continued).
33 Carbohydrate,
photosynthesis
34 Carbohydrate,
photosynthesis
We suggest that in the cell,
oscillations with a period of a few
seconds, corresponding to the time
between photosynthetic CO2 fixation
and photorespiratory CO2 release,
underlie the dynamics of metabolism
in C3 plants
Results suggest that typical
partitioning in C3 leaves might be
suboptimal for maximizing the
light-saturated rate of
photosynthesis. Altering the
investment of various enzymes
was indicated to lead to increased
CO2 uptake rate
Different methods for calculating
fluxes from measurements are
compared. The fluxes that are
determined using 13C-labeling data
are shown to be highly dependent
on the underlying metabolic network
Net flux of glucose through the
oxidative PPP accounts for close to
10% of the total hexose influx. The
reductant produced by the oxidative
PPP accounts for at most 44% of
the NADPH and 22% of total
reductant needed for fatty acid
synthesis
For the first time, a kinetic model
of carbon metabolism linked to the
PTS is constructed
Major findings
Analysis
ss (cumulative
bondomer
sim)
sim
ss, sim,
opt
Stoich
ss, sim,
fit, MCA,
stab, osc
Stoich
ODE
ss, fit
Model
ODE
ODE
MATLAB
NG
SPADIT
OPTDESX
ACSL,
EXCEL
Software
Experiment
JWS
BM 166
NG
Refers to single time point
of metabolites
Refers to time series
of fluxes
Single time point of
metabolites measured
by NMR
Time series of metabolites
measured by different
assays
NG
NG
Single time point of
metabolites measured
by GC-MS and NMR
Access
Zhu XG, de Sturler
E & Long SP (2007)
Plant Physiol 145,
513–526.
Chassagnole C,
Noisommit-Rizzi N,
Schmid JW,
Mauch K & Reuss
M (2002)
Biotechnol Bioeng
79, 53–73.
van Winden WA,
van Gulik WM,
Schipper D,
Verheijen PJT,
Krabben P, Vinke
JL & Heijnen JJ
(2003) Biotechnol
Bioeng 83, 75–92.
Roussel MR &
Igamberdiev AU
(2010) BioSystems
103, 230–238.
Schwender J,
Ohlrogge JB &
Shachar-Hill Y
(2003) J Biol
Chem 278,
29442–29453.
References
Systems biology in biochemical research
K. Hubner et al.
ă
FEBS Journal 278 (2011) 27672857 ê 2011 The Authors Journal compilation ª 2011 FEBS
Organism,
cells
Lactococcus
lactis
Lactococcus
lactis
Rattus
norvegicus,
liver
Anabaena
Saccharum
officinarum
Entry System
35 Carbohydrate,
pyruvate
36 Carbohydrate,
pyruvate
37 Carbohydrate,
pyruvate
38 Carbohydrate,
storagepolysaccharide
synthesis
39 Carbohydrate,
sucrose
synthesis
Table 1. (Continued).
The metabolic shift in pyruvate
metabolism (from homolactic to
mixed-acid fermentation) is studied.
It is shown that PFL plays a key role
and allosteric inhibition of PFL and
altered pfl gene expression are
important in the regulation
of the shift
Lactate dehydrogenase and NADPH
oxidase have major control on the
lactate flux. Experiments with lactate
dehydrogenase knockout and
NADPH oxidase overexpressing
L. lactis strains confirmed the
predictions
Even without a priori assumptions
about the optimization of the
metabolism. The model can predict
that the transformation of five
pyruvates into two citrates plus one
malate is the dominating reaction.
The conversion of pyruvate into its
products is almost optimal with
93% efficiency
Ultrasensitivity of metabolic pathways
is studied. Amplifications of up to
20-fold in storage-polysaccharide
synthesis can be achieved with a
6.7-fold increase in
3-phosphoglycerate in the
presence of 5 mM Pi
Overexpression of the fructose or
glucose transporter or the vacuolar
sucrose import protein and a
reduction of cytosolic neutral
invertase levels are the most
promising targets for genetic
manipulation
Major findings
FEBS Journal 278 (2011) 2767–2857 ª 2011 The Authors Journal compilation ª 2011 FEBS
ODE
ODE
Stoich
ODE
ODE
Model
sim, sens,
SNA
ss, sim,
bif
SNA
ss, sim,
fit, sens
sim, fit
Analysis
METATOOL
SCOP, AUTO
MATHEMATICA
GEPASI
NG
Software
Time series of proteins
measured by ELISA and
assay kits; metabolites
measured by refractometry
and photometry
Experiment
NG
BM 23,
JWS
Refers to single time point
of fluxes and enzyme
kinetics
Single time point of
metabolites and fluxes
measured by assays
and radio labeling
Refers to single time point
of fluxes measured by
carbon labeling
BM 17,
JWS
NG
Time series of metabolites
and fluxes measured by
HPLC; cell density measured
by spectrophotometry
NG
Access
Rohwer JM &
Botha FC (2001)
Biochem J
358, 437–445.
´
Gomez-Casati DF,
Cortassa S, Aon
MA & Iglesias AA
(2003) Planta
216, 969–975.
Hoefnagel MHN,
van der Burgt A,
Martens DE,
Hugenholtz J &
Snoep JL (2002)
Mol Biol Rep 29,
157–161.
Stucki JW &
Urbanczik R (2005)
FEBS J 272,
6244–6253.
Melchiorsen CR,
Jensen NB,
Christensen B,
Jokumsen KV &
Villadsen J (2001)
Biotechnol Bioeng
74, 271–279.
References
K. Hubner et al.
ă
Systems biology in biochemical research
2785
2786
Saccharum
officinarum
Saccharum spp.
Xanthomonas
campestris
Aspergillus niger;
Aspergillus
nidulans
Candida mogii
41 Carbohydrate,
sucrose
synthesis
42 Carbohydrate,
xanthan
synthesis
43 Carbohydrate,
xylose
catabolism
44 Carbohydrate,
xylose
catabolism
Organism,
cells
40 Carbohydrate,
sucrose
synthesis
Entry System
Table 1. (Continued).
Xylitol production is optimal for a
substrate of 10% glucose and
90% xylitol
The first polyol dehydrogenase in the
catabolic pathway of xylose exerted
the main flux control in the two
strains A. nidulans and A. niger
NW324, although the flux control
was exerted mainly at the first
enzyme of the pathway (XR) in
A. niger NW 296
Major constraint for maximum
xanthan gum production concerns
energy availability (i.e. respiratory
chain efficiency rather than carbon
precursor supply)
The model supports a hypothesis of
vacuolar sucrose accumulation
against a concentration gradient.
Fructose uptake by the cell and
sucrose uptake by the vacuole had a
negative control on the futile cycling
of sucrose and a positive control on
sucrose accumulation, whereas the
control profile for neutral invertase
was reversed
Different isoforms of sucrose
synthase can have significant
differential effects on metabolite
concentrations in vivo
Major findings
ODE
ODE
Stoich
ODE
ODE
Model
sim, fit
ss, MCA
FBA,
opt
ss, sim,
MCA
ss, sim,
sens
Analysis
MATLAB
NG
EXCEL
SCAMP
PYSCES
COPASI,
Software
Experiment
Time series of biomass
measured by weighting
and spectrophotometry;
metabolites measured by
HPLC; rates measured by
gas chromatography; single
time point of enzyme
activities measured
by assays
Single time point of
metabolites measured
by HPLC
NG
NG
NG
Time series of metabolites
measured by assays
Enzyme kinetic
measurements
JWS
NG
Refers to enzyme kinetic
measurements and single
time points of metabolites
and fluxes
Access
Prathumpai W,
Gabelgaard JB,
Wanchanthuek P,
de Vondervoort
PJI, de Groot MJL,
McIntyre M &
Nielsen J (2003)
Biotechnol Prog
19, 1136–1141.
Tochampa W,
Sirisansaneeyakul
S, Vanichsriratana
W, Srinophakun P,
Bakker HHC &
Chisti Y (2005)
Bioprocess
Biosyst Eng 28,
175–183.
Schafer WE, Rohwer
ă
JM & Botha FC
(2004) Eur J
Biochem 271,
39713977.
Letisse F,
Chevallereau P,
Simon JL &
Lindley N (2002)
J Biotechnol 99,
307–317.
Uys L, Botha FC,
Hofmeyr JHS &
Rohwer JM (2007)
Phytochemistry
68, 2375–2392.
References
Systems biology in biochemical research
K. Hubner et al.
ă
FEBS Journal 278 (2011) 27672857 ê 2011 The Authors Journal compilation ª 2011 FEBS
Saccharomyces
cerevisiae
Organism,
cells
Arthrospira
platensis
Aspergillus
niger
47 Central
48 Central
46 Carbohydrate,
Aspergillus
xylose/arabinose niger
catablism
45 Carbohydrate,
xylose
catabolism
Entry System
Table 1. (Continued).
Oxygen (or some other electron
accepting system) is required to
resolve the redox imbalance caused
by cofactor difference between
xylose reductase and xylitol
dehydrogenase. Other factors limit
glycolytic flux when xylose is the
sole carbon source
Flux control in A. niger is analyzed for
engineering purposes. Flux control
does not reside at the enzyme
following the intermediate with the
highest concentration, L-arabitol, but
is distributed over the first three
steps in the pathway, preceding and
following L-arabitol. Flux control
appeared to be strongly dependent
on the intracellular L-arabinose
concentration
Photosynthetic growth is coupled to
production of NADH,H+ and
therefore balancing for these
conditions is only possible with one
pathway converting NADH,H+ to
NADPH,H+, the only form regulated
by photosynthesis in Arthrospira.
This is performed via the metabolic
shunt of PEP to pyruvate through
PEP carboxylase, malic enzyme and
NAD+-dependent malate
dehydrogenase
First detailed description of the
central carbon metabolism of this
microorganism is delivered. Essential
biochemical reactions were
identified for different carbon
sources. Application of the model for
assessing the metabolic capabilities
of A. niger to produce metabolites
was evaluated by using succinate
production as a case study
Major findings
FBA,
SNA
Analysis
FEBS Journal 278 (2011) 2767–2857 ª 2011 The Authors Journal compilation ª 2011 FEBS
Stoich
FBA
FDA
ODE
Stoich
ss,
MCA
Stoich
Model
MATLAB
LINDO,
MATLAB
SCAMP
NG
Software
NG
NG
Refers to single time point
of growth rates
Refers to single time point
of metabolites
David H, Akesson M
& Nielsen J (2003)
Eur J Biochem 270,
4243–4253.
Cogne G, Gros JB &
Dussap CG (2003)
Biotechnol Bioeng
84, 667–676.
Single time point of enzyme de Groot MJL,
activities measured by assay Prathumpai W,
kits, proteins measured by
Visser J & Ruijter
SDS/PAGE
GJG (2005)
Biotechnol Prog
21, 1610–1616.
NG
Jin YS & Jeffries
TW (2004) Metab
Eng 6, 229–238.
References
Time series of metabolites
measured by HPLC; cell
growth measured by
spectrophotometry
Experiment
NG
Access
K. Hubner et al.
ă
Systems biology in biochemical research
2787
2788
Corynebacterium
glutamicum
Clostridium
acetobutylicum
50 Central
Corynebacterium
glutamicum
Escherichia
coli
51 Central
Canis lupus
familiaris,
MDCK (kidney
epithelial cells)
Organism,
cells
49 Central
Entry System
Table 1. (Continued).
52 Central
53 Central
Model
Stoich
Stoich
Stoich
ODE
Minimum substrate consumption flux
distribution to the fluxes estimated
from experiments unveiled high
overflow metabolism under the
applied process conditions
Although genome annotation
suggests the absence of most TCA
cycle enzymes, here, the results
demonstrate that this bacterium has
a complete, albeit bifurcated, TCA
cycle; oxaloacetate flows to
succinate both through
citrate/-ketoglutarate and via malate/
fumarate
C. glutamicum mutant strains show
markedly different relative flux
contributions (increased flux into the
PPP and lysine biosynthesis,
decreased flux into the TCA) at the
same time as maintaining a constant
supply of NADPH
Metabolic flux for lysine production is
compared for different carbon
sources, glucose and fructose.
Potential targets could be identified
for optimization of lysine production
by C. glutamicum on fructose
(e.g. modification of the PTS and
amplification of FBP)
Robustness of metabolic networks is
linked to redundancy.
Control-effective fluxes associate
genetic regulation with a optimal
trade-off between network flexibility
and efficiency
ODE
Major findings
FBA, opt,
SNA, rob
FBA
FBA, opt
sim, fit
sim, fit,
opt
Analysis
FLUXANALYZER
SIMULINK
MATLAB,
SIMULINK
MATLAB,
C/C++
Own in
NG
Software
Time series of metabolites
measured by 13C GC-MS,
MALDI-TOF MS and HPLC;
cell density measured by
spectrophotometry
Time series of metabolites
measured by anion
exchange chromatography
and assays; refers to
time series of cell
growth measured by
spectrophotometry
Time series of metabolites
and fluxes measured
by LC-ESI-MS
Experiment
Refers to single time
point of transcript
levels measured by
microarrays
NG
NG
Single time points of
metabolites measured by
GC and assay kits
NG
Upon
request
NG
Access
Stelling J, Klamt S,
Bettenbrock K,
Schuster S &
Gilles ED (2002)
Nature 420,
190–193.
Kiefer P, Heinzle E,
Zelder O &
Wittmann C (2004)
Appl Environ
Microbiol
70, 229–239.
Wittmann C &
Heinzle E (2002)
Appl Environ
Microbiol 68,
5843–5859.
Amador-Noguez D,
Feng XJ, Fan J,
Roquet N, Rabitz H
& Rabinowitz JD
(2010) J Bacteriol
192, 4452–4461.
Wahl A, Sidorenko
Y, Dauner M,
Genzel Y & Reichl
U (2008)
Biotechnol Bioeng
101, 135–152.
References
Systems biology in biochemical research
K. Hubner et al.
ă
FEBS Journal 278 (2011) 27672857 ê 2011 The Authors Journal compilation ª 2011 FEBS
Escherichia
coli
Escherichia
coli
Escherichia
coli
Escherichia
coli
Geobacter
sulfurreducens
55 Central
56 Central
57 Central
58 Central
Organism,
cells
54 Central
Entry System
Table 1. (Continued).
FEBS Journal 278 (2011) 2767–2857 ª 2011 The Authors Journal compilation ª 2011 FEBS
Construction of a model and
comparison of the simulation result
with the experimental data indicating
that the present model can simulate
the effect of the specific gene
knockouts to the changes in the
metabolisms to some extent
Pyruvate ferredoxin oxidoreductase is
the only activity able to convert
pyruvate into acetyl-CoA. Two
redundant pathways for acetate
assimilation are needed as a result
of a coupling between the TCA cycle
and acetate activation to acetyl-CoA
by acetyl-CoA transferase
Whereas most metabolic reactions
have low fluxes, the overall activity
of the metabolism is dominated by
several reactions with very high
fluxes. E. coli responds to changes
in growth conditions by reorganizing
the rates of selected fluxes
predominantly within this
high-flux backbone
The model correctly reproduces the
behavior of E. coli vis-a-vis substrate
mixtures. In a mixture of glucose,
glycerol, and acetate, it prefers
glucose, then glycerol, and
finally acetate
Temperature upshift induces
redirection of metabolic fluxes
(i.e. increased nongrowth-associated
energy demand and, thus, reduced
biomass yield)
Major findings
Stoich
ODE
Logic
Stoich
Stoich
Model
FBA, opt,
MOMA,
FVA, SNA
sim, fit
sim
FBA
FBA, opt
Analysis
NG
NG
NG
NG
MATLAB
Software
NG
NG
NG
NG
Time series of enzyme
activities measured by
spectrophotometry
and assays
Time series of fluxes and
metabolites measured by
enzymatic assays
and GC-MS
Single time points of fluxes
and mRNA measured
by microarrays
Segura D,
Mahadevan R,
´
Juarez K & Lovley
DR (2008) PLoS
Comput Biol
4, e36.
Asenjo AJ, Ramirez
P, Rapaport I,
Aracena J, Goles E
& Andrews BA
(2007) J Microbiol
Biotechnol 17,
496–510.
Kadir TAA, Mannan
AA, Kierzek AM,
McFadden J &
Shimizu K (2010)
Microb Cell Fact
9, 88.
Weber J, Hoffmann
Refers to time series of
biomass measured by
F & Rinas U (2002)
spectrophotometry and
Biotechnol Bioeng
80, 320–330.
weighting; proteins
measured by 2D gel
electrophoresis; metabolites
measured by HPLC, fluxes
calculated
´
Refers to single time
Almaas E, Kovacs B,
point of fluxes
Vicsek T, Oltvai ZN
& Barabasi AL
(2004) Nature 427,
839843.
NG
References
Experiment
Access
K. Hubner et al.
ă
Systems biology in biochemical research
2789
2790
Homo sapiens,
erythrocytes
Haemophilus
influenzae
Organism,
cells
Homo sapiens,
erythrocytes;
Methylobacterium
extorquens
60 Central
59 Central
Entry System
Table 1. (Continued).
61 Central
ODE
Stoich
Model
Stoich
A model for metabolic processes in
stored red blood cells was created
and validated, which can be
used to predict improvements
for erythrocyte storage
An in silico metabolic network model
of H. influenzae is used to define
proteins predicted to be essential or
non-essential for cell growth.
Comparison of data from in vivo
protein expression with the protein
list associated with a genome-scale
metabolic model showed significant
coverage of the known metabolic
proteome
Major findings
The principle of flux minimization to
fulfill cellular functions with minimal
effort is introduced. The method
exhibits significant correlations with
flux rates obtained by either kinetic
modeling or direct experimental
determination. Larger deviations
occur for segments of the network
composed of redundant branches
where the flux-minimization method
always attributes the total flux to the
thermodynamically most
favorable branch
FBA
sim, fit,
sens
FBA
Analysis
NG
E-CELL
NG
Software
BM 70,
JWS
NG
NG
Access
Refers to single time point
of fluxes
Time series of metabolites
measured by TOF-MS
Single time points of
metabolites measured by
assay kits; single time points
of enzyme activities
measured by assay kits
Experiment
Raghunathan A,
Price ND, Galperin
MY, Makarova KS,
Purvine S, Picone
AF, Cherny T,
Xie T, Reilly TJ,
Munson R, Tyler
RE, Akerley BJ,
Smith AL, Palsson
BO & Kolker E
(2004) OMICS
8, 25–41.
Nishino T,
Yachie-Kinoshita A,
Hirayama A, Soga
T, Suematsu M &
Tomita M (2009)
J Biotechnol 144,
212223.
Holzhutter HG
ă
(2004) Eur
J Biochem 271,
29052922.
References
Systems biology in biochemical research
K. Hubner et al.
ă
FEBS Journal 278 (2011) 27672857 ê 2011 The Authors Journal compilation ª 2011 FEBS
Homo sapiens,
HeLa (cervix
carcinoma cells)
Homo sapiens,
neutrophil
granulocytes
Homo sapiens,
skeletal muscle
Homo sapiens,
skeletal muscle
63 Central
64 Central
65 Central
Organism,
cells
62 Central
Entry System
Table 1. (Continued).
Overall, evidence is supplied that
constraint-based modeling
constitutes a promising
computational platform to: (a)
integrate high throughput technology
and establish a cross-talk between
experimental validation and in silico
prediction in cancer cell phenotype;
(b) explore the fundamental
metabolic mechanism that confers
robustness in cancer; and
(c) suggest new metabolic targets
for anticancer treatments
The role of the NADPH oxidase in
promoting oscillations was
confirmed. The model predicted an
increase in the amplitude of NADPH
oscillations in the presence of
melatonin, which was confirmed
experimentally
The developed model can be applied
to test complex hypotheses
involving dynamic regulation of
cellular metabolism and energetics
in skeletal muscle during
physiological stresses, such as
ischemia, hypoxia and exercise
With the estimated parameter values,
the model is able to simulate
dynamic responses to reduced blood
flow (ischemia) of key metabolite
concentrations and metabolic fluxes,
both measured and nonmeasured. A
general parameter sensitivity
analysis is carried out to determine
and characterize the parameters
having the most and least effects
on the measured outputs
Major findings
FEBS Journal 278 (2011) 2767–2857 ª 2011 The Authors Journal compilation ª 2011 FEBS
ODE
ODE
ODE
Stoich
Model
sim, sens,
fit
sim, fit
sim, osc
FBA
(dynamic)
Analysis
MATLAB
MATLAB
DLSODES,
MADONNA
BERKELEY
MATLAB
Software
Experiment
Refers to single time point
and time series of
metabolites and fluxes
Refers to single time point
of metabolites and fluxes
NG
Time series of metabolites
measured by imaging
NG
BM 143
Refers to time series of
cell growth
Access
NG
Dash RK, Li Y, Kim
J, Saidel GM &
Cabrera ME (2008)
IEEE Trans Biomed
Eng 55,
1298–1318.
Dash RK, Li Y, Kim J,
Beard DA, Saidel
GM & Cabrera ME
(2008) PLoS ONE 3,
e3168.
Olsen LF, Kummer
U, Kindzelskii AL &
Petty HR (2003)
Biophys J 84,
69–81.
Resendis-Antonio O,
Checa A &
´
Encarnacion S
(2010) PLoS ONE
5, e12383.
References
K. Hubner et al.
ă
Systems biology in biochemical research
2791