Tài liệu Area Socioeconomic Variations in Cancer Incidence and Stage at Diagnosis in New Jersey, 1996-2002 pdf
Bạn đang xem bản rút gọn của tài liệu. Xem và tải ngay bản đầy đủ của tài liệu tại đây (1.19 MB, 113 trang )
Area Socioeconomic Variations in Cancer
Incidence and Stage at Diagnosis in New Jersey,
1996-2002
Prepared by
Karen Pawlish, MPH, ScD
Raj Gona, MPH, MA
Lisa M. Roché, MPH, PhD
Betsy A. Kohler, MPH, CTR
Susan Van Loon, RN, CTR
Cancer Epidemiology Services
Public Health Services Branch
New Jersey Department of Health and Senior Services
Eddy A. Bresnitz, MD, MS
Deputy Commissioner/State Epidemiologist
New Jersey Department of Health and Senior Services
Fred M. Jacobs, MD, JD
Commissioner
New Jersey Department of Health and Senior Services
Jon S. Corzine
Governor
Cancer Epidemiology Services
New Jersey Department of Health and Senior Services
PO Box 369
Trenton, NJ 08625-0369
(609) 588-3500
www.state.nj.us/health
October 2007
INTENTIONALLY BLANK
ACKNOWLEDGMENTS
The following staff of the New Jersey State Cancer Registry and the Cancer Surveillance
Program in the Cancer Epidemiology Services were involved in the collection, quality assurance
and preparation of the data on incident cases of cancer in New Jersey:
Toshi Abe, MSW, CTR Harrine Katz, CTR
Pamela Agovino, MPH Joan Kay, CTR
Anne Marie Anepete, CTR Thuy Lam, MPH
Pamela Beasley Mireille Lemieux
Tara Blando, MPH Henry Lewis, MPH
Donna Brown-Horn, CTR Helen Martin, CTR
Stasia Burger, MS, CTR Ilsia Martin, MS
Emiliano Cornago, CTR Kevin Masterson, CTR
Kathleen Diszler, RN, CTR Carl C. Monetti
Thomas English, CTR John Murphy, CTR
Lorraine Fernbach, CTR Xiaoling Niu, MS
Ruthann Filipowicz Lisa Paddock, MPH
Cynthia Grayon, CTR Maithili Patnaik, CTR
Maria Halama, MD, CTR Theresa Pavlovcak, CTR
Essam Hanani, MD, CTR Barbara Pingitor
Denise Hansen Gladys Pyatt-Dickson, CTR
Marilyn Hansen, CTR Karen Robinson-Fraser, CTR
Kevin Henry, PhD Marcelina Rosario
Joan Hess, RN, CTR Antonio Savillo, MD, CTR
Margaret Hodnicki, RN, CTR Suzanne Schwartz, MS, CTR
Yvette Humphries Felicia Stewart
Nicole Jackson Celia Troisi, CTR
Jamal Johnson, BS, CTR Helen Weiss, RN, CTR
Linda Johnson, CTR Michael Wellins
Catherine Karnicky, CTR Homer Wilcox III, MS
We also acknowledge New Jersey hospitals, laboratories, physicians, dentists, and the states of
Delaware, Florida, Maryland, New York, North Carolina, and Pennsylvania that reported cancer
cases to the New Jersey State Cancer Registry.
Cancer Epidemiology Services, including the New Jersey State Cancer Registry, receives
support from the Surveillance, Epidemiology, and End Results Program of the National Cancer
Institute under contract HHSN261200544005C ADB N01-PC-54405, the National Program of
Cancer Registries, Centers for Disease Control and Prevention under cooperative agreement
1 U58/DP000808-01, and the State of New Jersey.
iii
TABLE OF CONTENTS
Acknowledgments……….…………………………………………………………… iii
Introduction………………………………………………………………………………1
Summary………………………………………………………………………………….3
Cancer Incidence by Poverty Level – New Jersey, 1996-2002…………….………… 5
All Cancer Sites Combined …………………………………………………… 6
Female Breast Cancer ………………………………….……………………….8
Cervical Cancer………………………………………………………………… 10
Colorectal Cancer……………………………………………………………… 12
Endometrial (Corpus and Uterus, NOS) Cancer…………………………………14
Esophageal Cancer…………… ……………………………………………… 16
Liver Cancer ………………………………………………………………… 18
Lung and Bronchus Cancer…….……………………………………………… 20
Melanoma of the Skin……………………………………………………………22
Non-Hodgkin Lymphoma……………………………………………………… 24
Oral Cavity and Pharynx Cancer…………………………………………………26
Ovarian Cancer…………………………………………………………….…… 28
Pancreatic Cancer…………………………………………………………….… 30
Prostate Cancer………………………………………………………………… 32
Stomach Cancer……………………………………………………………….….34
Thyroid Cancer……………………………………………………………….… 36
Urinary Bladder Cancer……………………………………………………….….38
Cancer Stage at Diagnosis by Poverty Level – New Jersey, 1996-2002 ………… 41
Female Breast Cancer…………………………………….…………………… 42
Cervical Cancer ……………………………………………………………… 46
Colorectal Cancer…………………………………………………………… ….50
Lung and Bronchus Cancer…….……………………………………………… 54
Melanoma of the Skin……………………………………………………………58
Oral Cavity and Pharynx Cancer ………………………………………………60
Prostate Cancer………………………………………………………………… 64
Technical Notes…………………………………………………………………………67
References …………………………………………………………………………….76
Glossary…… ………………………………………………………………………… 79
iv
Appendix A – New Jersey 2000 Population and Poverty Level Data………………… 81
Figure 1. Map of New Jersey Census Tracts by Poverty Level in 2000……………82
Table 1. New Jersey Population by Census Tract Poverty Level and
other characteristics in 2000 ……………………………………………83
Appendix B – New Jersey Cancer Incidence Rates Data Tables…….……………….…85
Table 2. Male Average Annual Cancer Incidence Rates by Poverty Level,
New Jersey, 1996-2002………………………………… ………………86
Table 3. Female Average Annual Cancer Incidence Rates by Poverty Level,
New Jersey, 1996-2002………………………………… ………………87
Table 4. White Male Average Annual Cancer Incidence Rates by Poverty Level,
New Jersey, 1996-2002………………………………… ………………89
Table 5. White Female Average Annual Cancer Incidence Rates by Poverty
Level, New Jersey, 1996-2002……….………………… ………………90
Table 6. Black Male Average Annual Cancer Incidence Rates by Poverty Level,
New Jersey, 1996-2002………………………………… ………………92
Table 7. Black Female Average Annual Cancer Incidence Rates by Poverty
Level, New Jersey, 1996-2002….……………………… ………………93
Table 8. Hispanic Male Average Annual Cancer Incidence Rates by Poverty
Level, New Jersey, 1996-2002…………………………… ……………95
Table 9. Hispanic Female Average Annual Cancer Incidence Rates by Poverty
Level, New Jersey, 1996-2002……….………………… ………………96
Appendix C – New Jersey Cancer Stage at Diagnosis Data Tables…….……………….99
Table 10. Stage at Cancer Diagnosis by Poverty Level, New Jersey Males,
1996-2002……………………………………………… ……….…… 100
Table 11. Stage at Cancer Diagnosis by Poverty Level, New Jersey Females,
1996-2002……………………………………………… ………….… 101
Table 12. Stage at Cancer Diagnosis by Poverty Level, New Jersey White Males,
1996-2002……………………………………………… ………….… 102
Table 13. Stage at Cancer Diagnosis by Poverty Level, New Jersey White Females,
1996-2002…………………………………………………… ….…… 103
Table 14. Stage at Cancer Diagnosis by Poverty Level, New Jersey Black Males,
1996-2002……………………………………………………… … …104
Table 15. Stage at Cancer Diagnosis by Poverty Level, New Jersey Black Females,
1996-2002……………………………………………… ………… …105
Table 16. Stage at Cancer Diagnosis by Poverty Level, New Jersey Hispanic
Males, 1996-2002 ……………….…………………………… ………106
Table 17. Stage at Cancer Diagnosis by Poverty Level, New Jersey Hispanic
Females, 1996-2002…………………………………………… ………107
v
INTENTIONALLY BLANK
vi
INTRODUCTION
Socioeconomic disparities in cancer incidence and mortality in the United States persist and
remain an urgent public health problem. Recent studies of cancer and both individual- and area-
level socioeconomic status (SES) have found low SES or poverty to be associated with higher
incidence of lung, cervical, stomach, oral, and esophageal cancer.
1-8
Also, a lower incidence of
breast cancer and melanoma has been observed among persons residing in poorer areas.
1-2,9
Socioeconomic disparities in stage at diagnosis have also been reported for prostate, female
breast, cervical, colorectal cancer, and melanoma of the skin.
1,10
One of the goals of the Healthy
People 2010 initiative of the U.S. Department of Health and Human Services is to eliminate
health disparities among racial/ethnic and socioeconomic groups.
11
The purpose of this report is
to provide information on socioeconomic disparities in cancer incidence and stage at diagnosis in
New Jersey for use by health planners, health care providers, researchers, and the public.
The poverty rate is the percentage of a population living in poverty and is a useful measure of
economic deprivation in a neighborhood or community. Census tract poverty rates from the
2000 U.S. Census were linked to New Jersey State Cancer Registry incidence data. New Jersey
census tracts were grouped by the poverty rate into three poverty area groups. The three poverty
area groups were defined as follows: areas with low poverty (less than 10% of the population
below the poverty level); areas with medium poverty (10 to 19.99% of the population below the
poverty level); and areas with high poverty (20% or more of the population below the poverty
level).
Average annual age-adjusted cancer incidence rates were calculated for each poverty area group
in New Jersey. Included in the report are the average annual age-adjusted incidence rates per
100,000 population for all types of cancer combined and 16 cancers that are the most common
types among men and/or women, or among the leading causes of cancer death. The 16 specific
cancer types are female breast cancer, cervical cancer, colorectal cancer, endometrial cancer,
esophageal cancer, liver cancer, lung and bronchus cancer, melanoma of the skin, non-Hodgkin
lymphoma, oral (oral cavity and pharynx) cancer, ovarian cancer, pancreas cancer, prostate
cancer, stomach cancer, thyroid cancer, and urinary bladder cancer. To compare incidence rates
in the poverty area groups, incidence rate ratios (RR) were calculated as the ratio of the
incidence rate in a poverty area group to the incidence rate in the areas with low poverty (with
less than 10% of the population below the poverty level).
In addition, the report includes charts presenting the stage distribution for seven cancers for each
poverty area group. These cancer types include six cancers for which screening tests are
recommended or early detection is feasible (female breast cancer, cervical cancer, colorectal
cancer, melanoma of the skin, oral cancer, and prostate cancer), as well as lung cancer, the
number one cancer killer in New Jersey.
The time period is the seven years from 1996 to 2002 for incidence rates and stage at diagnosis.
Data are provided by gender and area poverty group for all races combined. Data are also
provided for six population subgroups: black men, black women, Hispanic men, Hispanic
1
women, white men, and white women. Please see the Technical Notes on pp. 67-75 for
additional information on methods used for these analyses.
Additional New Jersey cancer incidence, mortality, and survival data are available, or will be
soon, from the Cancer Epidemiology Services office or on our website,
including:
• Cancer Incidence and Mortality in New Jersey 2000-2004;
• Cancer Incidence Rates in New Jersey’s Ten Most Populated Municipalities
1998-2002;
• Trends in Cancer Incidence and Mortality in New Jersey, 1979-2002;
• Cancer Survival in New Jersey 1979-1997;
• Cancer Prevalence in New Jersey on January 1, 2003; and
• Childhood Cancer in New Jersey 1979-2002.
Our new interactive cancer data mapping application provides incidence and mortality counts
and rates statewide and at the county level by year, age, sex, race, and ethnicity for the years
2000-2004 at o/nj/. This application will be updated as each
additional year’s data become complete. Other New Jersey and U.S. cancer data can be found on
the following websites:
• Cancer Control Planet
• North American Association of Central Cancer Registries’ Cancer in North
America 2000-2004
• Surveillance, Epidemiology and End Results Program (SEER) Cancer Statistics
2
SUMMARY
Cancer Incidence, 1996-2002
The average annual incidence rates of certain cancers, including cervical, esophageal, liver, oral
cavity and pharynx, and stomach cancer were significantly higher in the poorest areas in New
Jersey as compared to the wealthiest areas. Among men, lung cancer incidence rates were
significantly higher in the poorest areas, while lung cancer rates for women did not differ
substantially among the three poverty area groups (areas with high poverty, medium poverty, and
low poverty). Incidence rates of other types of cancers, including female breast, endometrial,
ovarian, thyroid, and urinary bladder, as well as melanoma of the skin, were lower in the poorest
areas than in the wealthiest areas.
The populations of the three area poverty groups differed substantially by race, ethnicity, and
other demographic characteristics. The poorest areas had a higher proportion of black and
Hispanic residents, as compared to the wealthiest areas. These demographic differences can
affect incidence rates in the poverty areas, especially for cancers with large differences in
incidence rates between racial groups, such as melanoma of the skin and prostate cancer. See
Table 1 on p. 83 for more information on the populations of the area poverty groups.
Cancer Stage at Diagnosis, 1996-2002
Disparities in stage at diagnosis for some cancers were observed among the poverty areas.
Among women newly diagnosed with breast cancer, women residing in the poorest areas were
less likely to be diagnosed at the in situ or local stage, as compared to women residing in the
wealthier areas. Similarly, a lower proportion of women diagnosed with cervical cancer who
resided in the poorest areas were diagnosed with local stage cancer. Among men and women
newly diagnosed with melanoma of the skin and oral cancer, residents of the poorest areas were
less likely to be diagnosed at the in situ or local stage. These disparities may be due to lack of
health insurance or access to screening and health care among persons living in poverty.
Disparities between the poverty areas in stage at diagnosis were less pronounced for colorectal,
lung, and prostate cancers.
3
INTENTIONALLY BLANK
4
Cancer Incidence by Poverty Level – New Jersey,
1996-2002
5
Total Cancer Incidence
• A total of 157,300 men and 148,330 women residing in New Jersey were diagnosed with
invasive cancer during 1996-2002.
• Among all men, the average annual cancer incidence rates were somewhat higher in the
areas with high poverty than in the areas with low poverty during 1996-2002.
• Cancer incidence rates were somewhat lower in the areas with high poverty compared to
the lowest poverty areas among all women.
• When comparing race-specific cancer incidence rates in the three poverty areas,
differences among the poverty areas were observed. Among white men, black men,
white women, and black women, incidence rates were highest among residents in the
areas with high poverty.
• Among Hispanic men and women, incidence rates were highest in the areas with low
poverty.
• In general, most cancers are related to a combination of heredity, lifestyle factors such as
smoking or secondhand smoke, diet, obesity, lack of physical activity, alcohol
consumption, sun exposure, and reproductive factors, certain occupational exposures, and
some infections. About a third of all cancers may be attributed to cigarette smoking.
See Tables 2-9 in Appendix B for additional information.
6
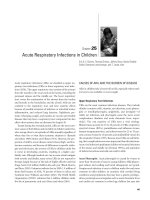
New Jersey Average Annual Cancer Incidence Rates* by Poverty Level, 1996-2002
All Cancer Sites
Males (n = 157,300)
0
100
200
300
400
500
600
700
800
All Races White Black Hispanic^
Age-adjusted rate (per 100,000)
<10% 10-19% ≥20%
Percent of Census Tract Population Below Poverty Level in 2000**
**<10%: 122,011 cases; 10-19%: 22,773 cases; ≥20%: 12,516 cases.
5,985 cases with missing census tract were excluded.
Females (n = 148,330)
0
100
200
300
400
500
600
700
800
All Races White Black Hispanic^
Age-adjusted rate (per 100,000)
<10% 10-19% ≥20%
Percent of Census Tract Population Below Poverty Level in 2000†
†<10%: 115,147 cases; 10-19%: 21,748 cases; ≥20%: 11,435 cases.
6,614 cases with missing census tract were excluded.
*Average annual rates are age-adjusted to the 2000 U.S. standard population (18 age groups).
In situ cases are not included, except for bladder cancer. 2002 data are preliminary.
^Hispanics may be of any race; therefore, the categories of race and ethnicity are not mutually exclusive.
Source: New Jersey State Cancer Registry, New Jersey Department of Health and Senior Services, 2005
7
Female Breast Cancer Incidence
• A total of 44,163 women residing in New Jersey were diagnosed with invasive breast
cancer during 1996-2002.
• Among all women, breast cancer incidence rates were highest among women residing in
the areas with low poverty. During 1996-2002, the average annual breast cancer
incidence rate in the areas with low poverty was 25% higher than that in the areas with
high poverty.
• Among both black and Hispanic women, the highest breast cancer incidence rates were
observed in the areas with low poverty. Among white women, the highest breast cancer
incidence rates were in the areas with high poverty.
• The known breast cancer risk factors include delayed childbirth / never having children,
early onset of menstruation, late menopause, a personal or family history of breast cancer,
as well as mutations in either of two genes, BRCA-1 and BRCA-2. Other risk factors
include biopsy-confirmed atypical hyperplasia, recent use of oral contraceptives or post-
menopausal estrogens and progestin, obesity after menopause, and moderate to heavy
alcohol consumption. Other factors that may be associated with breast cancer are lack of
physical activity and a diet high in saturated fat.
• Women in higher socio-economic status groups often have more breast cancer risk
factors than women in lower socio-economic status groups.
See Tables 2-9 in Appendix B for additional information.
8
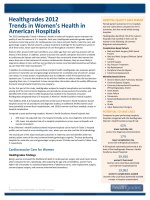
New Jersey Average Annual Cancer Incidence Rates* by Poverty Level, 1996-2002
Breast Cancer
Females (n = 44,163)
0
20
40
60
80
100
120
140
160
All Races White Black Hispanic^
Age-adjusted rate (per 100,000)
<10% 10-19.99% ≥20%
Percent of Census Tract Population Below Poverty Level in 2000†
†<10%: 35,170 cases; 10-19%: 6,038 cases; ≥20%: 2,955 cases.
1,455 cases with missin
g
census tract were excluded.
*Average annual rates are age-adjusted to the 2000 U.S. standard population (18 age groups).
In situ cases are not included. 2002 data are preliminary.
^Hispanics may be of any race; therefore, the categories of race and ethnicity are not mutually exclusive.
Source: New Jersey State Cancer Registry, New Jersey Department of Health and Senior Services, 2005
9
Cervical Cancer Incidence
• A total of 3,241 women residing in New Jersey were diagnosed with invasive cervical
cancer during 1996-2002.
• Among all women, cervical cancer incidence rates were highest among women residing
in the areas with high poverty. During 1996-2002, the average annual cervical cancer
incidence rate in the areas with high poverty was 2.4 times higher than the rate in the
areas with low poverty. The cervical cancer incidence rate in the areas with medium
poverty was 1.6 times higher than the rate in the areas with low poverty.
• A similar pattern of increased cervical cancer incidence in areas with high poverty also
was observed for white, black, and Hispanic women.
• The lower incidence in the areas with low poverty may be due in part to increased Pap
tests among higher-income women. Pap tests can detect abnormal cells that can lead to
cervical cancer or cervical cancer at the in situ stage, when it can be treated before
becoming invasive cancer.
• The main cause of cervical cancer is infection with certain types of human
papillomavirus (HPV). Infection with HPV is common in healthy women and does not
usually result in cervical cancer. Factors related to the persistence of HPV infection and
progression to cervical cancer include immunosuppression, cigarette smoking, and
nutritional factors. Other risk factors for cervical cancer include early age at first sexual
intercourse, many sexual partners or partners who have had many sexual partners,
multiple births, and long-term oral contraceptive use.
See Tables 2-9 in Appendix B for additional information.
10
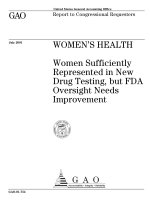
New Jersey Average Annual Cancer Incidence Rates* by Poverty Level, 1996-2002
Cervical Cancer
Females (n = 3,241)
0
5
10
15
20
25
30
35
All Races White Black Hispanic^
Age-adjusted rate (per 100,000)
<10% 10-19% ≥20%
Percent of Census Tract Population Below Poverty Level in 2000†
†<10%: 2,025 cases; 10-19%: 661 cases; ≥20%: 555 cases.
132 cases with missin
g
census tract were excluded.
*Average annual rates are age-adjusted to the 2000 U.S. standard population (18 age groups).
In situ cases are not included. 2002 data are preliminary.
^Hispanics may be of any race; therefore, the categories of race and ethnicity are not mutually exclusive.
Source: New Jersey State Cancer Registry, New Jersey Department of Health and Senior Services, 2005
11
Colorectal Cancer Incidence
• A total of 18,617 men and 18,627 women residing in New Jersey were diagnosed with
invasive colorectal cancer during 1996-2002.
• Among all men, the average annual colorectal cancer incidence rates were similar in the
areas with high, medium, and low poverty during 1996-2002. Colorectal cancer
incidence rates were also similar in the three poverty areas among all women.
• When comparing race-specific colorectal cancer incidence rates in the three poverty
areas, differences among the poverty areas were observed. Among both white and black
men, incidence rates were highest among men residing in the areas with high poverty.
• Among white and black women, colorectal cancer incidence rates were highest among
women residing in the areas with high poverty.
• Among Hispanic men, colorectal cancer incidence rates were highest among men
residing in the areas with low poverty, in contrast to white and black men. Rates among
Hispanic men in the areas with low poverty were approximately 74% higher than rates
among Hispanic men in the areas with high poverty.
• Hispanic women were observed to have highest rates in the areas with low poverty.
• Risk factors for colorectal cancer include age (the risk increases with increasing age), a
personal or family history of colorectal cancer and/or polyps, a personal history of
inflammatory bowel disease, smoking, alcohol use, physical inactivity, and a diet high in
saturated fat and/or red meat and low in fruits and vegetables.
• The lower incidence for whites and blacks in the areas with low poverty may be due in
part to increased screening in those areas, through which colon polyps are detected and
removed before they become cancerous.
• Among Hispanics, the lower incidence rates in the areas with high poverty may be due to
a higher proportion of more recent Hispanic immigrants in the areas with high poverty,
and possible differences in diet, physical activity, and other risk factors for colorectal
cancer between immigrants and other residents.
See Tables 2-9 in Appendix B for additional information.
12
New Jersey Average Annual Cancer Incidence Rates* by Poverty Level, 1996-2002
Colorectal Cancer
Males (n = 18,617)
0
10
20
30
40
50
60
70
80
90
All Races White Black Hispanic^
Age-adjusted rate (per 100,000)
<10% 10-19% ≥20%
Percent of Census Tract Population Below Poverty Level in 2000**
**<10%: 14,453 cases; 10-19%: 2,796 cases; ≥20%: 1,368 cases.
673 cas es with m iss ing census tract were excluded.
Females (n = 18,627)
0
10
20
30
40
50
60
70
80
90
All Races White Black Hispanic^
Age-adjusted rate (per 100,000)
<10% 10-19% ≥20%
Percent of Census Tract Population Below Poverty Level in 2000†
†<10%: 14,151 cases; 10-19%: 2,964 cases; ≥20%: 1,512 cases.
802 cases with missing census tract were excluded.
*Average annual rates are age-adjusted to the 2000 U.S. standard population (18 age groups).
In situ cases are not included. 2002 data are preliminary.
^Hispanics may be of any race; therefore, the categories of race and ethnicity are not mutually exclusive.
Source: New Jersey State Cancer Registry, New Jersey Department of Health and Senior Services, 2005
13
Endometrial Cancer Incidence*
• A total of 9,342 women residing in New Jersey were diagnosed with invasive
endometrial cancer* during 1996-2002.
• Among all women, the average annual endometrial cancer incidence rate during 1996-
2002 was somewhat lower among women residing in the areas with high poverty
compared to women in the areas with low poverty.
• Among Hispanic women, the endometrial cancer incidence rate was 27% lower among
women residing in the areas with high poverty compared to women in the areas with low
poverty.
• The relationship between poverty area and endometrial cancer incidence was reversed
among white and black women. For both white and black women, women residing in the
areas with high poverty had higher endometrial cancer rates than women residing in the
areas with low poverty.
• The major risk factor for endometrial cancer is a high lifetime exposure to estrogen, for
example, from estrogen replacement therapy without progestin, early onset of
menstruation, late menopause, and never having children. Other risk factors include
tamoxifen use, a history of polycystic ovary syndrome, infertility, and obesity. A diet
high in animal fat is a possible risk factor.
*Includes cancer of the corpus uteri and the uterus, NOS.
See Tables 2-9 in Appendix B for additional information.
14
New Jersey Average Annual Cancer Incidence Rates* by Poverty Level, 1996-2002
Endometrial Cancer
Females (n = 9,342)
0
5
10
15
20
25
30
35
40
All Races White Black Hispanic^
Age-adjusted rate (per 100,000)
<10% 10-19% ≥20%
Percent of Census Tract Population Below Poverty Level in 2000†
†<10%: 7,375 cases; 10-19%: 1,283 cases; ≥20%: 684 cases.
271 cases with missin
g
census tract were excluded.
*Average annual rates are age-adjusted to the 2000 U.S. standard population (18 age groups). Includes cancer of the
corpus uteri and uterus, NOS. In situ cases are not included. 2002 data are preliminary.
^Hispanics may be of any race; therefore, the categories of race and ethnicity are not mutually exclusive.
Source: New Jersey State Cancer Registry, New Jersey Department of Health and Senior Services, 2005
15
Esophageal Cancer Incidence
• A total of 2,179 men and 803 women residing in New Jersey were diagnosed with
invasive esophageal cancer during 1996-2002.
• Among all men, average annual esophageal cancer incidence rates during 1996-2002
were highest among men residing in the areas with high poverty. The esophageal cancer
incidence rate in the areas with high poverty was 2 times higher than rates in the areas
with low poverty. The esophageal cancer incidence rate in the areas with medium
poverty was 1.3 times higher than the rate in the areas with low poverty.
• Among all women, the esophageal cancer incidence rate was highest among women
residing in the areas with high poverty. The esophageal cancer incidence rate among
women in the areas with high poverty was 2.1 times higher than the rate in the areas with
low poverty.
• A similar pattern of increased esophageal cancer incidence rates in the areas with high
poverty was also observed for white men, black men, white women, and black women.
• Among men and women residing in the areas with low poverty, esophageal cancer
incidence rates were similar for whites and blacks. However, among men and women in
the areas with high poverty, esophageal cancer rates were higher among blacks than
whites.
• The most important risk factors for esophageal cancer are cigarette smoking, excessive
alcohol drinking, and a condition called Barrett’s esophagus. Other risk factors include
obesity, poor nutrition, and insufficient consumption of fruits and vegetables.
• The increased incidence of esophageal cancer in the areas with high poverty may be due
in part to a higher prevalence of risk factors such as cigarette smoking and lower
consumption of fruits and vegetables.
See Tables 2-9 in Appendix B for additional information.
16
New Jersey Average Annual Cancer Incidence Rates* by Poverty Level, 1996-2002
Esophageal Cancer
Males (n = 2,179)
0
5
10
15
20
25
All Races White Black Hispanic^
Age-adjusted rate (per 100,000)
<10% 10-19% ≥20%
Percent of Census Tract Population Below Poverty Level in 2000**
**<10%: 1,529 cases; 10-19%: 357 cases; ≥20%: 293 cases.
87 cases with missing census tract were excluded.
Females (n = 803)
0
5
10
15
20
25
All Races White Black Hispanic^
Age-adjusted rate (per 100,000)
<10% 10-19% ≥20%
Percent of Census Tract Population Below Poverty Level in 2000†
†<10%: 561 cases; 10-19%: 129 cases; ≥20%: 113 cases.
47 cases with missing census tract were excluded.
*Average annual rates are age-adjusted to the 2000 U.S. standard population (18 age groups).
In situ cases are not included. 2002 data are preliminary.
^Hispanics may be of any race; therefore, the categories of race and ethnicity are not mutually exclusive.
Source: New Jersey State Cancer Registry, New Jersey Department of Health and Senior Services, 2005
17
Liver Cancer Incidence
• A total of 1,753 men and 682 women residing in New Jersey were diagnosed with
invasive liver cancer during 1996-2002.
• Among all men, liver cancer incidence rates were highest among men residing in the
areas with high poverty. During 1996-2002, the average annual male liver cancer
incidence rate in the areas with high poverty was 1.8 times higher than the male rate in
the areas with low poverty. The liver cancer incidence rate in the areas with medium
poverty was 1.3 times higher than the rate in the areas with low poverty.
• Among all women, the liver cancer incidence rate in the areas with high poverty was 1.9
times higher than the rate in the areas with low poverty.
• A similar pattern of increased liver cancer incidence in the areas with high poverty was
also observed for white men, black men, and white women.
• Chronic infection with hepatitis B or C virus is an important risk factor for liver cancer.
Other risk factors for liver cancer include increasing age, cirrhosis of the liver (chronic
liver injury, often caused by alcohol abuse), ingestion of aflatoxin (a substance produced
by certain types of mold that invade poorly stored peanuts and other foods), cigarette
smoking, and occupational exposure to thorium dioxide or vinyl chloride. Possible risk
factors include use of anabolic steroids and some inherited metabolic diseases (e.g.,
hemochromatosis).
• The increased incidence of liver cancer in the areas with high poverty may be due in part
to a higher prevalence of infection with hepatitis B or C virus. The prevalence of both
infections in the U.S. has been reported to be higher among persons living below the
poverty line than persons above the poverty line.
12
See Tables 2-9 in Appendix B for additional information.
18
New Jersey Average Annual Cancer Incidence Rates* by Poverty Level, 1996-2002
Liver Cancer
Males (n = 1,753)
0
5
10
15
20
All Races White Black Hispanic^
Age-adjusted rate (per 100,000)
<10% 10-19% ≥20%
Percent of Census Tract Population Below Poverty Level in 2000**
**<10%: 1,224 cases; 10-19%: 309 cases; ≥20%: 220 cases.
144 cases with missing census tract were excluded.
Females (n = 682)
0
5
10
15
20
All Races White Black Hispanic^
Age-adjusted rate (per 100,000)
<10% 10-19% ≥20%
Percent of Census Tract Population Below Poverty Level in 2000†
†<10%: 481 cases; 10-19%: 111 cases; ≥20%: 90 cases.
72 cases with missing census tract were excluded.
*Average annual rates are age-adjusted to the 2000 U.S. standard population (18 age groups).
In situ cases are not included. 2002 data are preliminary.
^Hispanics may be of any race; therefore, the categories of race and ethnicity are not mutually exclusive.
Source: New Jersey State Cancer Registry, New Jersey Department of Health and Senior Services, 2005
19